i
Evaluating WI-FI indoor positioning approaches
In a real world environment
Raafat Hantoush
Internship report presented as partial requirement for
ii
NOVA Information Management School
Instituto Superior de Estatística e Gestão de Informação
Universidade Nova de Lisboa
Evaluating WI-FI indoor positioning approaches
In a real world environment
by
Raafat Hantoush
Internship report presented as partial requirement for obtaining the Master’s degree in advanced analytics
Advisor:Leonardo Vanneschi
Co Advisor: Fabian Brosig, Alexander Müller
iii
DEDICATION
iv
ACKNOWLEDGEMENTS
I would first like to thank my thesis advisor Professor Leonardo Vanneschi of NOVA IMS school at Universidade Nova de Lisboa. Prof. Leonardo shows a great support not only during my master study but also he provided all the academic and non-academic support to facilitate the coordination with the company and to secure my internship application. Also I owe Prof. Leonardo that he is the one who accepts my application for the master and that helps me a lot to get my first visa to Europe and to leave the very dangerous situation in my country in that time.
v
ABSTRACT
Global positioning system(GPS) does not provide generally a good positioning performance in an indoor location because of many reasons (Henniges, 2012). On the other hand, other alternatives such as the WI-FI technology has become recently in a popular use to provide indoor localization. And that is due to many reasons, such as the wide spread of WI-FI infrastructure in the indoor environments and the low cost of this technology. This study attempts to evaluate different WI-FI indoor positioning approaches in a real world environment. In particular, in retail stores and shopping malls. The pros and cons of each one of these approaches are pointed out.
The main purpose of this study from the company perspective is to explore the state of the art methods and the cutting edge technologies of the WI-FI IPS and to come up with an improvement of their indoor localization system. This system forms the core of the company`s retail-analytics product that uses a Wi-Fi positioning technology to provide indoor location based services for the customers and helps retailers to better understanding their businesses.
KEYWORDS
vi
INDEX
1. Introduction ... 1
2. Literature review ... 2
2.1.Foundations ... 2
2.1.1.What is 802.11? ... 2
2.1.2.802.11 networks building blocks: ... 2
2.1.3.Infrastructure wireless network design ... 2
2.1.4.Wi-Fi frames types ... 4
2.1.5.Location based services (LBS) ... 6
2.1.6.Indoor positioning system (IPS) ... 7
2.2.State of the art... 7
2.2.1.Proximity Detection (Cell-Of-Origin) ... 8
2.2.2.Triangulation Based (Angel Based Methods - AOA) ... 9
2.2.3.Lateration (Distance) Based ... 10
2.2.4.Pattern recognition based method (fingerprinting) ... 12
3. The Company `s Status quo ... 14
3.1.Company Basic Information ... 14
3.2.Company product description ... 14
3.3.How it works ... 17
3.3.1.Calibration phase (training phase) ... 19
4. Methodology ... 20
4.1.Experimental setup... 20
4.1.1.Experiments locations ... 20
4.1.2.Experiments components... 20
4.1.3.Experimental field ... 23
4.2.Exploratory Data analysis ... 25
4.2.1.Q1. What is the highest possible signal strength value that sensor antenna can emit? 25 4.2.2.Q2. Is there any device offset effect and how it affects the data quality? .. 26
4.2.3.Q3.What is the effect of multi floor and what the signal ranges are? ... 29
vii
4.2.5.Q5. Is there any effect of the choice of the aggregation method, based on an
interval time, on the data quality? ... 34
4.2.6.Q6. What kind of Shielding material that affects the WI-FI signal strength and direction? 36 4.3.Data preprocessing ... 44
4.3.1.Observation gathering ... 44
4.3.2.Aggregating the consecutive phase ... 44
4.3.3.Fingerprinting ... 46
4.3.4.Imputing the missing values ... 47
4.3.5.Scaling ... 48
4.3.6.Getting the vendor names of the client devices ... 49
4.3.7.Non-portable WI-FI-enabled devices filtering ... 50
4.3.8.Zone re-numbering ... 50
4.4. Feature engineering ... 51
4.5. Modeling-based mapping Approach implementation ... 51
4.6. Proximity Detection mapping Approach implementation ... 52
5. Results and discussion ... 55
6. Conclusions ... 58
7. Limitations and recommendations for future works ... 59
7.1.Angle of arrival (AOA) approach limitation and future work ... 59
7.2.Time difference of arrival Limitations and future work ... 60
7.3.Modeling based approach limitations and future work ... 61
7.4.Pre and post processing limitations and future work ... 61
viii
LIST OF FIGURES
Figure 2.1-WI-FI building block , [Gast ,2002] ... 2
Figure 2.2 - Network infrastructure mode, [Gast,2002] ... 3
Figure 2.3 - Extended service set, [Gast,2002] ... 3
Figure 2.4 - WI-FI generic data frame, [Gast,2002] ... 4
Figure 2.5 - WI-FI probe request frame, [Gast,2002] ... 5
Figure 2.6 - WI-FI probe request detail, [Wireshark] ... 5
Figure 2.7- WI-FI probe response frame, [Gast,2002] ... 6
Figure 2.8 - WI-FI management frames, [Cisco] ... 6
Figure 2.9 - Cell Of Origin, [Cisco] ... 8
Figure 2.10 - Angle of arrival, [Henniges, 2012] ... 9
Figure 2.11 - Time of arrival (TOA) , [Cisco] ... 10
Figure 2.12 - Time difference of arrival, [Cisco] ... 11
Figure 3.1 - The company`s product main dashboard, [Minodes] ... 15
Figure 3.2 - The company heatmap report 1, [Minodes] ... 16
Figure 3.3 - The company`s product heatmap Report 2, [Minodes] ... 17
Figure 3.4 - WI-FI access point, [TP-Link] ... 18
Figure 3.5 - WI-FI mesh network, [conniq.com] ... 18
Figure 3.6 - Realytics app , [Minodes] ... 19
Figure 4.1 - Measurement set phones ... 21
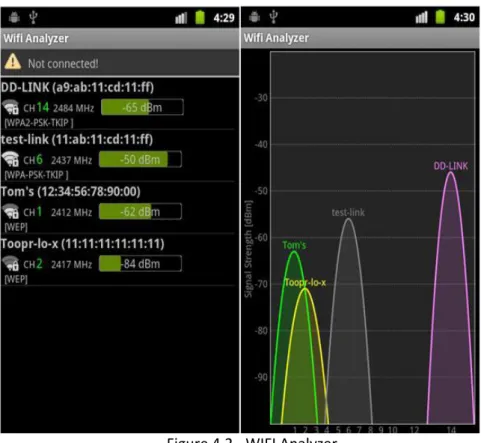
Figure 4.2 - WIFI Analyzer ... 22
Figure 4.3 - WI-FI access point(node) , [TP-Link] ... 23
Figure 4.4 - The experimental field, [Minodes] ... 24
Figure 4.5 - sample data ... 25
Figure 4.6 - Test case 1 - Phones in the same place ... 28
ix
Figure 4.8 - Test case 1 - A node on the ceiling ... 30
Figure 4.9 - Test case 2 - A node on the floor ... 31
Figure 4.10 - Test case 1 - controlled experiment ... 32
Figure 4.11 - Test case 2 - Uncontrolled experiment ... 34
Figure 4.12 - Aggregation method comparison ... 35
Figure 4.13 - Metal effect 1 ... 37
Figure 4.14 - Metal effect 2 ... 37
Figure 4.15 - Water effect 1 ... 39
Figure 4.16 - Water effect 2 ... 39
Figure 4.17 - Glass effect 1 ... 41
Figure 4.18 - Glass effect 2 ... 41
Figure 4.19 - Microwave effect 1 ... 43
Figure 4.20 - Microwave effect 2 ... 43
Figure 4.21 - Raw data ... 45
Figure 4.22 - Unfiltered grouped by vendor data ... 50
Figure 4.23 - Feature names, [Minodes] ... 52
Figure 4.24 - Cell of origin - few implementation ... 53
Figure 4.25 - Cell of origin mapping example ... 54
Figure 7.1 - Directional antenna ... 59
Figure 7.2 - MIMO-enabled WI-FI card [Amazon] ... 60
x
LIST OF TABLES
Table 4-1 - Minodes floor nodes installation ... 23
Table 4-2 - Highest signal strength ... 26
Table 4-3 - Observations gathering ... 44
Table 4-4 - Signals aggregating ... 46
Table 4-5 - Fingerprinting ... 47
Table 4-6 - Missing values imputing ... 48
Table 4-7 - Scaling... 49
xi
LIST OF ABBREVIATIONS AND ACRONYMS
802.11 IEEE standard to implement wireless local area network.
AP WI-FI access point.
RSS Received signal strength.
NTP Network transfer protocol.
GPS Global positioning system.
RF Radio frequency.
The company Minodes company.
Mapper The system that is used to estimate the clients` location.
MIMO Multiple input multiple output.
IPS Indoor positioning system.
1
1.
INTRODUCTION
This document represents the whole study that was done for the purpose of evaluating different approaches for indoor localization using WI-FI Technology. This study was held in Berlin, Germany in cooperation with Minodes company. The role of the author (Raafat Hantoush), as a research data scientist, was to conduct a practical scientific research to improve their retail analytics product. Specifically, to improve the company`s currently used WI-FI indoor positioning system by exploring the state of the art and cutting edge technologies in the indoor positioning approaches.
Firstly, this document starts with giving the reader an overview of 802.11 standard which represents the main medium of providing the indoor positioning services. That includes describing the building block of this standard and the Frames structures. It also gives an overview of the indoor positioning system. Then, this document points out the advance in this field and the state of the art of different WI-FI based methods with mentioning in detail the advantages and disadvantages of each one of these approaches comparing with the other approaches.
Secondly, a brief about the company`s retail analytics product is introduced. That includes mentioning the product features and the real problem that this product solves. Then, a detailed explanation is introduced to show how the company`s current indoor positioning system works.
Thirdly, the experimental setup is explained in detail by describing the field, locations, resources and other conditions that were applied during the experiments. Then, a detailed exploratory data analysis is presented for better understanding the underlying relationships and the analysis of the association between different factors that affect significantly the performance of the positioning system. After that, a data preprocessing and the feature engineering are presented. Also, an explanation of the conducted implementation of both of the modeling based and cell-of-origin approaches are presented.
2
2.
LITERATURE REVIEW
2.1.FOUNDATIONS
2.1.1. What is 802.11?
WI-FI is a wireless technology that uses a radio waves to connect computers and other network-enabled devices within a local area networks and connect them also to the worldwide networks. WI-FI technology uses the family of common standard IEEE 802.11 that is defined and managed by Institute of Electrical and Electronics Engineers (IEEE). The base version 802.11-1997 was released in 1997 and it was the first wireless networking standard in the family. Other standards in the same family followed the base one and they included several improvements and extensions in the specifications and corrections for the previous problems. Most of the conventional IEEE 802.11 standards use 2.4 GHZ and 5 GHZ bands (Gast, 2002, Chapter 1).
2.1.2.802.11 networks building blocks:
1. Distribution system is the backbone medium that transmits the frames between the access points to stay connected with each other to exchange information about the mobile stations. Ethernet is the most popular network technology that have been used to implement the distribution system.
2. Access point is the networking hardware that is used to connect wireless devices to a wired network as the main function in additions to other functions.
3. Wireless medium: 802.11 standard allows that many physical layers can be used as a medium to transfer frames between stations but the radio frequency (RF) physical layers proves to be the most popular ones.
4. Stations: any Wi-Fi-equipped computing devices can connect to a wireless network through a wireless network interface card and can send and receive data to other devices on the network.
2.1.3.Infrastructure wireless network design
The access point and the stations that are reached by it forms an area called basic service set (BSS) that is identified by 6-byte identifier called BSSID. In Infrastructure mode wireless
3
network type, when a client station within the BSS area wants to communicate with other stations, it should send the frame first to the access point and then the access point will forward the frame to the destination station. Using the access point (AP) is the main characteristics of this type of network (infrastructure mode).
Figure 2.2 - Network infrastructure mode, [Gast,2002]
Extended service set (ESS) is formed when several access points connect to each other (and hence their BSS`) via a distribution system that could be a wired or wireless.
4
2.1.4.Wi-Fi frames types
Comparing to Ethernet frames, Wi-Fi frames is a little bit more complicated because it needs more management and control features to be involved. Three main types of frames are existed; Data, control and management frames (Gast, 2002, Chapter 4) .
Data frames are the frames to carry the data from station to another which is the main purpose of the network is transfer data.
Figure 2.4 - WI-FI generic data frame, [Gast,2002]
Control frames: these frames are used to control and manage the access to the wireless medium. Some of these frames are:
Request to send frame (RTS): this control frame is used to request access to the wireless medium to transfer frames. This frame type has no frame body and the frame header is followed directly by FCS field.
Clear to Send (CTS): it is the answer of the previous request frame and it is contains only the frame header as RTS frame. It is sent by the receiver of the RTS frame to tell if the transmitter can start to send the large data frames over the wireless medium.
Acknowledgment (ACK): it provides a positive acknowledgment and is used with any data transmission, including plain transmission.
Management Frames
As mentioned before, wireless networks need management features more than the wired networks. 802.11 standards categorize this features in three processes; choosing the appropriate wireless network, authenticating the station to grant permission to connect to the network and, finally, associating the client into the network.
There are several types of management frames. We will mention the most important ones for our study:
5 Probe Request frame: This type of frame is transmitted by the client to scan for 802.11 networks in the area. The identifier of requested BSS network (SSID) along with the supported rates that the client station can communicate with, are transmitted in the frame body of this request to the access points. A broadcast SSID is used in case there is no specified or already defined network.
Figure 2.5 - WI-FI probe request frame, [Gast,2002]
Figure 2.6 - WI-FI probe request detail, [Wireshark]
6 Figure 2.7- WI-FI probe response frame, [Gast,2002]
Authentication request, authentication response are used for authentication process between the client and the access point. Association request and association response are the management frames that associate the client to the network.
Figure 2.8 - WI-FI management frames, [Cisco]
2.1.5.Location based services (LBS)
7
in use in military applications by the US government in 1970s through a satellite system which provides a global positioning service for people and objects (El-Rabbany, 2002, Chapter 1). This system is called GPS. In 1980s the US decided to democratise this system followed by Europe that built a similar system to provide this service. Since then other industries started to use this service to provide a better product and service with using the user`s information. Location based services became widely and heavily used especially when the smartphones become a main stream in the market. A good example automotive industry starts to embed this system in the cars to provide a navigation service. Other popular use is providing a marketing and advertising services inside the shopping malls and stores based on the user`s location data.
2.1.6.Indoor positioning system (IPS)
GPS system is used to be an efficient technology in providing an accurate positioning service in the outdoor locations. In contrast, this service suffers some obstacles that affect negatively this accuracy, such as signal attenuation caused by construction materials. Other reason is the multipath loss due to many reflections at surfaces (Ozsoy, Bozkurt, & Tekin, 2013). For these reasons, other technologies like WI-FI technology has been proposed to be the alternative of GPS in indoor positioning system and it shows a better positioning accuracy. Bluetooth, RFID are other examples of wireless technologies that can be used for indoor positioning system and they give good results as well. It is also an important to notice that Radio waves (RF) based positioning systems are not the only alternatives of GPS. This study will focus only on the WI-FI based indoor positioning systems (WPS) (Curran et al., 2011, pp. 61–78).
2.2.STATE OF THE ART
There are many approaches for locating client devices in an indoor environment using WI-FI Technologies. These approaches can vary by several factors such as the hardware needs, performance, accuracy, cost and maintenance. It is possible and useful to categorize these approaches based on the mechanism each of these approaches uses to estimate the location in the indoor environments. A taxonomy of WI-FI existing positioning approaches is:
Proximity Based Method:
Cell of Origin (Cell Identity). Triangulation Based method:
Angle of Arrival (AoA). Lateration (distance) based:
Time of Arrival(TOA) or Time of Flight(TOF).
Time Difference of Arrival (TDoA).
RSSI Based method.
Pattern recognition based method:
8
It is woth mentioning that sometimes the time of flight (time of arrival), time difference of arrival methods are considered as a separate time based methods. But in this study it was preferably categorized as a distance-based method because the calculation of the location at the end is based on the distance that was concluded from the time measurements. In the following we
2.2.1.Proximity Detection (Cell-Of-Origin)
This is the simplest approach for positioning. The position of the client station or user device is determined by the nearest cell of origin (Access point) (Henniges, 2012). The nearest cell is identified by the strongest signal that the client has received from the cell(node) within its range. This means that if the client station is within a range of more than one cell Access Point, the cell with the strongest signal will give its position to the client station. The Cell of origin approach is not only used with WI-FI based techniques but with other wireless technologies as well like GSM (Cell –ID) where it is more popular. (Farid, Nordin, & Ismail, 2013).
This approach is simple, fast, real-time positioning and no need for any hardware modification. Another advantage of this approach is the low impact of multi-path effect on the perofrmance of the approach. On the other hand, the serious limitation of this approach is the low and the insignificant accuracy of the location estimation. Because it reports the location as within the range of the nearest cell (node). Also, as another limitation, it suffers from the mutli-floor problem when the store is a multi-story and unfortunately this is the case of the majority of real world stores/shopes. And it is quite difficult using this approach to tell which floor the visitor is in and that is due to the signal overlap between stories.
9
2.2.2.Triangulation Based (Angel Based Methods - AOA)
In this method, the positioning of a client station determines relatively to the position of two known access points using geometric calculation called triangulation. The distance is calculated based on two known angles and the fixed distance between the two stations (See the figure below). This method requires the stations to be equipped by special antennas to be able to detect the angles of the incoming signals (Henniges, 2012). A directional antenna or a multiple antenna array (MIMO WI-FI interfaces) can be used for this purpose.
This technique provides a better accuracy than other techniques, specifically in direct line of sight enviorments. Also, it provides a real time positioning.
This technique has several drawbacks and limitations. The modification of hardware is needed to be able to perform the calculations for this approach. The stations should be equipped with special antennas( directional antennas) or multiple array antennas such as MIMO-Enabled WI-FI interface cards to be able to determine the angle. Because of this modification of hardware, the approach can be seen as costy solution and impractical, especially in the big stores and shops where many stations are needed to cover the whole indoor areas.
Another limitation of this approach is that its accuracy is affected by signal reflections.
10
2.2.3.Lateration (Distance) Based
In this method, the position is determined based on the distance measurements. In trilateration technique, the position is calculated based on the distance from three reference points(stations) (Henniges, 2012). The distance from the station to the mobile device is used as a radius of the circle that its circumference forms the potential position of the client device. The distance from the second station forms the radius of the second circle and the two intersection points of the two circles are the potential location of the device. So three circles needed to determine the exact position and a fourth station needed to give the position in three dimensional environment like multi floor building. As it is clear that the localisations in the lateration based technique depends a lot on the calculation of the distance. A three methods to calculate the distance are already in use and described below.
2.2.3.1. Time of arrival (TOA) or time of flight (TOF)
It uses the time measurement from the transmitter (client device) to the receiver (station) to calculate the distance between the client and the station (see the figure below). Since the calculation depends on the difference between the time of departure and time of arrival, all the receivers and the clients should be highly synchronized (Headquarters, 2008, Chapter 2). Any difference in the clocks affects negatively the distance calculation and hence the positioning estimation perofrmance.
11
It is clearly seen that the one critical drawback of this approach is the critical need of a very accurate time synchronization between the client devices and the stations in order to perform a correct calculations. Given that a very small difference of time produces a large difference(error) in location estimation. Another drawback of this approach is that in a real world scenario, more likely the client devices are not under control or, in another meaning, there is no access to these client devices in order to be able to perform the calculation and the synchronization.
It is worth mentioning that TOA approach provide better performace and accuracy in the location estimations in more open, large and high buildings where the multipath problem could be at the minimum.
2.2.3.2. Time difference of arrival (TDoA)
It is similar to TOA in terms of using the time of travel to calculate the distance. But instead of using the travel time from the client to the receiver, the difference in time arrival between each receiver are used to find the distance between each sensor. Each difference-of-arrival time measurements forms a hyperbolic curve on which the client lies on (see the figure below). The intersection between these curves is the position estimate of the mobile device (Headquarters, 2008, Chapter 2). In contrast to TOA, There is no need for synchronization between the client and the stations. However, the clocks of the stations should be synchronised in this method.
12
One advantage of this approach is the ability to perform a real time positioning. Also, For the previously mentioned reasons, it is clear that this approach is more popular than the previous one. Because it is easier to to implement and no need for the synchronisation with the client devices.
But on the other hand, it is still dificult to assure the highly accurate synchronizations between the stations (receivers). And it is similar to TOA in terms of its effect by the multipath and interference that could happen in indoor environment.
2.2.3.3. Received signal strength (RSS)
This method uses the attenuation of the emitted signal to calculate the distance of the client device from the reference node (Henniges, 2012). The received signal strength indicator (RSSI) is the most widely used signal related feature and it is measured by decibels.
One advantage of this approach is the significant cost effeciency of the implementation on a large scale. Because there is no need for any hardware modification or additional sources. Another advatnage which makes this approach similar to the previous techniques is the ability to perform real time positioning.
On the other hand, this approach shows a poor performance in real world indoor environment because its high effect by the multi-path and signal reflections.
2.2.4.Pattern recognition based method (fingerprinting)
This method uses pre-built database that contains a signal patterns (fingerprints) from the area of the interest that has been taken previously in a phase called a training phase (Navarro, Peuker, Quan, Clark, & Jipson, 2010). Each fingerprint contains all the information about the stations and the received signal strength(RSS) values. A location of new client device in the recorded area can be determined based on a similar pattern already existed in the fingerprint database. The similarity between the new fingerprint and the training data can be found by applying several machine learning and pattern recognition techniques.
13
database from the beginning. This serious problem is not even existed in the previous mentioned approaches because no historical states are stored.
On the contrary, the accuracy of RSSI fingerprinting based method is remarkably good. Also, as a very positive point is that no need for hardware modification or any special high-cost additional hardware. That makes it a very popular approach in the commercial market due to the cost effectiency on the large scale and due to the very practical and good localisations estimations that provided by this technique.
14
3.
THE COMPANY `S STATUS QUO
3.1. COMPANY BASIC INFORMATION Name: Minodes GmbH Company logo:
Physical Address: Friedrichstraße 224, 10969 Berlin, Germany Web address: www.Minodes.com
Email: [email protected] Telephone: +49 30 208 473 870
The responsible from the company side: Dr. Fabian Brosig, Alexander Müller Email of the responsible: [email protected]
3.2.COMPANY PRODUCT DESCRIPTION
The company provides a retail analytics cloud-based platform that helps the offline retailers to get better understanding of their customers’ behaviours and also their sales and marketing operations.
The insights and reports are published online to the retail owners. These insights answer a questions such as (see the three following figures):
How many visitors approximately visited a specific zone (department) in specific time in specific store?
How the customers visiting path look like inside the store?
17 Figure 3.3 - The company`s product heatmap Report 2, [Minodes]
3.3.HOW IT WORKS
18 Figure 3.4 - WI-FI access point, [TP-Link]
A mesh network was defined among all the nodes within each store to insure a stable communication medium to transfer data between nodes and to the internet via the master node.
Figure 3.5 - WI-FI mesh network, [conniq.com]
19
company`s system in every new store. The whole setup steps described in breif in the following:
The zones should be planned in advance before installing the nodes in the store. the zones should be drawn on the floor plan and should follow some conditions. For instance, the zone should be approximately 40 square meters.
The neighbouring area outside the store, especially in the very busy shopping street, should be also planned into zones if it possible.
After planning the zones carefully and drawn them on the store floors plans, the installation of the nodes in specific store can start and should take in consideration some concerns like the zone size and locations.
The nodes (WI-FI APs) should be installed and ready for receiving the incoming signals. Also the Mesh network should be configured properly and the master node should be connected to the internet to be able to send the data to the central servers regularly and frequently.
3.3.1.Calibration phase (training phase)
The calibration phase starts after making sure the setup was done properly.
The operation team start the calibrating phase by walking in constant speed in every square meter in every planned zone in the store. they do that by holding the measurement phones set that send WI-FI pings frequently. This measurement phones set include four to five phones from the most popular brands (Samsung, Sony, IPhone, HTC, Nexus). And to be able to reference every square meter during the calibration for better results, the “WI-FI Analyser” mobile application is used to increase the frequency of sending the pings during the calibration.
In the same time of the calibration phase, an in-house developed application(Realytics app) is used to label the reference data. Labelling the data means defining the zones that pings came from based on prior knowledge of the phone device location at a specific period of time.
20
4.
METHODOLOGY
4.1.EXPERIMENTAL SETUP
4.1.1.Experiments locations
The experiments and evaluation of the Wi-Fi positioning approaches, as well as all kinds of data analysis for the Wi-Fi data, have been located in the following locations: The company building: most of the experiments have been conducted in the
company floor where all the experiments conditions were fully controlled and manageable.
Neighbours locations: other experiments, especially those related to measuring some factors that affect the data quality and the analysis of the data,were located in the two floors above and down the company floor in the same building.
customer’s sites:For the data analysis purposes for some experiments, a live data was collected from the customer’s sites for a specific period of time from the sensors data. These customer’s sites such as Kadewe store, Kamden Market and ECC.
4.1.2.Experiments components
The measurement set: several mobile phones have been used for conducting the fully controlled experiments. These phones have these conditions:
22 The battery of these phones should be charged enough to avoid switching off the phones during the experiment time. (it happens that during some experiments, some phones were switched off after the starting time of the experiment and that results in excluding this phone from the whole experiment or repeating the experiment another time with the whole measurement set.
The application WIFI-analyser should be up and running during the whole time period of some experiments to increase the frequency of generating Wi-Fi signals (pings) which results in generating more data for analysis purposes. However, some experiments were held without using the Wi-Fi analyser to increase the frequency such as ping delays analysis.
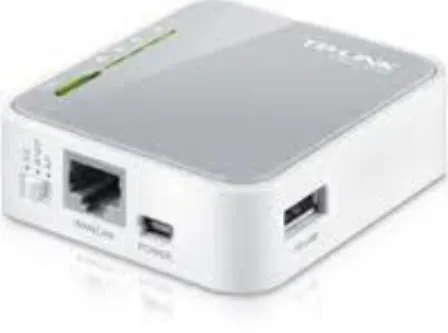
WI-FI access point: one or more Wi-Fi access points have been used to collect the Wi-Fi signals from the mobile phones and send this data to a central server for processing it. An access point (node) that is packaged and supports 802.11 standard with support of two networks bandwidth 2.4 and 5 GHz. (See the following figure).
23 Figure 4.3 - WI-FI access point(node) , [TP-Link]
A mesh network connecting all the access points (nodes) with each other to synchronise the time and to transfer the data.
Internet enabled Access point acts as a master node in the mesh network. Its main function is to receive all the data from the other nodes and transfer it periodically to the central server to do the calculation.
Portable node for some experiments where one node or more have been plugged with portable power charger to enable the free movement of the nodes during the experiment.
Central server to store all the data and do the processing. (the company server has been used for this purpose without using any dedicated server for this study experiments.
4.1.3.Experimental field
The company office has been prepared to be mainly used for most of the experiments. Dedicated nodes have been located in different locations in the office to cover the predefined zones. The setup has been done to assure that each zone was covered by one node. After that, a mesh network was configured properly between these nodes (Aps). The follwing table shows the IDs of the nodes that have been used to cover the zones that were named by the department name that is located in each of these zones. Also, the following figure shows the floor plan of the company marked with the nodes on top of it.
Table 4-1 - Minodes floor nodes installation Store id Node Id Zone ID Mac Address
23 13 Kitchen E8DE27B8B9CA
23 23 Kitchen Table E8DE27E12Bec
24
23 BizDev Master
23 8 Near entrance E8DE27B8B352
23 9 Management E8DE27C13D64
23 7 development E8DE27E121CA
23 6 Library E8DE27E139E2
23 1 Meeting room E8DE27E13CB4
23 5 Sales E8DE2769BCAC
23 4 Operation E8DE27E139E6
23 2 Product Management E8DE27E13AB2
25 4.2. EXPLORATORY DATA ANALYSIS
The purpose of this analysis is to understand deeply the relationship between different variables and the general effect on the accuracy of the indoor positioning system. This analysis focused mainly on the signal strength (RSS) value because it is the most important predicror(factor) for the majority of the indoor positioning approaches. Also in this analysis it was tried to answer the most important questions that was raised by the company and the curiosity of the researcher. For answering each of these quesions, multiple test scienarios were applied with raising the strength and weakness of each one of these tests.
The following figure shows the data format that had been used in all the experiments. This data was captured from a specific node(AP) within a specific period of time.
Figure 4.5 - sample data
4.2.1. Q1. What is the highest possible signal strength value that sensor antenna
can emit?
Findings:
It seems that the highest value depends on the phone itself. For e.g, Nexus and HTC gave the highest possible value -2,-3 respectively whereas Iphone and Sony xperia gave the lowest possible values -14,-17 but still all of them in -10s range.
HTC and Nexus gave the extreme lowest signal values (the rare signals) and it seems it is correlate with the ping frequency, the more the device pings the stranger values.
26
It could be useful to use this insight for data pre-processing purposes and outlier detection.
Test cases:
Putting the measurement phones exactly near and in touch with management`s node.
Putting the measurement phones exactly near and in touch with development`s node.
Test weaknesses:
The phones were put exactly near the sensors but probably the sensor antenna location and direction was near to some of the phones more than others.
The test was applied only for 5 different phones.
Test strengths:
Applying the test to two different sensors.
Table 4-2 - Highest signal strength
Node#1 Node#2
Phone_name Signal_strength Signal_strength
other_rafael_sony -17 -13
yellow_htc -2 -8
yellow_iphone -14 -16
yellow_nexus -3 0
yellow_sony -7 0
4.2.2.Q2. Is there any device offset effect and how it affects the data quality?
Findings:
27 HTC and Nexus recorded the highest values comparing to Iphone who
emitted the lowest RSS values.
The phones from the same vendor show a similar behaviour which makes sense and gives us a positive advantage to categorize the phones by vendor regardless the phone model. e.g. two sony phones.
The ranges.
Insightsandpotentialuse:
There is a device offset and could be useful to take it in consideration in the data preprocessing phase especially for the model based approach.
The similarity of vendor`s phones behaviours could be helpful in categorizing the phones by vendor regardless the model numbers.
Testcases:
Putting the phones near each other in the same place for the same period of time and measure the signal strengths from a specific node.
Putting the phones near each other and changing their locations over time for five different locations and measuring the signal strengths from a specific node.
Test weaknesses:
The phones were put exactly near each other but probably the sensor antenna location and direction was near to some of the phones more than others.
The test was applied only for 5 different phones.
Test stregnths:
The test repeated three times and showed the same results.
The test was applied in real world environment.
28 Figure 4.6 - Test case 1 - Phones in the same place
Test case #2(Changing location over time)
29
4.2.3.Q3.What is the effect of multi floor and what the signal ranges are?
Findings:
In case of the node in the ceiling of the floor, the results show that the signal strength ranges has a similar values on the floor above (Contorion floor) as Minodes floor (e.g. the Muller node has rceived the same ranges of the singal strenghts values from the phone that is located in Minodes floor as from the same phone when it was located in the floor above(Contorion floor), and a lower values when the phone was placed in the floor down. On the contract, in the case of the node is located in the ground floor (e.g. Fabian node), we got similar range values in the floor down as Minodes floor and different ranges (lower values) in the floor above.
To solve the multi-floor probelm, placing the nodes on the ground could be an effective solution.
Insights and potential use:
There is a device offset and could be useful to take it in consideration in the data preprocessing phase especially for the model based approach.
The similarity of vendor`s phones behaviours could be helpful in categorizing the phones by vendor regardless the model numbers.
Test cases:
Distribute the phones at five different locations in Minodes floor for a specific period of time and repeat the experiment on the up floor and the down floor with the approximate locations and for the same period of time.
Collect the measurements from a sensor that is located in the ceiling (e.g. Muller node) of Minodes floor.
Collect the measurements from a sensor that is located on the desks (e.g. Fabian node) of Minodes floor.
Test weaknesses:
the phones in the down floor were put in locations not exactly as the places in the other floors because the layout in the down floor was completely different and it was not possible to do accurate approximations of the locations.
30
was different than the other two floors. Therefore, it could be a device offset in this experiment.
The test was applied only for 5 different phones.
The test was made only one time because we didn’t want to disturb the neighbours.
Test stregnths:
The test measurements were collected by two nodes to show the distance effect (one in the ceiling, another in the roof).
The test was applied in real world environment.
Test Case#1 (A node on the ceiling)
31
Test Case#2(A node on the floor)
Figure 4.9 - Test case 2 - A node on the floor
4.2.4.Q4. What is the effect of ping delays and is it different by vendors?
Every Wi-Fi-enabled mobile device sends pings (probe requests) to the available Wi-Fi access points (nodes). The client device keeps sending these pings frequently. This frequency of sending the pings could be constant or variant over time based on many factors. One of these factors, for instance, if the phone in active mode or standby mode.
Test Case#1 (controlledexperiment): the measurement phones were used in this experiment inside Minodes building in real world environment to test for the ping delays (frequencies).
Findings:
It seems that the ping frequency varies between different phones vendors and almost the same within the same phone vendor.
No clear pattern was found and probably due to the fact that there are many confounding variables that affect the ping frequency.
These factors are such as:
32 Battery level: when the battery is low, the ping frequency became lower
in order to reduce the power consumption.
WI-FI Connectivity status: if the phone is connected already to one of the available WI-FI networks.
The phone vendor which is also affects the ping frequency.
Insight and potential use:
It could be useful to use this insight for both data pre-processing and post-processing purposes.
Testcases:
Putting the measurement phones near specific node and collect node readings.
Test weaknesses:
The test was not able to cover precisely the different factors mentioned above which affects remarkable the ping frequency and the results was not consistent.
The test was applied only one time.
Test strengths:
Applying the test to 6 different phones from different vendors.
33
Test Case #2 (uncontrolledexperiment)
For the purpose of measuring and evaluation the ping delays for different phones. A sample of data was collected from one of the company clients based on a specific period of time and from a restricted randomly chosen node. This sample contains all the Wi-Fi pings from the WI-FI-enabled devices that were in the range of the selected node in the client store. The node that was chosen to collect the data from, is located in a popular area in the store where the clients mostly visit. The main reason for this selection is that the more clients bypass in the area that is covered by the selected node, the more data were collected from more diverse phone models. Hence, a better data analysis for the ping delay case. After filtering out the non-portable WI-FI-enabled devices pings, and after getting the vendor names for all the client devices in the selected data. A lambda function has been defined to calculate the time difference between two consecutive pings by the same client device. This time difference was called delta. To get the overall analysis of the phone vendors, this delta values was grouped by phone vendor.
Findings:
Signals from all WI-FI-enabled devices in the store were collected and that includes fixed devices in the store such as: desktop pcs/tablets/printers, etc. this shows the importance of the pre-processing phase to filter these kinds of data.
Apple and Samsung devices show the lowest variation in ping frequency and the highest values of the ping frequency which is very good condition for the data quality.
Insight and potential use:
It could be useful to use this insight for data pre-processing purposes and post-processing purposes.
Testcases:
Collecting the data from a specific store for specific period of time (around one hour) then grouping the data by phone vendor.
Test weaknesses:
No pre-known conditions of all the phones that were in the experiment which provides no insights about the confounding variables that affect the ping delay.
34
Test strengths:
The test was applied in a real world environment.
The test used a large sample of data.
The test did not control any of the conditions of the phones to show the randomness and to represent the real world environment. (the same point that was considered before as a test weakness).
Figure 4.11 - Test case 2 - Uncontrolled experiment
4.2.5.Q5. Is there any effect of the choice of the aggregation method, based on an
interval time, on the data quality?
Findings:
Well, there is a remarkable effect on the signal representation by choosing a different methods of the aggregation by interval time. Choosing the "Min" function is the worst option. On the other hand, choosing Max seems to be the most reasonable method since it reduces the interference between signals ranges or it makes the ranges as far as possible between two client devices.
Insights and potential use:
Changing the aggregation method in the Minodes data pre-processing phase to be "Max".
35 Putting two Sony phones within a 2-meter distance relatively to a specific node for one hour and change their locations to make them a bit closer (1-meter) to see the effect of the aggregation method on the signals interference.
Collect the measurements from the "Muller node" for these two phones.
Collect the measurements from the "Operation node" for these two phones.
Test weaknesses:
The test was applied only for two different phones.
Test strengths:
The test measurements were collected by two nodes to check the pattern.
The test was applied in real world environment.
Two same-vendor phones were used in this test to reduce the device offset effect.
36
4.2.6.Q6. What kind of Shielding material that affects the WI-FI signal strength
and direction?
Findings:
After trying many materials, no remarkable effect of these materials on the Wi-Fi signals and play no remarkable role in practical in shielding it.
No practical solution was found for solving the multi-floor problem that was mentioned before and which is the main catalyst for this experiment.
Insight and potential use:
As mentioned before, there is no practical useful insight from this experiment but it helps to redirect the research of solving the multi-floor problem to a different direction.
Testcases:
Test Case #1 - Metal effect
sticking one node(AP) on the wall and then covering it by a metal. Collecting the readings from this node for three of the measurement set phones that were placed in the same place for a specific period of time.
The following line chart shows the three received strengths values for these three phones over time.
Note: the following line chart shows a dramatic increase in the beginning and that’s only because the location of two of the phones was changed during the test.
Test weaknesses:
The test was applied only with the metal material that showed in the following figure without trying different metal effects.
The test has been applied on one sensor without trying with another one just to increase the confidence of the results.
The metal does not cover tightly the sensor from all directions.
Test strengths:
Appling the test in real world environment.
Results:
37 Figure 4.13 - Metal effect 1
38
Test Case #2 - Water effect
sticking one node(AP) on the table and then covering it by the water. Collecting the readings from this node for five of the measurement set phones that were placed in the same place for a specific period of time.
The following line chart shows the five received strengths values for these five phones over time.
Note: the following line chart shows no values for some phones in some points of the measured time and that is due to the ping delay that was discussed before.
Test weaknesses:
The test has been applied on one sensor without trying with another one just to increase the confidence of the results.
The water does not cover tightly the sensor from all directions.
Test strengths:
Appling the test in real world environment.
Results:
39 Figure 4.15 - Water effect 1
40
Test Case #3 - Glass effect
Sticking one node(AP) on the table and then covering it by the glass as in the following figure. Then, Collecting the readings from this node for three of the measurement set phones that were placed in the same place for a specific period of time.
The following line chart shows the three received strengths values for these three phones over time.
Note: the following line chart shows dramatic fluctuation for Sony phone (The personal phone of the researcher) in some points of the measured time and that is due to the changing of the location over time because of making calls during the experiment. Thus excluding the measurement of this phone could be better for analyzing the results. And it was chosen to continue this experiment and not repeating it just to show the real world environment effect.
Test weaknesses:
The test has been applied on one sensor without trying with another one just to increase the confidence of the results.
The glass does not cover tightly the sensor from all directions.
Test strengths:
Appling the test in real world environment.
Results:
41 Figure 4.17 - Glass effect 1
42
Test Case #4 - Microwave effect
Given that Microwave oven uses a radio waves and the waves are highly isolated inside the oven, the purpose of this test is to figure out if this isolation holds for WI-FI signals and if so, is it because the device special materials?
Putting one sensor inside the microwave oven with closed door. And collecting the readings from the node for two specific phones that were placed in the same location for a specific period of time. The readings were collected before and after putting the node inside the microwave oven to make the comparisons.
The following line chart shows the two received strengths values for these two phones over time.
Test weaknesses:
The test has been applied on one time without trying with another sensor on another time just to increase the confidence of the results.
No high clear evidence of the true effect.
Test strengths:
Appling the test in real world environment.
Results:
43 Figure 4.19 - Microwave effect 1
44 4.3.DATA PREPROCESSING
4.3.1.Observation gathering
The first step in the data preprocessing is to collect the data from the files that come from the nodes(APs) and store the data into a structured database as records labeled with the node id as described in the following table:
Table 4-3 - Observations gathering
Observation gathering
Input Output Data Attributes
Files from Observation
receiver phone_1;10:00:01,0421;-60db phone_1;10:00:01,0451;-60db phone_1;10:00:00,0111;-55db phone_1;10:00:01,0421;-70db phone_1;10:00:01,0431;-80db phone_1;10:00:01,0222;-85db Node_id Mac_ Address Timestamp RSSI value
This step could be improved through using machine learning techniques to detect the best time to transfer the data from the slaves’ nodes to the master node to reduce the data loss due to the half-duplex mode.
4.3.2.Aggregating the consecutive phase
The phones usually send a very consecutive pings in a mille-second fraction, these pings usually have different signal strengths (see the following figure). The company current
N
1N
245
system (data pipeline) aggregates these consecutive pings using median value that stores in one record that replaces those consecutive records (pings). But after analyzing the signal strength of these consecutive pings, it turns out that getting the ping with the maximum RSS value and ignores the other pings give a better discrimination ability for the signal strength and lead to better positioning prediction using different approaches. The following table shows an example of the input and the output of this step.
46 Table 4-4 - Signals aggregating
Signals aggregating (bursting)
Input Output Data Attributes
phone_1;10:00:01,0421;-60db phone_1;10:00:01,0451;-60db phone_1;10:00:00,0111;-55db phone_1;10:00:01,0421;-70db phone_1;10:00:01,0431;-80db phone_1;10:00:01,0222;-85db phone_1;10:00:01,0421;-60db phone_1;10:00:00,0111;-55db phone_1;10:00:01,0421;-70db (observation with strongest signal within burst) phone_1;10:00:01,0222;-85db Node_id Mac_ Address Timestamp RSSI value
This step could be improved via the following:
Doing the bursting phase on a mille-second fraction so we can collect more records during the training phase to improve the accuracy.
Choosing the appropriate aggregate function (Maximum, Minimum and Median or a custom one).
4.3.3.Fingerprinting
This step is necessary to collect all the aggregated signal strength values (RSS) from all the nodes in a specific store in a specific timestamp for a specific phone. The data will be in matrix-like form where the columns represents the installed nodes in a specific store. And each row contains RSS values for a specific client device in a specific timestamp (It is worth mentioning that the hashed mac address represents the specific device ID). This row is called a fingerprint. Thus, the whole data set will be an array of fingerprints.
N
1N
2N
1N
2N
3N
47 Table 4-5 - Fingerprinting
Fingerprinting
Input Output Data Attributes
phone_1;10:00:01,0421;-60db
phone_1;10:00:00,0111;-55db
phone_1;10:00:01,0421;-70db
phone_1;10:00:01,0222;-85db
Per (phone_1, timestamp)
-60
FP1 -70
-85
NA
FP2 -55
NA
Mac_ Address
Timestamp
RSSI Vector
4.3.4.Imputing the missing values
The fingerprint in the data set may contains missing values for some nodes. This could happen because of:
Node failure due to technical issues.
Network connection problem where the node was not able to send its data to the server.
Out of range problem where the client location is far away from some nodes that could not capture any signal from the client device.
N
2N
148 Table 4-6 - Missing values imputing
Incomplete fingerprint imputing
Input Output Data Attributes
Per (phone_1,timestamp)
-60
FP1 -70
-85
NA
FP2 -55
NA
Per (phone_1,timestamp)
-60
FP1 -70
-85
NA
FP2 -55
NA
(or filling using imputing strategy)
Mac_ Address
Timestamp
RSSI vector
This step could be improved through the following:
Missing values imputing using a classifier.
Missing value imputing using mean/median values.
Ignoring/removing the fingerprint when number of missing values reach a predefined threshold.
4.3.5.Scaling
49 Table 4-7 - Scaling
Scaling
Input Output Data Attributes
-20
FP1 -10
-10
0.8
FP1 0.4
0.4
Mac_ Address
Timestamp
RSSI vector
This step could be improved through the following:
De-logarithmic scaling of the signal strength: RSS value(in dBM) is logarithmic value of base 10, so de-logarithmic the value could be an effective solution. Apply range scaling instead of z-scoring.
Using machine learning technique to choose the appropriate scaling function or even without scaling.
4.3.6.Getting the vendor names of the client devices
To provide analysis on the data by the client device vendor, the phone vendor code,which is encoded in the client device mac address, was used. The phone vendor OUI or organisationally unique identifier is a 24-bit number or basically the first three octets of a client device MAC address. It identifies a vendor or manufacturer of a client device. An example of a phone vendor:
OUI Vendor {Company}
84:38:38 SAMSUNG ELECTRO-MECHANICS(THAILAND)
To look up the phone vendor names of all the phones MAC addresses in our sample data, an open public API has been used1. It provides the commercial name of the
phone vendor when the MAC address or the phone vendor code (OUI) is entered.
50
4.3.7.Non-portable WI-FI-enabled devices filtering
The collected data from any node in any store may contains a good deal of records (pings) from a fixed non portable WI-FI-enabled devices. These devices include, but not limited to, PCs, tablets, printers, scanners that have a WI-FI network interface card is installed and configured to send probe requests to connect to the available Wi-Fi networks in the coverage area. These devices could be located inside the store owned by the shops dealers or outside the store from the neighbouring buildings. To filter out the pings that came from these devices. The records (pings) that have a constant or near constant signal strength(RSS) value over the predefined monitored time are considered as pings generated from fixed (non portable) client devices. Filtering out this data will reduce the sample data for the analysis and could reduce the performance of the modelling. But, but businesswise, this filtering is very important step and should be done because it helps giving a better estimation of the number of store visitors and visiting routes and duration. And that is obviously the main purpose and the core of the retail analytics and that is why these WI-FI positioning approaches are applied in this field.
The following figure shows a sample of the collected data from a specific store. It shows the variation of signals grouped by device vendors including the devices like tablets, pcs,printers, etc.
Figure 4.22 - Unfiltered grouped by vendor data
4.3.8.Zone re-numbering
51 4.4.FEATURE ENGINEERING
As a part of feature engineering, new features have been introduced as predictors for the model.
N_active_nodes: this represents the number of active nodes in each fingerprint. The active nodes are the nodes that have received signal for a specific probe request and transferred the RSS values into the central server as a raw data to form later the fingerprint data.
N_strong_nodes: this represents the number of strong nodes in each fingerprint. The strong nodes are the nodes that have received strong signal above a certain preconfigured threshold (e.g. -35) for a specific fingerprint.
Phone vendor: as shown before in the exploratory data analysis, the phone vendor affects remarkably the signals strengths and their variations. Adding this feature will help improve the accuracy a great deal.
Zone number: as mentioned before, the zone numbering approach had been proposed to change the previous arbitrary way of numbering. This approach reflects the actual place order of the zones in the store. And that converts the target class from unordered labels to ordered labels where the order between the zones matter.
4.5. MODELING-BASED MAPPING APPROACH IMPLEMENTATION
As previously mentioned, this approach is popular for indoor positioning systems. And the company are using this approach as the only method and the core of its product.
The training set is collected during the setup phase (as explained before) by the operation team. This training set has known labels which are the zone numbers (target class). It contains all the signals (probe requests) that have been sent from the measurement set phones, that have been used by the operation team during the calibration phase, from every place in the store during the whole time period of the calibration phase. It is worth mentioning again that after the pre-processing of the collected data, a matrix form of RSS values from all the installed nodes has been formed (see the table below). Each record of this matrix represents one probe request (called a fingerprint) with all RSS values from all the installed nodes.
Probe request ID RSSI value node 1 RSSI value node 2 RSSI value node 3 RSSI value node 4
--- RSSI value node 150 Zone ID (target class)
1 -70 -50 -45 -30 ---- -88 15
52
Those fingerprints are considered as predictors (independent variables). It is clearly seen that the number of these predictors depends on the number of the nodes that are installed in the location. That is because each one of the variables represents the RSS value that has been received by a specific node in the specified timestamp. These independent variables (features) are named by their nodes IDs (See the figure below).
Figure 4.23 - Feature names, [Minodes]
The company has been using a machine learning model (random forest) to predict the unknown zone numbers for the new visitors. The accuracy of this model is considered as a reasonably good. What It is meant by the accuracy is the goodness of the model to predict the visitor location inside the store and that means finding the right zone that the customer is inside in a specific time.
In this study it had been tried to use different machine learning techniques to estimate the customer location.
Gradient boosting.
Lazy learning methods has been used and specifically k-nearest neighbor algorithm.
Support vector machines. Naïve based multinomial model. Random forest.
The company location was used as an experimental field to check the performance of these different machine learning techniques. Several attempts for tuning the parameters for these machine learning algorithms to reach a good model and to avoid overfitting were done.
4.6.PROXIMITY DETECTION MAPPING APPROACH IMPLEMENTATION
This method is also called Cell-of-Origin. A new cell of origin mapper had been introduced, implemented and tested. As was mentioned before, it is quite important to install one node
3 -53 -42 -67 -39 --- -37 4
53
in each zone. Also it is recommended to setup the node in the center of the zone. These recommendations have been taken in consideration by the operation team for the new installation for clients.
The basic principle in this method is to determine the location of the visitor by the location of the node that recorded the strongest signal from the client device. It is clearly how simple it is, because there is no need for any training set. Thus, no need for any historical data nor remembering the previous states. The cell of origin mapper can act and provide results in a real-time basis.
The figure below shows some implementation of the cell of origin mapper. The function showed in the picture takes as an input a specific phone (phone MAC address) and the store id and the nodes ids within this store. This function calculates, on a real-time basis and again without any historical data and without any learning system behind it, the total visitor journey inside the store and within the specified period of time. It reports the zones numbers that the visitors visit with the timestamp for this visit.
Figure 4.24 - Cell of origin - few implementation
55
5.
RESULTS AND DISCUSSION
Firstly, an important outcome of this study is that it helped in better understanding the behavior of the WI-FI signals which is the backbone of the positioning approaches. It helped in understanding the different variations that affect the WI-FI signals such as reflections, multi paths, etc. Also, that benefits in understanding the underlying process of data generation which leaded to better data preprocessing. It was also clear that this study results significantly in deep analysis of the relationships between different factors that affect the positioning system. And that made a lot of difference especially in introducing new features that were not taken in consideration before.
![Figure 2.2 - Network infrastructure mode, [Gast,2002]](https://thumb-eu.123doks.com/thumbv2/123dok_br/15763743.640046/14.892.222.674.287.492/figure-network-infrastructure-mode-gast.webp)
![Figure 2.6 - WI-FI probe request detail, [Wireshark]](https://thumb-eu.123doks.com/thumbv2/123dok_br/15763743.640046/16.892.108.779.459.872/figure-wi-fi-probe-request-detail-wireshark.webp)
![Figure 2.8 - WI-FI management frames, [Cisco]](https://thumb-eu.123doks.com/thumbv2/123dok_br/15763743.640046/17.892.179.717.132.266/figure-wi-fi-management-frames-cisco.webp)
![Figure 2.9 - Cell Of Origin, [Cisco]](https://thumb-eu.123doks.com/thumbv2/123dok_br/15763743.640046/19.892.202.693.739.1012/figure-cell-of-origin-cisco.webp)
![Figure 2.10 - Angle of arrival, [Henniges, 2012]](https://thumb-eu.123doks.com/thumbv2/123dok_br/15763743.640046/20.892.296.657.735.992/figure-angle-of-arrival-henniges.webp)
![Figure 2.11 - Time of arrival (TOA) , [Cisco]](https://thumb-eu.123doks.com/thumbv2/123dok_br/15763743.640046/21.892.237.707.718.1097/figure-time-arrival-toa-cisco.webp)
![Figure 2.12 - Time difference of arrival, [Cisco]](https://thumb-eu.123doks.com/thumbv2/123dok_br/15763743.640046/22.892.332.604.720.1074/figure-time-difference-of-arrival-cisco.webp)
![Figure 3.5 - WI-FI mesh network, [conniq.com]](https://thumb-eu.123doks.com/thumbv2/123dok_br/15763743.640046/29.892.360.585.132.292/figure-wi-fi-mesh-network-conniq-com.webp)