Article
Electrostatic Dust Cloth: A Passive Screening Method
to Assess Occupational Exposure to Organic Dust
in Bakeries
Carla Viegas1,2,*ID, Ana Monteiro1, Liliana Aranha Caetano1,3ID, Tiago Faria1,4, Elisabete Carolino1and Susana Viegas1,2ID
1 GIAS (Research Group Environment & Health, ESTeSL—Escola Superior de Tecnologia da Saúde de Lisboa,
Instituto Politécnico de Lisboa, 1990-094 Lisbon, Portugal; [email protected] (A.M.); [email protected] (L.A.C.); [email protected] (T.F.); [email protected] (E.C.); [email protected] (S.V.)
2 Centro de Investigação em Saúde Pública, Escola Nacional de Saúde Pública, Universidade NOVA de Lisboa,
1600-560 Lisbon, Portugal
3 Research Institute for Medicines (iMed.ULisboa), Faculty of Pharmacy, University of Lisbon,
1649-003 Lisbon, Portugal
4 Centro de Ciências e Tecnologias Nucleares, Instituto Superior Técnico, Universidade de Lisboa,
E.N. 10 ao km 139,7, 2695-066 Bobadela LRS, Portugal * Correspondence: [email protected]
Received: 26 September 2017; Accepted: 9 February 2018; Published: 12 February 2018
Abstract:Organic dust is widespread in the environment including occupational settings, such as bakeries. Recently, a new collection device—the electrostatic dust cloth (EDC)—has been described for the assessment of occupational exposures. The aim of this study was to investigate the suitability of EDC for identifying the distribution patterns and exposure concentrations of particulate matter and microbial contaminants such as fungi and bacteria in bakeries. Twelve bakeries were selected, and dust was allowed to settle for 13 to 16 days on EDCs (a total of 33 samples). Particle counts and size distribution (0.3µm, 0.5µm, 1µm, 2.5µm, 5µm and 10µm) were measured with direct-reading
equipment. Higher EDC mass was significantly correlated (pvalues < 0.05) with higher fungal load on dichloran glycerol (DG18) and with particle size distribution in the 0.3µm, 0.5µm, 1.0µm and
10.0µm range. Fungal levels on malt extract agar (MEA) ranged from 0 to 2886 CFU/m2EDC in
the warehouse setting, 0 to 500 CFU/m2 EDC in the production setting, and 0 to 3135 CFU/m2 EDC in the store.Penicilliumsp. (42.56%) was the most frequent fungi. Total bacterial load ranged from 0 to 18,859 CFU/m2EDC in the warehouse, 0 to 71,656 CFU/m2EDC in production, and 0 to 21,746 CFU/m2EDC in the store. EDC assessment provided a longer-term integrated sample of organic dust, useful for identifying critical worksites in which particulate matter and bio-burden exposures are elevated. These findings suggest that EDC can be applied as a screening method for particulate matter-exposure assessment and as a complementary method to quantify exposures in occupational environments.
Keywords:electrostatic dust cloth; occupational exposure; organic dust; bioburden; fungi; bacteria
1. Introduction
Organic dust consists of particulate matter of microbial, plant or animal origin. Its specific agents include viruses, bacteria and Gram-negative bacteria endotoxins, actinomycete, spores from moss, fern or fungi, fungi mycotoxins and glucans, algae or plant cell, enzymes and proteins of plant or animal origin, antibiotics and other products from biotechnological processes, insects and mites (and their fragments and excreta) [1–4]. Organic dust is present in several occupational environments
such as agriculture [5], animal production [6–8], the waste industry [9–12], the feed industry [13–15], sawmills [16–18], the food-processing industry [19,20], and also in bakeries [21,22]. Occupational exposure to flour dust occurs in different settings, namely, bakeries, grain mills and flour mills [23]. The highest levels of exposure to organic dust have been described in two different stages (mixing and baking) in both small and large bakeries, and in the reception and opening of flour containers in larger bakeries [24].
Several studies report respiratory health effects in exposed workers, both in small- and large-scale industries, related to the distinct types of dust generated during the production process. Respiratory system symptoms and diseases induced by occupational dust are influenced by the type of dust, dose, duration of exposure and genetic factors [21,25,26].
Flour is a complex organic dust consisting of one or a mixture of several cereal grains (wheat, rye, millet, barley, oats or corn cereal) that have been processed or ground by milling [27]. In addition, flour may contain a diverse number of contaminants, such as silica, fungi and their metabolites (mycotoxins), bacterial endotoxins, insects, mites, mammalian debris and chemical additives such as pesticides and herbicides [21,28]. The American Conference of Governmental Industrial Hygienists (ACGIH) proposed the threshold limit value for flour dust of 0.5 mg/m3as the occupational exposure level (OEL) in breathing zones for workers in flour mills [29]. The quantitative characterization of flour dust and allergens is usually based on air or settled dust sampling [21].
Recently, a new collection method began to be more commonly applied, primarily for indoor air quality (IAQ) assessments, known as the electrostatic dust cloth (EDC). The EDC is an easy-to-use passive collection device that consists of an electrostatic polypropylene cloth [30]. The EDC is gradually being used more frequently because it is inexpensive, easy to use, and effective at collecting dust [31], and it has already been applied for the assessment of occupational exposure to bioaerosols [32]. Since the EDC can be placed on a properly elevated surface, it allows the capture of airborne dust [33]. Additional advantages of this method are the possibility for preparing sample dilutions during laboratory procedures, to overcome the limitation of overloaded plates and to facilitate the selection of selective culture media [34]. Moreover, being a passive-collection method, the use of the EDC enables the collection of contamination from a larger period of time (weeks to several months), whereas air samples can only reflect the load from a shorter period of time (mostly minutes) [34].
Until now, no data on occupational exposure to organic dust in bakeries have been reported in Portugal and this omission has delayed the proposal of preventive measures. In this study, the occupational exposure to particulate matter and microbial contaminants such as fungi and bacteria (termed bioburden in this study) in the indoor environment of Portuguese bakeries was assessed through particle measurement and the EDC collection device. We also investigated the suitability of EDC for identifying critical workplaces in relation to occupational exposure to particulate matter, and for characterizing the bioburden present in this occupational setting.
2. Materials and Methods
2.1. Occupational Environment and Sampling Locations
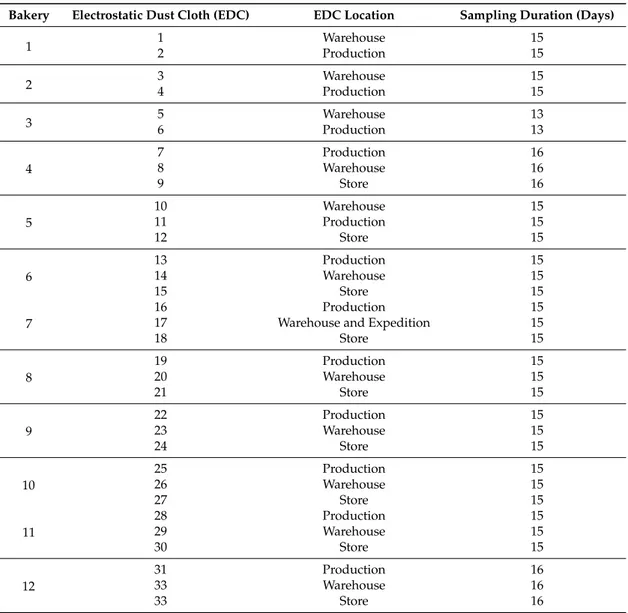
Twelve bakeries were assessed between January and June of 2017. Most bakeries (8 out of 12) were organized in three different working areas: production—where mixing and baking were performed; the taw-material warehouse—where different raw materials were kept and selected by workers for dough preparation; and the store—where the final product was sold (bread or pastry) (Table1).
2.2. Particulate Matter Collection and Measurement
Table 1.Sampling sites identification.
Bakery Electrostatic Dust Cloth (EDC) EDC Location Sampling Duration (Days)
1 12 WarehouseProduction 1515
2 34 WarehouseProduction 1515
3 56 WarehouseProduction 1313
4
7 Production 16
8 Warehouse 16
9 Store 16
5
10 Warehouse 15
11 Production 15
12 Store 15
6
13 Production 15
14 Warehouse 15
15 Store 15
7
16 Production 15
17 Warehouse and Expedition 15
18 Store 15
8
19 Production 15
20 Warehouse 15
21 Store 15
9
22 Production 15
23 Warehouse 15
24 Store 15
10
25 Production 15
26 Warehouse 15
27 Store 15
11
28 Production 15
29 Warehouse 15
30 Store 15
12
31 Production 16
33 Warehouse 16
33 Store 16
Particle measurements were performed with direct-reading equipment (handheld particle counter from Lighthouse Worldwide Solutions, Fremont, CA, USA—Model 3016/5016), which provides data on particle counts (particle number concentration) and particle-size distribution (0.3µm, 0.5µm, 1µm,
2.5µm, 5µm and 10µm) with a concentration limit of 1.4×10⁸/m3(4×106/ft3) and a size range of
0.3 to 25µm. This equipment meets ISO 21501-4 and calibration was done by the manufacturer
using National Institute of Standards and Technology (NIST) traceable polystyrene latex (PSL) spheres, a differential mobility analyzer (DMA), and a condensation particle counter. Particle-number concentration was considered instead of particle-mass concentration because previous publications showed that this exposure metric might be more closely correlated with adverse particulate matter health effects [35,36] (Wichmannet et al., 2000; Weijers et al., 2004).
2.3. Electrostatic Dust Cloth (EDC) Extraction and Bioburden Characterization
Each EDC was weighed after sampling and the mean weight of 10 EDC, handled the same way but without being exposed, was subtracted to determine the mass of the collected dust. The precision of the scale was 0.01 g (Table1). Each EDC cloth was washed with 20 mL 0.9% NaCl with 0.05% Tween80™ (Merck S.A, Lisbon, Portugal) by orbital shaking (250 rpm, 60 min, at room temperature), and 150µL of the wash suspension was inoculated on to 4 different culture media: 2% malt extract agar
(MEA) with 0.05 g/L chloramphenicol media; dichloran glycerol (DG18) agar-based media; tryptic soy agar (TSA) with 0.2% nystatin; violet red bile agar (VRBA). After incubation of the MEA and DG18 plates at 27◦C for 5 to 7 days, fungal densities (colony-forming units, CFU/m2of EDC) were determined and fungal species were identified microscopically using tease mount or Scotch tape mount and lactophenol cotton blue-mount procedures. Morphological identification was achieved through macro and microscopic characteristics [37]. TSA and VRBA plates were incubated at 30◦C and 35◦C for 7 days, respectively. After laboratory processing and incubation of the samples, quantitative colony-forming units were obtained.
2.4. Statistical Analysis
The statistical software SPSS V24.0 for Windows was used for data analysis. The results were considered significant at a 5% significance level. The frequency analysis (n, %) was used to obtain qualitative data, and the minimum, maximum, median and interquartile range were calculated for quantitative data. The median and the interquartile range were used, since outliers were detected and the mean and standard deviation were influenced by these values. The Shapiro–Wilk test was used to test data normality, and Spearman’s correlation coefficient was used to study the relationship between two quantitative variables when data normality was not verified. The Kruskal–Wallis test was used to compare the particle-number concentration of different size range, fungi isolated on MEA and DG18, total bacteria count, Gram-negative bacteria, and EDC weight, among the three different work sites (production, warehouse and store), as data normality was not verified. When statistically significant differences were detected, the Kruskal–Wallis multiple comparisons test was used.
3. Results
3.1. Particulate Matter Assessment
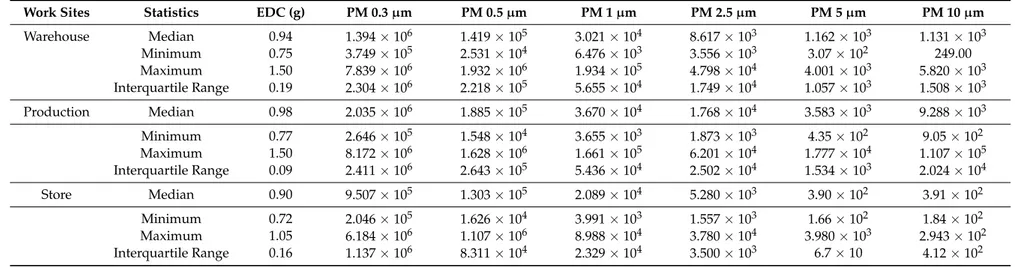
Regarding particle counts, statistically significant differences were detected between at least two of the three work sites assessed for particle sizes analyzed, and from the Kruskal–Wallis multiple comparisons test the differences between the two by two, as described below: (i) 5.0µm
(χ2K
−W(2) =12.286, p= 0.002) differences were detected between the production and store sites (p= 0.002); (ii) 10.0µm (χ2K−W(2) =17.247, p=0.000)and between production and the warehouse (p= 0.007). In both cases, production was the work site with the highest concentrations and the store with the lowest. Regarding EDC weight, no statistically significant differences were detected (χ2K
−W(2) =4.307, p =0.116). However, although not significant, the warehouse and production were the work sites presenting higher values of EDC weight (Table2).
3.2. Bioburden—Fungi Assessment
Table 2.Descriptive measures for EDC weight and particle counts of different dimensions.
Work Sites Statistics EDC (g) PM 0.3µm PM 0.5µm PM 1µm PM 2.5µm PM 5µm PM 10µm
Warehouse Median 0.94 1.394×10⁶ 1.419×10⁵ 3.021×10⁴ 8.617×10³ 1.162×10³ 1.131×10³ Minimum 0.75 3.749×10⁵ 2.531×10⁴ 6.476×10³ 3.556×10³ 3.07×10² 249.00 Maximum 1.50 7.839×10⁶ 1.932×10⁶ 1.934×10⁵ 4.798×10⁴ 4.001×10³ 5.820×10³ Interquartile Range 0.19 2.304×10⁶ 2.218×10⁵ 5.655×10⁴ 1.749×10⁴ 1.057×10³ 1.508×10³
Production Median 0.98 2.035×10⁶ 1.885×10⁵ 3.670×10⁴ 1.768×10⁴ 3.583×10³ 9.288×10³
Minimum 0.77 2.646×10⁵ 1.548×10⁴ 3.655×10³ 1.873×10³ 4.35×10² 9.05×10² Maximum 1.50 8.172×10⁶ 1.628×10⁶ 1.661×10⁵ 6.201×10⁴ 1.777×10⁴ 1.107×10⁵ Interquartile Range 0.09 2.411×10⁶ 2.643×10⁵ 5.436×10⁴ 2.502×10⁴ 1.534×10³ 2.024×10⁴
Store Median 0.90 9.507×10⁵ 1.303×10⁵ 2.089×10⁴ 5.280×10³ 3.90×10² 3.91×10²
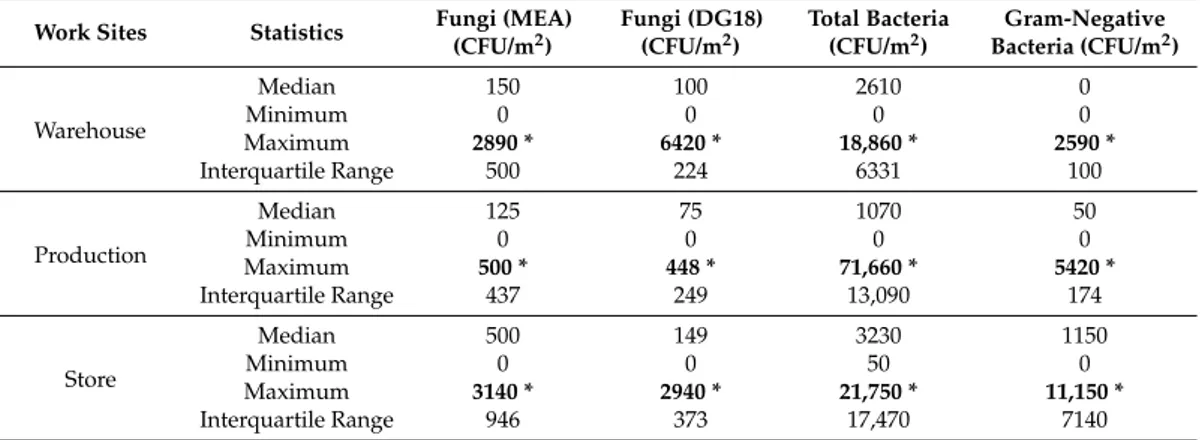
On the DG18 media, eight different fungal species were isolated. Fungal contamination ranged from 0 to 6419 CFU/m2 EDC in the warehouse, 0 to 448 CFU/m2 EDC in production, and 0 to 2936 CFU/m2 EDC in the store. Cladosporium sp. (60.72%) was the most frequent, followed by Penicilliumsp. (34.26%) (Tables3and4).
Table 3.Fungal distribution after EDC inoculation on to malt extract agar (MEA) and dichloran glycerol (DG18) media.
Fungal Species MEA (%;n*) DG18 (%;n*)
Acremoniumsp. 0; 0 0.28; 50 Chrysonilia sitophila 21.2; 3000 0; 0 AspergillussectionCandidi 2.11; 299 1.39; 249
Chrysosporiumsp. 4.92; 697 1.11; 199 AspergillussectionCircumdati 0.35; 50 0; 0
Cladosporiumsp. 23.9; 3384 60.7; 10,850 AspergillussectionAspergilli 0.35; 50 0.28; 50
Fusarium culmorum 0.35; 50 0; 0 AspergillussectionFumigati 0; 0 1.67; 299
Paecilomycessp. 0.35; 50 0; 0 Penicilliumsp. 42.6; 6020 34.3; 6121
Rhizopussp. 3.53; 500 0; 0 Syncephalastrum recemosum 0.35; 50 0; 0 AspergillussectionVersicolores 0; 0 0.28; 50
* Number of species isolates.
Table 4.Bioburden concentrations in the three different work sites assessed by EDC.
Work Sites Statistics Fungi (MEA) (CFU/m2)
Fungi (DG18) (CFU/m2)
Total Bacteria (CFU/m2)
Gram-Negative Bacteria (CFU/m2)
Warehouse
Median 150 100 2610 0
Minimum 0 0 0 0
Maximum 2890 * 6420 * 18,860 * 2590 *
Interquartile Range 500 224 6331 100
Production
Median 125 75 1070 50
Minimum 0 0 0 0
Maximum 500 * 448 * 71,660 * 5420 *
Interquartile Range 437 249 13,090 174
Store
Median 500 149 3230 1150
Minimum 0 0 50 0
Maximum 3140 * 2940 * 21,750 * 11,150 *
Interquartile Range 946 373 17,470 7140 * Maximum values in each work site.
3.3. Bioburden—Bacteria Assessment
Total bacterial load ranged from 0 to 18,860 CFU/m2EDC in the warehouse, 0 to 71,660 CFU/m2 EDC in production, and 0 to 21,750 CFU/m2EDC in the store. The load of Gram-negative bacteria ranged from 0 to 846 CFU/m2EDC in the warehouse, 0 to 5420 CFU/m2EDC in production, and 0 to 11,150 CFU/m2EDC in the store (Table4).
No statistically significant differences were detected in the fungal counts obtained through MEA (χ2K−W(2) (2) = 3.044,p= 0.218), through DG18 (χ2K−W(2) (2) = 0.402,p= 0.818) and total bacteria counts (χ2K
3.4. Correlation Analysis
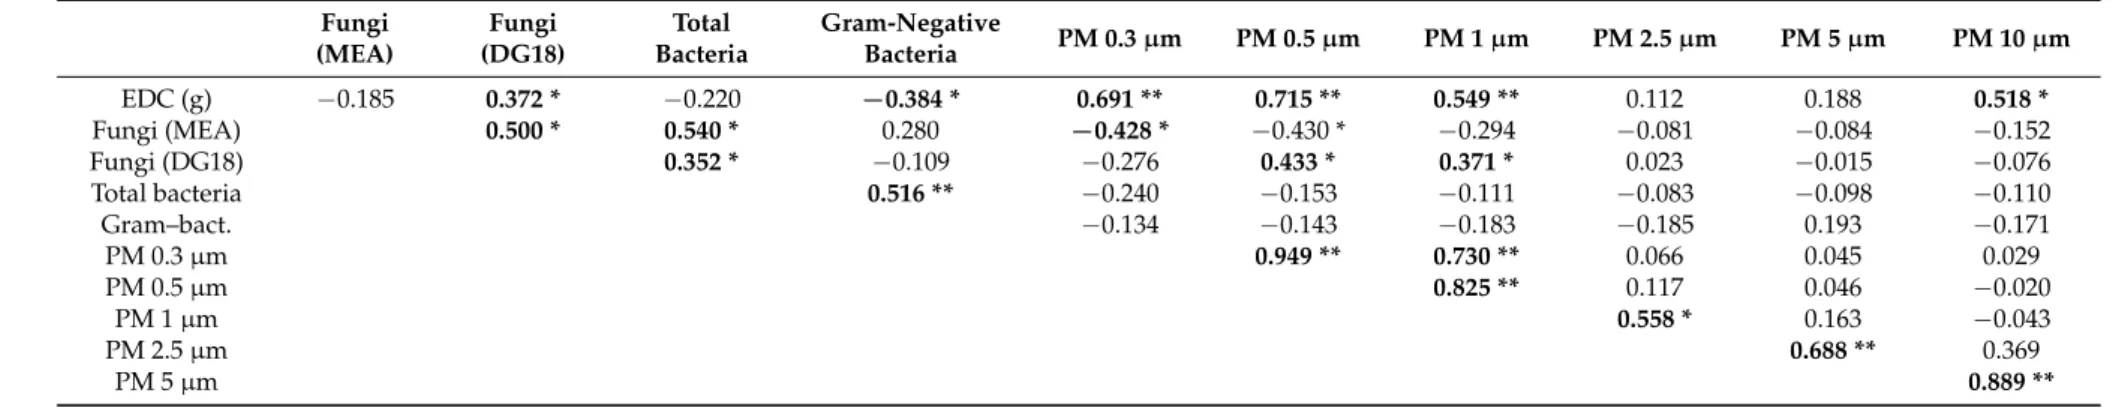
Significant correlations were detected, in a positive sense, with intensities ranging from low to high, between the EDC weight and the fungal load on DG18 (rS= 0.372,p= 0.033), particle mass with 0.3µm (rS= 0.691,p= 0.000), with 0.5µm (rS= 0.715,p= 0.000) with 1.0µm (rS= 0.549,p= 0.001) and
with 10.0µm (rS= 0.518,p= 0.000). These results indicate that higher EDC mass values are related
to higher fungal load on DG18 and particle mass from the dimensions 0.3µm, 0.5µm 1.0µm and
10.0µm. Significant correlations were found, in a negative sense, with low intensity, between the EDC
weight and Gram-negative bacteria (rS=−0.384,p= 0.027), which indicates that higher EDC mass values are related to lower concentrations of Gram-negative bacteria. No significant correlation was detected between EDC weight and the fungal counts on MEA (rS=−0.185,p= 0.303) and particles’ mass concentration with 2.5µm (rS= 0.112,p= 0.534), and with 5.0µm (rS= 0.188,p= 0.295) (Table5).
Fungal contamination determined on MEA was significantly correlated, in a positive sense and with moderate intensity, with the fungal counts obtained on DG18 (rS= 0.500,p= 0.003), and with total bacteria counts (rS= 0.540,p= 0.001), which indicates that higher fungal counts on MEA are related to higher fungal counts on DG18 and higher total bacteria counts. A significant negative correlation with low intensity was detected between fungal counts on MEA and particle concentration with 0.3µm (rS=−0.428,p= 0.013). These results indicate that lower fungal counts are related to
higher concentrations of particle counts with 0.3µm particle diameters (Table5).
Fungal contamination determined on DG18 was significantly correlated, in a positive sense and with low intensity, with total bacteria counts (rS= 0.352,p= 0.045), which indicates that higher counts on DG18 are related to higher total bacteria counts. A significant correlation was detected between fungal counts on DG18 and particle counts with 0.5µm (rS= 0.433,p= 0.012) and with 1.0µm
(rS= 0.371,p= 0.035), meaning that higher fungal load on DG18 is related to higher particle counts with 0.5µm and 1.0µm (Table5).
Finally, a positive correlation was detected, of moderate intensity, between total bacteria counts and Gram-negative bacteria counts (rS= 0.516,p= 0.000), which indicates that higher total bacteria concentrations are related to higher Gram-negative concentration. No significant correlation was detected between Gram-negative bacteria counts and the concentration of the particle counts of any size (Table5).
Table 5.Results of Spearman correlation between bioburden, EDC weight and particles mass (PM 0.3µm to PM 10.0µm).
Fungi (MEA)
Fungi (DG18)
Total Bacteria
Gram-Negative
Bacteria PM 0.3µm PM 0.5µm PM 1µm PM 2.5µm PM 5µm PM 10µm
EDC (g) −0.185 0.372 * −0.220 −0.384 * 0.691 ** 0.715 ** 0.549 ** 0.112 0.188 0.518 *
Fungi (MEA) 0.500 * 0.540 * 0.280 −0.428 * −0.430 * −0.294 −0.081 −0.084 −0.152
Fungi (DG18) 0.352 * −0.109 −0.276 0.433 * 0.371 * 0.023 −0.015 −0.076
Total bacteria 0.516 ** −0.240 −0.153 −0.111 −0.083 −0.098 −0.110
Gram–bact. −0.134 −0.143 −0.183 −0.185 0.193 −0.171
PM 0.3µm 0.949 ** 0.730 ** 0.066 0.045 0.029
PM 0.5µm 0.825 ** 0.117 0.046 −0.020
PM 1µm 0.558 * 0.163 −0.043
PM 2.5µm 0.688 ** 0.369
PM 5µm 0.889 **
4. Discussion
The selection of sampling device, sampling location and period are important first steps to define the strategy for exposure assessment to bioaerosols [34,38]. Used as a surrogate for airborne exposure in studies that explore indoor microbiota [39], settled airborne dust is not often applied in occupational exposure assessments to organic dust, although some attempts have been made through surface dust (wipe) samples and the assessment of floor dust in bakeries [40,41]. A justification for this application gap is that the relationship between actual inhalation exposure and microbial burden from aerosols is more straightforward than for settled dust, since bioaerosols are highly dynamic in nature and consequently difficult to collect in a representative way [42]. Of note, some biases in the settling of smaller particles lead to their under-representation relative to larger-bodied taxa [43,44]. Furthermore, it may be challenging in some workplaces, such as animal production or even in bakeries, to place EDCs in locations where the sampling devices are not disturbed or damaged during working activities, and on sufficiently elevated surfaces to ensure the capture of airborne dust rather than floor-based particles that may never contribute to human exposure through inhalation [39]. However, settled dust is thought to be a long-term integrated sample of particles that have been airborne [45], thus proving a composite view of bioaerosols in the occupational environment [39]. The suitability of EDC for assessing moderately contaminated occupational environments has been reported and its use has been suggested coupled with other available sampling methods, thus allowing a reliable estimation of exposure, since a single EDC measurement is comparable to the sum of several air-impaction measurements [46]. Furthermore, we should expect the exclusive presence of some fungal species in surface samples and higher fungal diversity in EDC, when compared to air samples, since the same trend was observed with surfaces samples in previous reports [47].
The extraction of biological material from the sampling matrix is a dominant factor affecting the extraction efficiency of dust and associated bioburden recovery [39]. Extraction procedures were adopted from the study of Madsen and colleagues [38] that were designed to quantify the influence of the extraction method on the measured concentrations of bioburden sampled with EDC [38].
Grain dust may contain dry plant particles (non-grain plant matter) such as the fungi isolated from the EDC analyzed [21]. Besides the most prevalent fungi isolated in both media applied (Cladosporium sp. and Penicillium sp.) we must also highlight the identification of other species belonging to the genusAspergilluswith recognized toxigenic potential [48]. In addition, bacteria with their fragments (including endotoxins) can be an important component from grain dust [21]. This was observed in EDC samples, with higher counts of total bacteria and Gram negative bacteria on store working sites. The higher counts on this working site (Table4) corroborate their mainly human origin, since these areas are more frequented by customers, than the warehouse and production [49,50]. Although a negative correlation between fungi and bacteria has been previously reported [51], the fact that they share contamination sources, since workers and customers, and also the raw materials, can transport the bioburden into bakery facilities [52,53] justifies the positive correlation between fungal counts on MEA and bacteria that we found in this study. The bioburden diversity in occupational environments such as bakeries depends on several variables, including the microbiological contamination of the raw materials, which can be high and can occur at any time, considering cereal grains, from the crop period, through harvest and processing, up to storage and transport [54].
EDC weight and particle counts (dimensions 0.3µm, 0.5µm, 1.0µm and 10.0µm) seem to be
dedicated measurement resources and detailed task observation can this be accomplished [56,57]. Thus, we should consider the EDC-sampling approach as complementary to other established methods for the assessment of exposure to organic dust.
The fact that EDC weight and particle number concentration (0.5µm and 1.0µm) correlate with
fungal counts on DG18 reinforces the use of this media, as it restricts the colony size of fast-growing genera [58], allowing a more complete and accurate characterization of fungal contamination in this occupational environment and in highly contaminated settings in general. The lack of correlation between particles measurement (2.5µm and 5.0µm) and fungal counts on MEA was reported in
several other studies where the methodological approaches employed were active methods for air sampling [57,59]. On the contrary, and specifically for total bacteria counts, a different study developed on sawmills reported a positive correlation with dust concentration. However, bioaerosol results were obtained through active methods [16]. This discrepancy regarding the correlation between particulate matter and bioburden in different occupational environments, with active and passive methods employed for the assessment of air bioaerosols, can be justified by the effect of other environmental variables, such as workers and customers who may carry a great diversity of microorganisms [60], as well as the developed activities and work practices that may also affect fungal and bacterial load [13,51,52,55,61]. Moreover, we cannot neglect the fact that viable bioaerosol particles constitute a small percentage of the total concentration of the bioburden [62] and, therefore, a bias about the microorganism load recovered from the EDC, as in other sampling methods, should be considered as a justification for the lack of correlation or negative correlation among EDC weight and fungal counts on MEA and Gram-negative bacteria, respectively. The same explanation can also be given for the significant negative correlation between particle counts (0.3µm) and the fungal counts on MEA and
between all particle sizes, except particles PM 5µm, and Gram-negative bacteria assessed through
the EDC, although in this case the correlation was not significant.
A recent study focusing on theAspergillussp. burden in occupational settings describes a protocol for the assessment of occupational exposure in high-load settings [63]. The same protocol emphasizes the importance of applying passive methods, besides active methods, to complement the exposure assessment, and it can be adopted for the evaluation of occupational exposure to bioburden. Our results suggest that, in addition to air sampling and surface swabs to sample the bioburden, EDC should also be used as a complementary sampling method in order to achieve an accurate exposure assessment.
5. Conclusions
EDC proved to be a sampling device suitable for the assessment of occupational exposure to organic dust in Portuguese bakeries. Besides the correlation found between fungal load on DG18 and particle measurement (dimensions 0.3µm, 0.5µm, 1.0µm and 10.0µm) with EDC weight, it was
possible to obtain valuable information regarding particle contamination and bioburden. The EDC passive-sampling method was useful for identifying the critical worksites regarding particulate matter exposure and for unveiling the bioburden present in the surveyed occupational environment. Thus, EDC can be applied as a screening method for particle-exposure assessment and as a complementary method for assessing bioburden, since it provides a long-term integrated sample of organic dust.
Acknowledgments:The authors are grateful to the Portuguese Authority for Working Conditions for funding the Project “Occupational exposure assessment to particulate matter and fungi and health effects of workers from Portuguese Bakeries” (005DBB/12) and also to the Occupational Health Services of the bakeries engaged in this study.
Author Contributions: Carla Viegas and Susana Viegas conceived and coordinated the study, plus the discussion and conclusions; Carla Viegas led the production of the paper; Carla Viegas, Ana Monteiro, Liliana Aranha Caetano, Tiago Faria and Susana Viegas contributed to field and lab work and data analyses; Elisabete Carolino ensured the statistical analyses from all data. All authors contributed more or less to the final review.
References
1. Lacey, J.; Dutkiewicz, J. Bioaerosols and occupational lung disease. J. Aerosol Sci. 1994,25, 1371–1404. [CrossRef]
2. Douwes, J.; Thorne, P.; Pearce, N.; Heederik, D. Bioaerosol health effects and exposure assessment: Progress and prospects.Ann. Occup. Hyg.2003,47, 187–200. [PubMed]
3. Eduard, W.; Heederikc, D.; Duchained, D.; Green, B.J. Bioaerosol exposure assessment in the workplace: The past, present and recent advances.J. Environ. Monit.2012,14, 334–339. [CrossRef] [PubMed]
4. Sturm, R. Bioaerosols in the lungs of subjects with different ages-part 1: Deposition modeling.Ann. Transl. Med.
2016,4, 211. [CrossRef] [PubMed]
5. American Thoracic Society. Respiratory health hazards in agriculture.Am. J. Respir. Crit. Care Med.1998, 158, 1–57.
6. Seedorf, J.; Hartung, J.; Schröder, M.; Linkert, K.H.; Phillips, V.R.; Holden, M.R.; Sneath, R.W.; Short, J.L.; White, R.P.; Pedersen, P.; et al. Concentrations and emissions of airborne endotoxins and microorganisms in livestock buildings in northern Europe.J. Agric. Eng. Res.1998,70, 97–109. [CrossRef]
7. Viegas, S.; Mateus, V.; Almeida-Silva, M.; Carolino, E.; Viegas, C. Occupational Exposure to Particulate Matter and Respiratory Symptoms in Portuguese Swine Barn Workers.J. Toxicol. Environ. Health A2013,76, 1007–1014. [CrossRef] [PubMed]
8. Viegas, S.; Faísca, V.M.; Dias, H.B.; Clérigo, A.; Carolino, E.; Viegas, C. Occupational exposure to poultry dust and effects on the respiratory system in workers.J. Toxicol. Environ. Health A2013,76, 230–239. Available online:http://hdl.handle.net/10400.21/2462(accessed on 11 February 2018). [CrossRef] [PubMed] 9. Viegas, C.; Faria, T.; Aranha Caetano, L.; Carolino, E.; Quintal Gomes, A.; Viegas, S. Aspergillusspp.
prevalence in different occupational settings.J. Occup. Environ. Hyg.2017. [CrossRef] [PubMed]
10. Gladding, T.L.; Thorn, J.; Stott, D. Organic dust exposure and work-related effects among recycling workers. Am. J. Ind. Med.2003,43, 584–591. [CrossRef] [PubMed]
11. Van Tongeren, M.; Van Amelsvoort, L.; Heederik, D. Exposure to organic dusts, endotoxins, and microorganisms in the municipal waste industry.Int. J. Occup. Environ. Health1997,3, 30–36. [CrossRef] [PubMed]
12. Krajewski, J.A.; Tarkowski, S.; Cyprowski, M.; Szarapi ´nska-Kwaszewska, J.; Dudkiewicz, B. Occupational exposure to organic dust associated with municipal waste collection and management.Int. J. Occup. Med. Environ. Health2002,15, 289–301. [PubMed]
13. Viegas, S.; Almeida-Silva, M.; Viegas, C. Occupational exposure to particulate matter in 2 Portuguese waste-sorting units.Int. J. Occup. Med. Environ. Health2014,27, 854–862. [CrossRef] [PubMed]
14. Awad, A.H.A. Airborne dust, bacteria, actinomycetes and fungi at a flourmill.Aerobiologia2007,23, 59–69. [CrossRef]
15. Viegas, S.; Faria, T.; dos Santos, M.; Carolino, E. Task-based approach importance for the occupational risk assessment-the case of particles exposure in feed industry. In Proceedings of the International Symposium on Occupational Safety and Hygiene SHO2016, Guimarães, Portugal, 23–24 March 2016.
16. Viegas, C.; Faria, T.; Carolino, E.; Sabino, R.; Quintal Gomes, A.; Viegas, S. Occupational Exposure to Fungi and Particles in Animal Feed Industry.Medycyna Pracy2016,67, 143–154. [CrossRef] [PubMed]
17. Oppliger, A.; Rusca, S.; Charrière, N.; Vu duc, T.; Droz, P.-O. Assessment of Bioaerosols and Inhalable Dust Exposure in Swiss Sawmills.Ann. Occup. Hyg.2005,49, 385–391. [CrossRef] [PubMed]
18. Dutkiewicz, J.; Krysi ´nska-Traczyk, E.; Prazmo, Z.; Sko´rska, C.; Sitkowska, J. Exposure to airborne microorganisms in Polish sawmills.Ann. Agric. Environ. Med.2001,8, 71–80. [PubMed]
19. Laakkonen, A.; Kyyrönen, P.; Kauppinen, T.; Pukkala, E.I. Occupational exposure to eight organic dusts and respiratory cancer among Finns.Occup. Environ. Med.2006,63, 726–733. [CrossRef] [PubMed]
21. Milanowski, J.; Góra, A.; Skórska, C.; Mackiewicz, B.; Krysi ´nska-Traczyk, E.; Cholewa, G.; Sitkowska, J.; Dutkiewicz, J. The effects of exposure to organic dust on the respiratory system of potato processing workers. Ann. Agric. Environ. Med.2002,9, 243–247. [PubMed]
22. Stobnicka, A.; Górny, R.L. Exposure to flour dust in the occupational environment.Int. J. Occup. Saf. Ergon. 2015,21, 241–249. [CrossRef] [PubMed]
23. Mohammadien, H.A.; Hussein, M.T.; El-Sokkary, R.T. Effects of exposure to flour dust on respiratory symptoms and pulmonary function of mill workers.Egypt J. Chest Dis. Tuberc.2013,62, 745–753. [CrossRef] 24. Meo, S.A. Dose responses of years of exposure on lung function in flour mill workers.J. Occup. Health2004,
46, 187–191. [CrossRef] [PubMed]
25. Patouchas, D.; Sampsonas, F.; Papantrinopoulou, D.; Tsoukalas, G.; Karkoulias, K.; Spiropoulos, K. Determinants of specific sensitization in flour allergens in workers in bakeries with use of skin prick tests.Eur. Rev. Med. Pharmacol. Sci.2009,13, 407–411. [PubMed]
26. Subbarao, P.; Mandhane, P.J.; Sears, M.R. Asthma: Epidemiology, etiology and risk factors.CMAJ2009,181, 181–190. [CrossRef] [PubMed]
27. Meo, S.A.; AL-Dress, A.M. Lung function among nonsmoking Wheat flour mill workers.Int. J. Occup. Med. Environ. Health2005,18, 246–251.
28. Karpinski, E.A. Exposure to inhalable flour dust in Canadian flour mills.Appl. Occup. Environ. Hyg.2003,18, 1022–1030. [CrossRef] [PubMed]
29. Cotton, D.J.; Dosman, J.A. Grain dust and health. III. Environmental factors. Anal. Int. Med. 1978,89, 420–421. [CrossRef]
30. American Conference of Governmental Industrial Hygienists.Threshold Limit Values for Chemical Substances and Physical Agents and Biliological Exposure Indices; ACGIH: Cincinnati, OH, USA, 2009.
31. Kilburg-Basnyat, B.; Metwali, N.; Thorne, P.S. Performance of electrostatic dust collectors (EDCs) for endotoxin assessment in homes: Effect of mailing, placement, heating and electrostatic charge.J. Occup. Environ. Hyg.2016,13, 85–93. [CrossRef] [PubMed]
32. Cozen, W.; Avol, E.; Diaz-Sanchez, D.; McConnell, R.; Gauderman, W.J.; Cockburn, M.G.; Mack, T.M. Use of an electrostatic dust cloth for self-administered home allergen collection.Twin Res. Hum. Genet.2008,11, 150–155. [CrossRef] [PubMed]
33. Normand, A.C.; Vacheyrou, M.; Sudre, B.; Heederik, D.J.J.; Piarroux, R. Assessment of dust sampling methods for the study of cultivable-microorganism exposure in stables.Appl. Environ. Microbiol.2009,75, 7617–7623. [CrossRef] [PubMed]
34. Badyda, A.; Gayer, A.; Czechowski, P.; Majewski, G.; D ˛abrowiecki, P. Pulmonary function and incidence of selected respiratory diseases depending on the exposure to ambient PM10.Int. J. Mol. Sci.2016,17, 1954. [CrossRef] [PubMed]
35. Viegas, C.; Pinheiro, C.; Sabino, R.; Viegas, S.; Brandão, J.; Veríssimo, C. (Eds.)Environmental Mycology in Public
Health: Fungi and Mycotoxins Risk Assessment and Management; Academic Press: Waltham, MA, USA, 2015. 36. Weijers, E.P.; Khlystov, A.Y.; Kos, G.P.A.; Erisman, J.W. Variability of particulate matter concentrations along
roads and motorways determined by a moving measurement unit. Atmos. Environ.2004,38, 2993–3002. [CrossRef]
37. Wichmann, H.E.; Spix, C.; Tuch, T.; Wolke, G.; Peters, A.; Heinrich, J.; Kreyling, W.G.; Heyder, J. Daily mortality and fine and ultrafine particles in Erfurt, Germany. Part 1: Role of particle number and particle mass. Res. Rep. Health Eff. Inst.2000,98, 5–86.
38. De Hoog, G.S.; Guarro, J.; Gebé, J.; Figueras, M.J.Atlas of Clinical Fungi, 2nd ed.; Centraalbureau voor Schimmelcultures: Utrecht, The Netherlands, 2000.
39. Madsen, A.M.; Matthiesen, C.B.; Frederiksen, M.W.; Frederiksen, M.; Frankel, M.; Spilak, M.; Timm, M. Sampling, extraction and measurement of bacteria, endotoxin, fungi and inflammatory potential of settling indoor dust.J. Environ. Monit.2012,14, 3230–3239. [CrossRef] [PubMed]
40. Adams, R.I.; Tian, Y.; Taylor, J.W.; Bruns, T.D.; Hyvarinen, A.; Taubel, M. Passive dust collectors for assessing airborne microbial material.Microbiome2015,3, 46. [CrossRef] [PubMed]
42. Vissers, M.; Doekes, G.; Heederik, D. Exposure to wheat allergen and fungalα-amylase in the homes of
bakers.Clin. Exp. Allergy2001,31, 1577–1582. [CrossRef] [PubMed]
43. Hyvrinen, A.; Vahteristo, M.; Meklin, T.; Jantunen, M.; Nevalainen, A.; Moschandreas, D. Temporal and spatial variation of fungal concentrations in indoor air.Aerosol Sci. Technol.2001,35, 688–695. [CrossRef] 44. Scott, J.A.; Summerbell, R.C.; Green, B.J. Detection of indoor bioaerosols. InFundamentals of Mold Growth in
Indoor Environments and Strategies for Healthy Living; Adan, O.C.G., Samson, R., Eds.; Wageningen Academic Publishers: Wageningen, The Netherlands, 2011; pp. 353–379. [CrossRef]
45. Noss, I.; Wouters, I.M.; Visser, M.; Heederik, D.J.J.; Thorne, P.S.; Brunekreef, B.; Doekes, G. Evaluation of a Low-Cost Electrostatic Dust Fall Collector for Indoor Air Endotoxin Exposure Assessment. Appl. Environ. Microbiol.2008, 5621–5627. [CrossRef] [PubMed]
46. Institute of Medicine.Damp Indoor Spaces and Health; The National Academies Press: Washington, DC, USA, 2004. 47. Normand, A.C.; Ranque, S.; Cassagne, C.; Gaudart, J.; Sallah, K.; Charpin, D.A.; Piarroux, R. Comparison of Air Impaction and Electrostatic Dust Collector Sampling Methods to Assess Airborne Fungal Contamination in Public Buildings.Ann. Occup. Hyg.2015,60, 161–167. [CrossRef] [PubMed]
48. Viegas, C.; Faria, T.; Meneses, M.; Carolino, E.; Viegas, S.; Gomes, A.; Sabino, R. Analysis of surfaces for characterization of fungal burden—Does it matter?Int. J. Occup. Med. Environ. Health2016,29, 623–632. [CrossRef] [PubMed]
49. Varga, J.; Baranyi, N.; Chandrasekaran, M.; Vágvölgyi, C.; Kocsubé, S. Mycotoxin producers in theAspergillus genus: An update.Acta Biol. Szeged.2015,59, 151–167.
50. Cabo Verde, S.; Almeida, S.M.; Matos, J.; Guerreiro, D.; Meneses, M.; Faria, T.; Botelho, D.; Santos, M.; Viegas, C. Microbiological assessment of indoor air quality at different hospital sites.Res. Microbiol.2015, 166, 557–563. [CrossRef] [PubMed]
51. Zhu, H.; Phelan, P.E.; Duan, T.; Raupp, G.B.; Fernando, H.J.S.; Che, F. Experimental study of indoor and outdoor airborne bacterial concentrations in Tempe, Arizona, USA.Aerobiologia2003,19, 201–211. [CrossRef] 52. Mille-Lindblom, C.; Fischer, H.J.; Tranvik, L. Antagonism between bacteria and fungi, substrate competition and a possible tradeoff between fungal growth and tolerance towards bacteria.Oikos2006,113, 233–242. [CrossRef]
53. Chmielowiec-Korzeniowska, A.; Tymczyna, L.; Drabik, A.; Krzosek, L. Microbial contamination level of air in animal waste utilization plants.Ann. Agric. Environ. Med.2016,23, 54–58. [CrossRef] [PubMed] 54. Brown, J.S.; Gordon, T.; Priceand, O.; Asgharian, B. Thoracic and respirable particle definitions for human
health risk assessment.Part. Fibre Toxicol.2013, 10–12. [CrossRef] [PubMed]
55. Stuper, K.; Kawka, A.; Bu´sko, M.; Suchowilska, E.; Szwajkowska-Michałek, L.; Matysiak, A.; Wiwart, M.; Perkowski, J.The Effect of Mycoflora and Trichothecene Contents in Bread Wheat on Quality of Its Milling Products; Wroclaw University of Life Science Academic Publisher: Wroclaw, Poland, 2009; pp. 96–102.
56. Roberge, B.; Aubin, S.; Cloutier, Y.Characterization of Dusts in Traditional Bakeries. Studies and Research Projects; Report R-760; IRSST: Montreál, QC, Canada, 2012; ISBN 978-2-89631-645-8.
57. Viegas, S.; Almeida-Silva, M.; Faria, T.; Dos Santos, M.; Viegas, C. Occupational exposure assessment to particles with task-based approach. InOccupational Safety and Hygiene IV; Taylor and Francis Group: London, UK, 2016; pp. 1–6. ISBN 978-1-138-02942-2.
58. Viegas, S.; Faria, T.; Viegas, C. Bakers exposure to flour dust—A exploratory study in a Portuguese Bakery. In Proceedings of the International Symposium on Occupational Safety and Hygiene SHO2017, Guimarães, Portuga, 10–11 April 2017; Portuguese Society of Occupational Safety and Hygiene: Guimarães, Portugal, 2017; pp. 116–117.
59. Bergwall, C.; Stehn, B. Comparison of selective mycological agar media for the isolation and enumeration of xerophilic moulds and osmotolerant yeasts in granulated white sugar.Zuckerindustrie2002,127, 259–264. 60. Alghamdi, M.A.; Shamy, M.; Redal, M.A.; Khoder, M.; Awad, A.H.; Elserougy, S. Microorganisms associated
particulate matter: A preliminary study.Sci. Total Environ.2014,479–480, 109–116. [CrossRef] [PubMed] 61. Scheff, P.; Pulius, V.; Curtis, L.; Conroy, L. Indoor air quality in a middle school, Part II: Development
62. Jürgensen, C.W.; Madsen, A.M. Influence of everyday activities and presence of people in common indoor environments on exposure to airborne fungi.AIMS Environ. Sci.2016,3, 77–95. [CrossRef]
63. Huang, P.Y.; Shi, Z.Y.; Chen, C.H.; Den, W.; Huang, W.M.; Tsai, J.J. Airborne and surface-bound microbial contamination in two intensive care units of a medical center in central Taiwan.Aerosol Air Qual. Res.2013, 13, 1060–1069. [CrossRef]