Genetic variability of
Aedes aegypti
in the Americas using a
mitochondrial gene: evidence of multiple introductions
José Eduardo Bracco/***/
+, Margareth Lara Capurro*, Ricardo Lourenço-de-Oliveira**,
Maria Anice Mureb Sallum***
Laboratório de Bioquímica e Biologia Molecular de Vetores, Superintendência de Controle de Endemias, São Paulo, SP, Brasil *Departamento de Parasitologia, ICB, Universidade de São Paulo, São Paulo, SP Brasil **Departamento de Entomologia, Instituto
Oswaldo Cruz-Fiocruz, Rio de Janeiro, RJ, Brasil ***Departamento de Epidemiologia, Faculdade de Saúde Pública, Universidade de São Paulo, Av. Dr. Arnaldo 715, 01246-904 São Paulo, SP, Brasil
To analyze the genetic relatedness and phylogeographic structure of Aedes aegypti, we collected samples from 36 localities throughout the Americas (Brazil, Peru, Venezuela, Guatemala, US), three from Africa (Guinea, Senegal, Uganda), and three from Asia (Singapore, Cambodia, Tahiti). Amplification and sequencing of a frag-ment of the mitochondrial NADH dehydrogenase subunit 4 gene identified 20 distinct haplotypes, of which 14 are exclusive to the Americas, four to African/Asian countries, one is common to the Americas and Africa, and one to the Americas and Asia. Nested clade analysis (NCA), pairwise distribution, statistical parsimony, and maximum parsimony analyses were used to infer evolutionary and historic processes, and to estimate phyloge-netic relationships among haplotypes. Two clusters were found in all the analyses. Haplotypes clustered in the two clades were separated by eight mutational steps. Phylogeographic structure detected by the NCA was consis-tent with distant colonization within one clade and fragmentation followed by range expansion via long distance dispersal in the other. Three percent of nucleotide divergence between these two clades is suggestive of a gene pool division that may support the hypothesis of occurrence of two subspecies of Ae. aegypti in the Americas.
Key words: phylogeography - Aedes aegypti - NADH dehydrogenase subunit 4 - nucleotide divergence
The pandemic of dengue fever (DF) and dengue hem-orrhagic fever (DHF) is one of the most important pub-lic health problems in the modern world, especially in tropical countries (WHO 2004). Because there is no vaccine against dengue viruses (DENV), most efforts to manage the disease are based on vector control. Conse-quently, information about genetic variability, popula-tion structure, and migrapopula-tion dynamics of the major ur-ban vector of DENVs, Aedes aegypti, could prove valu-able for the design of effective control strategies.
Ae. aegypti is an autochthonous African species which arrived in the Americas aboard slave ships and became established and spread throughout the New World in the XVII and XVIII centuries (OPAS 1995). By the 1950s, all countries in the Americas except Canada registered the presence of Ae. aegypti. Abundance and distributional range of the vector were reduced from the 1940s through the 1970s as a result of the Ae. aegypti eradication pro-gram adopted by the Pan American Health Organization (PAHO) (Franco 1961). However, the PAHO vector con-trol program was discontinued in the 1960s and, conse-quently, Ae. aegypti re-infested all countries from which
it was supposed to have been eliminated (Schatzmayr 2000), once again becoming a health concern. The ge-netic variability of Ae. aegypti in the Americas has prob-ably been greatly reduced because of a bottleneck ef-fect during its introduction and selective pressure re-sulting from a strong vector control policy that focused mainly on Ae. aegypti control similarly to what occurred to Anopheles mosquitoes in Central and South America (Donnelly et al. 2002).
The presence of Ae. aegypti in Asia was first reported in the XIX century (Smith 1956); however, it is possible that it had been introduced earlier, either in the XVII or XVIII century, due to the trade between African and Asian countries. Currently the species is spread throughout the world, in tropical and subtropical areas from 45° N to 35° S (Slosek 1986).
The main objectives of the present study were: (1) to examine the distribution of the mitochondrial lineages of populations of Ae. aegypti collected in American, African, and Asian countries and (2) to estimate the phy-logenetic relationships among the Ae. aegypti haplo-types. Three hundred thirty-six nucleotide base-pairs of the mitochondrial NADH dehydrogenase subunit 4 (ND4) region were used.
MATERIALS AND METHODS
Details about collection locations, dates, and sample size of Ae. aegypti populations used in this study are in the Table and available upon request from the correspond-ing author. Mosquito eggs were collected in ovitraps placed in several urban locations in Brazil, Venezuela, and the US. Eggs were raised to adult stages and a
ran-Financial support: Sucen, Fapesp (00/12138-7; 06/01816-0), CNPq (501529/2003-9)
+Corresponding author: [email protected]
dom sample of the adults was identified to species and preserved in 100% ethyl alcohol maintained at –70º C. Adult mosquitoes from Cambodia, Guatemala, Guinea, Peru, Senegal, Singapore, Uganda, and Tahiti were ob-tained from collaborating researchers. Genomic DNA of individual adults was obtained by phenol-chloroform extraction (Sambrook et al. 1989) and eluted in 100 µl of TE buffer (10 mM Tris-HCl, 1 mM EDTA, pH 8.0).
Primers used to amplify and sequence a 336 bp por-tion of the mitochondrial ND4 gene were: ND4F: 5-ATT GCC TAA GGC TCA TGT AG-3 and ND4R: 5-TCG GCT
TCC TAG TCG TTC AT-3. Polymerase chain reactions (PCR) were carried out in a total volume of 50 µl using standard protocols, with 2 mM Mg++, 20 mM Tris-HCl (pH 8.4), 50 mM KCl, 0.5 mM of each primer, 0.2 mM dNTP mix, 2 U Taq DNA polymerase (Invitrogen), and 1 µl of template DNA. Each experiment a negative con-trol was performed. PCR temperature profiles to obtain the above sequence were: initial denaturation at 94ºC for 2 min followed by 35 cycles at 94ºC for 1 min, 56ºC for 30 s, and 72ºC for 1 min, and final extension at 72°C for 7 min. For sequencing, PCR products were purified
TABLE
Country, sample locality, coordinates, size, and haplotypes for Aedes aegypti
Country Sample locality Coordinates N Haplotype (n)
Brazil (N = 116) Ananindeua (PA)a 01o 22’ S 48o 23’ W 2 17 (2)
Araçatuba (SP) 21o 12’ S 50o 25’ W 3 1 (1); 17 (1); 21 (1)
Bauru (SP) 22o 19’ S 49o 04’ W 3 1 (1); 17 (2)
Belém (PA)a 01o 27’ S 48o 29’ W 5 1 (2); 5 (1); 16 (2)
Belo Horizonte (MG) 19o 55’ S 43o 56’ W 3 1 (3)
Boa Vista (RR)a 02o 49’ N 60o 40’ W 5 7 (1); 15 (4)
Campinas (SP) 22o 54’ S 47o 05’ W 5 1 (2); 17 (3)
Campo Grande (MS)a 20o 27’ S 54o 37’ W 5 1 (3); 17 (2)
Cariacica (ES)a 20o 16’ S 40o 25’ W 5 1 (3); 15 (2)
Feira de Santana (BA)a 12o 15’ S 38o 57’ W 3 1 (3)
Foz do Iguaçu (PR)a 25o 33’ S 54o 35’ W 2 1 (1); 17 (1)
João Pessoa (PB) 07o 07’ S 34o 52’ W 3 1 (3)
Leandro Ferreira (MG)a 19o 42’ S 45o 02’ W 2 1 (1); 17 (1)
Manaus (AM) 03o 08’ S 60o 01’ W 4 15 (4)
Marília (SP) 21o 56’ S 49o 53’ W 1 14 (1)
Maringá (PR)a 23o 25’ S 51o 55’ W 3 1 (1); 17 (1); 23 (1)
Milhã (CE)a 05o 40’ S 39o 11’ W 3 1 (3)
Nova Iguaçu (RJ)a 22o 45’ S 43o 27’ W 8 1 (8)
Pacujá (CE)a 03o 59’ S 40o 41’ W 3 1 (2); 2 (1)
Porto Velho (RO)* 08o 45’ S 63o 54’ W 5 1 (1); 13 (1); 17 (3)
Potim (SP) a 22o 50’ S 45o 14’ W 3 1 (2); 7 (1)
Pres. Prudente (SP) 22o 07’ S 51o 22’ W 3 17 (3)
Quixeramobim (CE)a 05o 12’ S 39o 17’ W 3 1 (3)
Rio Branco (AC)a 09o 58’ S 67o 48’ W 5 17 (5)
Rio de Janeiro (RJ)a 22o 54’ S 43o 14’ W 8 1 (8)
Salvador (BA)a 12o 59’ S 38o 31’ W 5 1 (5)
Santos (SP) 23o 57’ S 46o 20’ W 7 8 (2); 9 (1); 15 (2); 16 (2)
São Luiz (MA)a 02o 31’ S 44o 16’ W 4 1 (3); 5 (1)
São Sebastião (SP) 23o 48’ S 45o 25’ W 3 9 (1); 16 (1); 20 (1)
Várzea Grande (MT)a 15o 32’ S 56o 17’ W 2 1 (1); 17 (1)
Peru (N = 55) Iguitos b 03º 82' S 72º 30' W 17 16 (17)
Limab 11º 81' S 77º 07' W 19 16 (19)
Piurab 04º 49' S 80º 38' W 19 1 (16); 15 (3)
Venezuela (N = 7) Maracaya 10o 14’ N 67o 35 W 7 8 (1); 16 (6)
Guatemala (N = 7) Guatemala City 14o 37’ N 90o 31’ W 7 16 (7)
US (N = 5) Fort Lauderdalea 26o 07’ N 80o 08’ W 5 7 (1); 9 (1); 16 (1); 22 (1); 19 (1)
Senegal (N = 5) Dakar 14o 40’ N 17o 26’ W 5 3 (3); 7 (1); 10 (1)
Guinea (N = 4) Conakria 09o 30’ N 13o 43’ W 4 11 (4)
Uganda (N = 7) Entebe 00o 04’ N 32o 28 E 7 11 (6); 12 (1)
Singapore (N = 6) Singapore 01o 17’ N 103o 51 E 6 11 (2); 13 (4)
Cambodia (N = 2) Phnom Penh a 11o 35’ N 104o 55’ E 2 13 (2)
Tahiti (N = 4) Papeetea 17o 32’ S 149o 34’ W 4 13 (4)
using PEG precipitation [20% polyethylene glycol (PEG) 8000/2.5 M NaCl]. Sequencing reactions were carried out directly on both strands of DNA using ABI Big Dye chemistry (PE Applied Biosystems, Foster City, CA) and the sequences generated with an ABI 377 automated se-quencer. The amplified ND4 region corresponds to 336 base pairs from position 8488 to 8823 in the Anoph-eles gambiae mitochondrial genome (GenBank acces-sion number L20934). Sequences were edited using BioEdit Sequence Alignment Editor program (Hall 1999), and aligned in CLUSTAL X (Thompson et al. 1997). Sequence similarity of the ND4 sequences gen-erated in this study with those previously available in GenBank was assessed using BLASTA search (Altschul et al. 1990).
Tajima’s D test (Tajima 1989) and F* and D* tests (Fu & Li 1993) of selective neutrality were carried out using the DnaSP software (Rozas et al. 2003). The same software was employed to estimate the significance lev-els of these estimates using a distribution of 10,000 simulated populations generated by the neutral coales-cent process.
DnaSP was also used to (1) estimate the genetic di-versity parameters: haplotype didi-versity (Hd), nucleotide diversity (π), and the average number of nucleotide dif-ferences (k) for all data sets and (2) the average number of nucleotide differences (k) between clades.
To test the role of ecological and/or historical events on the genetic structure of American populations, a mini-mum spanning network of Ae. aegypti haplotypes was created using TCS 1.18 (Clement et al. 2000). GeoDis 2.0 (Posada et al. 2000) was used to determine the sta-tistical significance, after 10,000 replicates, of the geo-graphic association between haplotypes. Templeton’s in-ference key (Templeton 2004) was used to determine the likely mechanism of the observed genetic structure. Mis-match distribution was estimated employing Arlequin 2000 (Schneider et al. 2000) using a generalized non-lin-ear least-square approach (Schneider & Excoffier 1999). Phylogenetic relationships among all Ae. aegypti
populations were inferred with Network 4.2.0.1 (Fluxus Technology Ltd. at www.fluxus-engineering.com) using the median joining method (Bandelt et al. 1999). Un-weighted parsimony was performed in PAUP 4.0b10 (Swofford 2002) using a heuristic search with tree-bi-section-reconnection (TBR) and 1000 random-taxon ad-ditions. Parsimony bootstrap support values were gen-erated from 1000 pseudoreplicates with 10 random-taxon-addition replicates per pseudoreplicate. Parsimony uninformative characters were excluded from all the analyses. Sequences of Ae. albopictus (GenBank acces-sion number NC006817) and Ae. japonicus (GenBank ac-cession number AF305879) were employed as outgroups.
RESULTS
Three hundred thirty-six base-pairs long sequences from 218 individuals were obtained and used for phylo-genetic and population phylo-genetic analyses (190 American samples and 28 from other countries). Twenty haplo-types were obtained (GenBank accession numbers
DQ176828 to DQ176831, DQ176833 to DQ176843, and DQ176845 to DQ176849): 14 haplotypes were ex-clusive to the Americas, four exex-clusive to African/Asian countries, one is common to the Americas and Africa, and one to the Americas and Asia (Table). The haplotypes showed 22 nucleotide substitutions in 336 base-pairs, 18 synony-mous substitutions and four non-synonysynony-mous substitutions. Tajima’s D test yielded a value of 2.09516 (not sig-nificant, P > 0.05), whereas Fu & Li’s D* and F* values were -0.62927 (not significant, P > 0.1) and 0.55971 (not significant, P > 0.1), respectively. Based on these results, we assumed an infinite sites model (Bertorelle & Slatkin 1995) in subsequent analyses.
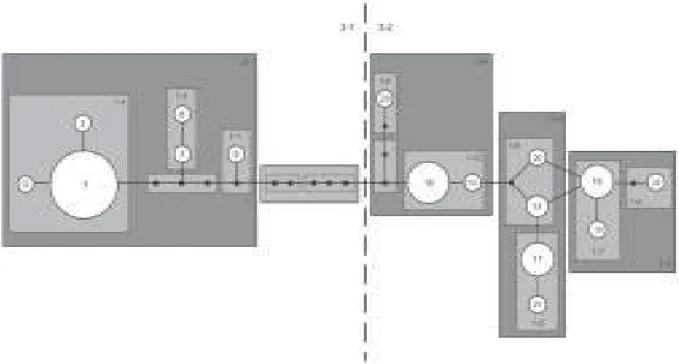
Statistical parsimony (Templeton et al. 1992, Posada et al. 2000) was used to generate a network for 16 ha-plotypes sampled in the American populations of Ae. aegypti. Relationships among distinct haplotypes are presented in Fig. 1, which shows two major haplogroups, designated clades 1 and 2. These two clades are separate by eight mutational steps. Clade 1 is composed of a fre-quent haplotype designated haplotype 1, which is con-nected to other less frequent haplotypes (2, 5, 7, 8, 9) by one or a few mutational steps. Clade 2 includes ha-plotypes 13, 14, 15, 16, 17, 19, 20, 21, 22, 23. This clade shows a complex evolutionary pattern, with reticulation and several high-frequency haplotypes.
For the entire data set the estimated haplotype diver-sity (Hd) was 0.82, the nucleotide diversity (π) under
the Jukes and Cantor model was 0.01997, and the mean number of nucleotide differences (k) was 6.54779. The haplotype diversity for Clade 1 was 0.3750 and for Clade 2 it was 0.75483, whereas the nucleotide diversity under the Jukes and Cantor model was 0.00325 and 0.00590 for clades 1 and 2, respectively.
Significant Dc and Dn distance values are shown in Fig. 2. The nested clades 1-12, 2-1, 3-2, and the total cla-dogram revealed significant Dc and Dn values, although the tip/interior status could not be determined for Clade 1-12 and the total cladogram and thus inferences here were in-conclusive. Results suggested long distance colonization via long distance dispersal for group 2-1 (which is Clade 1) and fragmentation followed by range expansion for nested clade 3-2 (Clade 2) (Figs 1, 2).
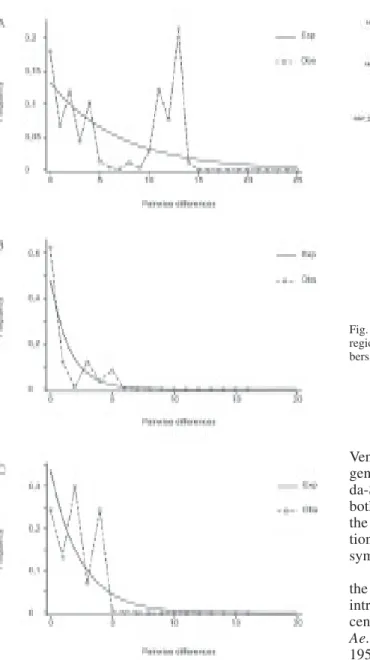
Pairwise mismatch distributions revealed a multi-modal distribution for the entire data set and Clade 2 (Fig. 3A, C), whereas a unimodal distribution, very simi-lar to expected values to a mutation-drift equilibrium model, was observed in Clade 1 haplotypes (Fig. 3B).
Phylogenetic relationships were estimated using both median-joining networks (MJN) and maximum parsi-mony (MP). As a result MJN and MP topologies show two major groups, which are separated by six mutational steps: Senegal haplotypes (3, 10) are related to Clade 1 whereas Asian and Guinea haplotypes (11, 12, 13, 23) are related to Clade 2 (Figs 4, 5). American haplotypes were recovered in both Clade 1 and Clade 2.
DISCUSSION
Results of the genetic analyses showed two Ae. aegypti mitochondrial lineages in the Americas: one related to African (Senegal) haplotypes and the other to African (Guinea and Uganda) and Asian haplotypes. Simi-larly, Powell et al. (1980) studied the genetic variability of allozyme loci from 34 Ae. aegypti aegypti populations and showed that Caribbean, South American, and US popu-lations were genetically related to those of Ae. aegypti aegypti from Africa, while populations of Ae. aegypti aegypti from Asia were close to Ae. aegypti formosus. They also proposed that the African-related Ae. aegypti aegypti population had been introduced into the Ameri-cas and Caribbean during the XVII and XVIII centuries.
The nucleotide diversity found in the present study and in Mexican populations (Gorrochotegui-Escalante et al. 2000) were three to eight times higher than those registered for An. gambiae (π = 0.0038) and An. arabiensis (π = 0.0023 – 0.0051) (Besansky et al. 1997). However, when estimated separately, the π value for Clade 1 (0.00325) and for Clade 2 (0.00590) were similar to those found for the Anopheles sibling spe-cies, suggesting that Ae. aegypti clades 1 and 2 evolved as two independent genetic lineages. Likewise, the nucle-otide divergence (K) between clades 1 and 2 (0.03207) is similar to that found for putative species. For instance, the divergence estimated in a RFLP analysis of mito-chondrial DNA in populations of An. nuneztovari from the Brazilian Amazon and Western Colombia (0.033 to 0.037) suggested that these Anopheles geographic popu-lations constitute separate species (Scarpassa et al.
Fig. 1 : haplotype network for a 336 bp NADH dehydrogenase subunit 4 region of mtDNA of 190 American samples of Aedes aegypti. Each line in the network represents a single nucleotide mutation. Empty circles (O) represent interior nodes that are absent in the samples. Numbers correspond to haplotypes referred to in the text and in the Table. Continuous lines (1-x clades) represent haplotypes which are one mutational step apart, whereas broken lines (2-x clades) are 2-steps apart.
2000). Within the Drosophila group, the estimated mtDNA divergences were 0.034 and 0.039 between D. melanogaster and the sibling species D. simulans and
D. mauritiana, respectively. Comparisons between D. simulans and D. mauritiana showed that the estimated mtDNA divergence was 0.012 (Caccone et al. 1988).
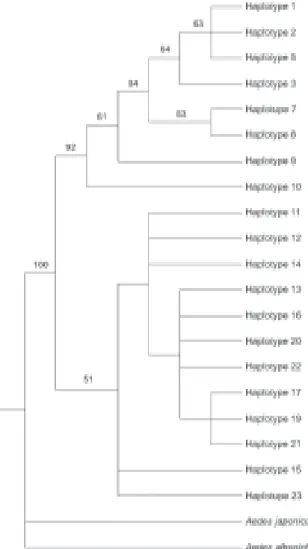
Phylogenetic analyses of the ND4 haplotypes em-ploying the MJN (Fig. 4) and MP (Fig. 5) criteria recov-ered of the same two clades. MP bootstrap support for clades 1 and 2 is moderate (92%). Results of SP and MP analyses showed that the haplotypes from West Africa (Senegal) and those from the Americas (Brazil, Peru, Venezuela, and US) are closely related. Interestingly, Ae.
0-step clade 1-step clade 2-step clade 3-step clade
Name Dc Dn Name Dc Dn Name Dc Dn Name Dc Dn
9 - - 1-1 2642L 2418
7 2273 2361 1-5 2363L 2327L
8 0 2379
I-T 2273 -18
1 1036 1044 1-3 1116S 1148S
2 0 1174
5 238 1380
I-T 917 -85
I-T 1420L 1170 2-1 - - 3-1 1284S 1592S 1-2-3-5-15-Long
Distance colonization
17 1117 1111 1-2 1089 1085
21 0 591
I-T 1117 520
13 0 1626 1-8 1205 1252
20 0 953
I-T 117 117 2-2 1097S 1466S
22 - - 1-4 0 2967
16 1940 1952 1-7 995 1239
19 0 3078
I-T 1940 -1126
I-T 1993 -964 2-3 2038 2673
23 - - 1-6 0 1285
14 0 1322 1-12 1682 1681
15 1697 1774L
I-T 1682 358 2-4 1682 1705
I-T -712S -1113S 3-2 1881 1920L
1-2-3-5-6-13-Past fragment Range expansion
Fig. 2 : results of nested clade analysis of a 336 bp NADH dehydrogenase subunit 4 mtDNA sequences from 190 American samples of Aedes aegypti. Dc and Dn for each analysis level are shown. Letters S and L refer to significantly low and high distances, respectively. I-T represent the mean difference between Dc and Dn distances of internal nodes (shown in gray) and external nodes of each group.
aegypti has never been eliminated from the US or Ve-nezuela. Perhaps, individuals from one or more of these countries could have infested Brazil after the eradica-tion of the 1950s (if the eradicaeradica-tion really happened).
the Americas. Similar results were found in a study us-ing Mexican populations of Ae. aegypti and the same
ND4 gene region. Gorrochotegui-Escalante et al. (2000) found two genetic clusters. The presence of two geneti-cally related groups in Mexico was corroborated by the results of maximum likelihood analyses (ML) that em-ployed a broad sample size (Gorrochotegui-Escalante et al. 2002). Furthermore, results of the MP and ML analyses using a combined data set that included the data employed in the current study plus several Mexican se-quences downloaded from the GenBank generated the same two clusters (not shown).
Recent studies on populations of Ae. aegypti from Venezuela and Peru, using the same fragment of the ND4
gene and MP analyses, generated two clusters (da Costa-da-Silva et al. 2005, Herrera et al. 2006). Moreover, in both studies, the results of the AMOVA demonstrated the major component of variation to be within popula-tion. This result suggests that the two clades occur in sympathy. A similar result was found in the current study. Results of all the analyses support the hypothesis that the mitochondrial lineages of Ae. aegypti aegypti were introduced into the Americas during the XVII and XVIII centuries, and experienced a bottleneck caused by the
Ae. aegypti vector control measures adopted in the 1950s and 1960s. During the 1970s, Ae. aegypti re-in-fested most American countries. Two evolutionary sce-narios may explain this. First, it is possible that some individuals survived the intensive vector control program adopted by the American countries. A second scenario is that of dispersion of Ae. aegypti from populations that remained in those countries where eradication of
Ae. aegypti had never been achieved. Consequently, an old lineage of Ae. aegypti persevered and dispersed throughout the Americas. Clade 1 haplotypes may be rep-resentative of those lineages.
Additionally, it is possible that Clade 2 haplotypes were introduced into the Americas during the 1980s as a consequence of the intense commercial exchanges with Asian countries and the commercial globalization. Simi-larly, the dispersion of Ae. albopictus from Asian coun-tries to the Americas occurred during the same period of time and was caused by the intense commercial ex-change (Gubler 2003). We raised the hypothesis that the haplotypes included in Clade 2 were introduced into the Americas from Asia countries with which the commer-cial exchanges are intense. As a result, the haplotypes
Fig. 3 : uncorrected pairwise differences among sequences of a 336 bp NADH dehydrogenase subunit 4 region mtDNA, generated from samples of Aedes aegypti from A: entire data set; B: Clade 1 samples, and C: Clade 2 samples. Continuous lines: expected values; dashed lines: observed values.
to both DENV and yellow fever virus (YFV) infections and to insecticides. Failloux et al. (2002) showed that genetic differences among Ae. aegypti populations de-pend on colonization history and may be associated with susceptibility to DENV-2. Lourenço-de-Oliveira et al. (2002) demonstrated the Brazilian populations of Ae. aegypti to be heterogeneous to susceptibility to both the YFV and DENV-2 infection. Additionally, lineages of Ae. aegypti may respond different to vector control measures when these make use of insecticides.
The pattern of the mtDNA haplotype diversity is con-sistent with two genetically distinct lineages of Ae. aegypti, and are suggestive that there might be two sub-species circulating in the Americas. Further studies will be necessary to test this hypothesis.
ACKNOWLEDGMENTS
To Sergio Russo Matiolli and Flora Fernandes-Matiolli for their discussion of the points we have raised; to Kleber José Whitaker and Alexandre Moreira for their laboratory support. To the three anonymous reviewers for their contributions to improve a first version of the manuscript.
REFERENCES
Altschul SF, Gish W, Miller W, Myers EW, Lipman DJ 1990. Basic local alignment search tool. J Mol Biol 215: 403-410.
Bandelt H-J, Forster P, Röhl A 1999. Median-joining networks for inferring intraspecific phylogenies. Mol Biol Evol 16: 37-48
Bertorelle G, Slatkin M 1995. The number of segregating sites in expanding human populations, with implications for estimates of demographic parameters. Mol Biol Evol 12: 887-892.
Besansky N J, Lehmann J A, Fahey G T, Fontenille D, Braack LEO, Hawley WA, Collins FH 1997. Patterns of mitochon-drial DNA variation within and between African malaria vec-tors, Anopheles gambiae and An. arabiensis, suggest ex-tensive gene flow. Genetics 147: 1817-1828.
Bosio CF, Harrington LC, Jones JW, Sithiprasasna R, Norris DE, Scott TW 2005. Genetic structure of Aedes aegypti popula-tions in Thailand using mitochondrial DNA. Am J Trop Med Hyg 72: 434-42.
Caccone A, Amato GD, Powell JR 1988. Rates and patterns of
scnDNA and mtDNA divergence within the Drosophila
melanogaster subgroup. Genetics 118: 671-683.
Clement M, Posada D, Crandall KA 2000. TCS: a computer pro-gram to estimate gene genealogies. Mol Ecol 9: 1657-1660.
da Costa-da-Silva AL, Capurro ML, Bracco JE 2005. Genetic lineages in the yellow fever mosquito Aedes (Stegomyia) aegypti (Diptera: Culicidae) from Peru. Mem Inst Oswaldo Cruz 100: 539-44.
de Brito AA, Manfrin MH, Sene FM 2002. Mitochondrial DNA phylogeography of Brazilian populations of Drosophila buzzatii. Gen Mol Biol 25: 161-171.
Donnelly MJ, Simard F, Lehmann T 2002. Evolutionary studies of malaria vectors. Trends Parasitol 18: 75-80.
Failloux AB, Vazeille M, Rodhain F 2002. Geographic genetic variation in populations of the dengue virus vector Aedes aegypti. J Mol Evol 55: 653-663.
Fig. 5 : strict consensus tree of 12 equally parsimonious topologies gen-erated in the successive weighting analyses. These topologies are a subset of 42 equally parsimonious topologies generated in the unor-dered, unweighted analysis. Numbers above the branches represent parsimony bootstrap support values (> 50) obtained for the haplotypes relationships. Maximum parsimony bootstrap analysis was carried out for the NADH dehydrogenase subunit 4 data set using 1000 pseudoreplicates and tree-bisection-reconnection branch-swapping. Aedes albopictus and Ae. japonicus were used as outgroups. L = 44; CI = 0.727.
that formed Clade 2 were transported to other regions along commercial routes. We speculate that the two mtDNA strains found by Powell et al. (1980) met each other in the Americas, after the 1980s.
The recent finding of two separated clusters in Asian populations (Mousson et al. 2005, Bosio et al. 2005) could be a result of a secondary introduction of lineages from the Americas into Asia, or that an evolutionary force is maintaining the observed mtDNA lineages, similar to an incipient speciation process.
Franco O 1961. A erradicação do Aedes aegypti do Brasil. Rev Bras Mal Doenças Trop 13: 43-48.
Fu YX, Li WH 1993. Statistical tests of neutrality of mutations.
Genetics 133: 693-709.
Gorrochotegui-Escalante N, Gomez-Machorro C, Lozano-Fuentes S, Fernandez-Salas I, Munoz ML, Farfan-Ale JA, Garcia-Rejon J, Beaty BJ, Black IV WC 2002. Breeding structure of Aedes aegypti populations in Mexico varies by region.
Am J Trop Med Hyg 66: 213-22.
Gorrochotegui-Escalante N, Munoz ML, Fernandez-Salas I, Beaty BJ, Black IV WC 2000. Genetic isolation by distance among Aedes aegypti populations along the northeastern coast of Mexico. Am J Trop Med Hyg 62: 200-209.
Gubler D 2003. Aedes albopictus in Africa. Lancet Infec Dis 3: 751-752.
Hall TA 1999. BioEdit: a user friendly biological sequence align-ment editor and analysis program for Windows 95/98/NT.
Nucl Acids Symp Ser 42: 95-98.
Herrera F, Urdaneta L, Rivero J, Zoghbi N, Ruiz J, Carrasquel G, Martinez JA, Pernalete M, Villegas P, Montoya A, Rubio-Palis Y, Rojas E 2006. Population genetic structure of the dengue mosquito Aedes aegypti in Venezuela. Mem Inst Oswaldo Cruz 10: 625-33.
Lourenço-de-Oliveira R, Vazeille M, Filipps AMB, Failloux AB 2002. Oral susceptibility to yellow fever virus of Aedes aegypti from Brazil. Mem Inst Oswaldo Cruz 97: 437-439.
Lourenço-de-Oliveira R, Vazeille M, Filipps AMB, Failloux AB 2004. Aedes aegypti in Brazil: genetically differentiated populations with high susceptibility to dengue and yellow fever viruses. Trans R Soc Trop Med Hyg 98: 43-54.
Mousson L, Dauga C, Garrigues T, Schaffner F, Vazeille M, Failloux AB 2005. Phylogeography of Aedes (Stegomyia) aegypti (L.) and Aedes (Stegomyia) albopictus (Skuse) (Diptera: Culicidae) based on mitochondrial DNA variations.
Genet Res 86: 1-11.
OPAS 1995. Dengue y dengue hemorrágico en las Américas: guías para su prevención y control. Publicación Científica no. 548,Washington.
Posada D, Crandall KA 1998. MODELTEST: testing the model of DNA substitution. Bioinformatics 14: 817-818.
Posada D, Crandall KA, Templeton AR 2000. GeoDis: a pro-gram for the cladistic nested analysis of the geographical distribution of genetic haplotypes. Mol Ecol 9: 487-488.
Powell JR, Tabachnick WJ,Arnold J1980. Genetics and the ori-gin of a vector population: Aedes aegypti, a case study. Sci-ence 208: 1385-1387.
Rozas J, Sánchez-DelBarrio JC, Messeguer X 2003. DnaSP, DNA polymorphism analyses by the coalescent and other meth-ods. Bioinformatics 19: 2496-2497.
Sambrook J, Fritsch EF, Maniatis T 1989. Molecular Cloning. A Laboratory Manual, 2nd ed., Cold Spring Harbor Labo-ratory Press, New York.
Scarpassa VM, Geurgas S, Azeredo-Espin AM, Tadei W 2000. Genetic divergence in mitochondrial DNA of Anopheles nuneztovari (Diptera: Culicidae) from Brazil and Colombia.
Gen Mol Biol 23: 71-78.
Schatzmayr HG 2000. Dengue situation in Brazil by year 2000.
Mem Inst Oswaldo Cruz 95: 179-181.
Schneider S, Excoffier L 1999. Estimation of past demographic parameters from the distribution of pairwise differences when the mutation rates vary among sites: application to human mitochondrial DNA. Genetics 152: 1079-1089.
Schneider S, Roessli D, Excoffier L 2000. Arlequin ver. 2000. A Software for Population Genetic Data Analysis, PhD The-sis, University of Geneva, Switzerland.
Slatkin M, Hudson RR 1991. Pairwise comparisons of mitochon-drial DNA sequences in stable and exponential growing popu-lations. Genetics 129: 555-562.
Slosek, J 1986. Aedes aegypti mosquitoes in the Americas: a review of their interactions with the human population.
Soc Sci Med 23: 249-257.
Smith CEG 1956. The history of dengue in tropical Asia and its probable relations to the mosquito Aedes aegypti. Am J Trop Med Hyg 59: 243-251.
Swofford DL 2002. Paup*: Phylogenetic Analysis Using Parsi-mony (*and Other Methods), Version 4. Sunderland, Sinauer Associates.
Tajima F 1989. Statistical method for testing the neutral mutation hypothesis by DNA polymorphism. Genetics 123: 585-595.
Templeton AR 2004. Inference key for the nested haplotype tree analysis of geographical distances. http://darwin.uvigo.es/ dowload/geodisKey 14Jul04.pdf
Templeton AR, Cranall KA, Sing CF 1992. A cladistic analysis of phenotypic associations with haplotypes inferred from restric-tion endonuclease mapping and DNA sequence data. III. Cladogram estimation. Genetics 132: 619-633.
Thompson JD, Gibson TJ, Plewniak F, Jeanmougin F, Higgins DG 1997. The CLUSTAL_X windows interface: flexible strategies for multiple sequence alignment aided by quality analysis tools. Nucleic Acids Res 25: 4876-4882.