UNIVERSIDADE FEDERAL DA PARAÍBA
CENTRO DE CIÊNCIAS DA SAÚDE
PROGRAMA DE PÓS-GRADUAÇÃO EM ODONTOLOGIA
ANÁLISE QUANTITATIVA DA INFILTRAÇÃO DE QUINOLINA
EM LESÕES CARIOSAS NATURAIS PROXIMAIS DE ESMALTE
Camila Santos de Mattos Brito
i
CAMILA SANTOS DE MATTOS BRITO
ANÁLISE QUANTITATIVA DA INFILTRAÇÃO DE QUINOLINA EM LESÕES
CARIOSAS NATURAIS PROXIMAIS DE ESMALTE
Dissertação apresentada ao Programa
de Pós-Graduação em Odontologia, da
Universidade Federal da Paraíba, como
parte dos requisitos para obtenção do
título de Mestre em Odontologia
– Área
de Concentração em Odontologia
Preventiva e Infantil.
Orientador: Prof. Dr. Frederico Barbosa de Sousa
ii
CAMILA SANTOS DE MATTOS BRITO
ANÁLISE QUANTITATIVA DA INFILTRAÇÃO DE QUINOLINA EM LESÕES
CARIOSAS NATURAIS PROXIMAIS DE ESMALTE
Banca Examinadora
_____________________________________________
Prof. Dr. Frederico Barbosa de Sousa
Orientador - UFPB
______________________________________________
Prof. Drª. Ana Maria Barros Chaves Pereira
Examinador - UFPB
______________________________________________
iii
DEDICATÓRIA
iv
AGRADECIMENTOS
A Deus, como não poderia deixar de ser, por tornar tudo possível. Por todas as oportunidades que tive, e por fornecer toda a calma e confiança de que, de uma forma ou de outra, tudo daria certo no final.
Aos Santos e aos Mattos Brito, que sem exagero nenhum, posso dizer que são os melhores do mundo. Sinto-me até um pouco culpada de ter concentrado todas as pessoas especiais em uma família só, mas suspeito que haja outras pessoas quase tão legais quanto em outras famílias por aí.
Em especial aos meus avós maternos e paternos, a quem também dedico este trabalho. Sou privilegiada de tê-los por perto, mesmo morando longe, mas sempre presentes em todas as conquistas. Aqui vai mais uma etapa concluída, e agradeço todo o apoio e incentivo de hoje e de sempre.
Ao orientador Frederico Barbosa, que acredito que nem imagina o quanto sou realmente grata por toda a paciência, aprendizados, experiências e acima de tudo, exemplo do tipo de profissional que quero me tornar. Sua competência e dedicação são inspiradoras.
Aos companheiros diários de LAMIB, Kássia, Danilo, Fernanda, Patrícia, Lúcia, Emanuella, Plínio, Adami, Cinthia e Maria Luisa, com quem tive a convivência mais intensa dos últimos dois anos, e os únicos que realmente compreendem a dimensão que teve esta pesquisa em minha vida.
A Yuri Gonzaga, que sempre foi a pessoa certa na hora certa, me fazendo feliz todos os dias. A companhia mais agradável, mesmo nos momentos mais atribulados. Sempre solícito e não medindo esforços para ajudar. Além de ser responsável pelo desenvolvimento dos softwares que salvaram nossas vidas.
Aos meus colegas do mestrado, que passaram por todos os sufocos juntos comigo. Desde a espera do resultado na seleção, até essa reta final. Alguns já conhecidos e queridos, outros que me conquistaram no decorrer destes dois anos. Vocês tornaram tudo mais leve e divertido.
Agradeço especialmente as colegas e amigas Julyana e Laudenice, que foram de grande ajuda e possibilitaram a realização desta pesquisa, através da coleta de dentes.
v
“Aqui chegamos, enfim
A um ponto sem regresso Ao começo do fim De um longo e lento processo Que se apressa a cada ano Como um progresso insano Que marcha pro retrocesso E é só o começo Estranhos dias vivemos Dias de eventos extremos E de excessos em excesso Mas se com tudo que vemos Os olhos viram do avesso Outros eventos veremos Outros extremos virão Prepare seu coração Que isso é só o começo”
vi
RESUMO
A imersão em quinolina de lesões naturais de cárie em esmalte tem sido
importante para determinar o tamanho da lesão e áreas com diferentes tamanhos
de poros. No entanto, dados volumétricos quantitativos resultantes da infiltração
desta substância não estão disponíveis na literatura. Sendo assim, o presente
trabalho objetivou apresentar os primeiros dados quantitativos volumétricos do
infiltrado por quinolina (na maioria das amostras < 50 % do volume de poros
foram infiltrados) em camadas histológicas (incluindo zona escura) de cortes por
desgaste de lesões cariosas naturais em esmalte (n = 20). Além disto, verificou-se
que um parâmetro relacionado à permeabilidade previu 60 % da variância da
infiltração volumétrica. A distância da superfície do esmalte original foi
inversamente relacionada com o volume infiltrado. Na maioria das lesões, a zona
translúcida não foi o
front
da lesão. Mapeamento em 2D em tempo real de
processos de transporte após a imersão em quinolina, através de microscopia de
luz polarizada, revelou primeiramente um fluxo de água para o exterior e uma
conseguinte penetração por quinolina, ambos seguindo a trajetória dos prismas
paralelamente ao eixo principal dos cortes por desgaste. Novos eventos da
natureza dos processos de transporte em cortes por desgaste aqui relatados
podem ser explorados para melhorar a eficiência de ambos os agentes
remineralizantes e infiltrantes de resina para tratamento de lesões cariosas.
vii
ABSTRACT
Immersion of natural enamel caries (NEC) in quinoline has been important for
determining lesion size and mapping areas with different pore sizes, but
quantitative volumetric data of the infiltration are not available. Here we provide
first quantitative volumetric data of the volume infiltrated by quinoline (mostly <
50% of pore volume were infiltrated) in histological layers (including dark zone) of
ground sections of NEC lesions (n = 20) and report that a parameter related to
permeability predicted 60% of the variance of the volumetric infiltration. Distance
from the original enamel surface was inversely related to the infiltrated volume. In
most lesions the translucent zone was not the lesion front. Real-time 2D mapping
of transport processes after immersion in quinoline revealed an early outward
water flow and a late inward quinoline penetration, both following prisms paths
parallel to the main axis of ground sections. New events of the nature of transport
processes in ground sections of NEC lesions reported here can be explored to
improve efficiency of both remineralizing agents and resin infiltrants for treatment
of NEC.
viii
SUMÁRIO
1.INTRODUÇÂO... 1
2.CAPÍTULO I... 6
3 CONSIDERAÇÕES GERAIS... 35
4.CONCLUSÃO... 36
1
1. INTRODUÇÃO
O esmalte, tecido que recobre a coroa do elemento dental, é a estrutura
mais mineralizada do corpo humano, apresentando volume mineral próximo a
90%. A porcentagem remanescente é constituída por matéria orgânica e
água
10,34,23.
Seu componente mineral encontra-se na forma de cristais de apatita e são
compactados em colunas definidas como prismas. Esse arranjo dá origem a uma
estrutura porosa, estando os poros localizados entre os cristais
39.
O principal componente inorgânico do esmalte é o fosfato de cálcio na
forma de cristais de hidroxiapatita (Ca10(PO4)6OH2), porém outros constituintes
inorgânicos, se presentes no período de formação do esmalte dental, podem ser
incorporados à estrutura da apatita. Esta contém uma quantidade considerável de
grupos carbonato, que substituem a hidroxila (OH
-) ou o fosfato tetraédrico (PO4).
Pode-se encontrar ainda, em concentrações mais baixas e variáveis, outros
constituintes tais como potássio, cloreto, carbonato, sódio, magnésio entre
outros
15,22. A composição exata varia entre dentes, em diferentes partes do
mesmo dente e até mesmo entre o centro e a periferia do mesmo prisma.
Análises químicas e os dados cristalográficos comprovam a não homogeneidade
do esmalte
13.
Diversos estudos, através de análises bioquímicas, têm proposto uma
fórmula para a célula unitária da apatita do esmalte humano normal
12,3,15. Elliott
16propôs
para
a
apatita
a
fórmula
Ca8.856Mg0.088Na0.292K0.010(PO4)5.312(HPO4)0.280(CO3)0.407(OH)0.702Cl0.078(CO3)0.050,
obtendo uma densidade de 2.99 g cm
-3para a mesma. Baseado nos dados de
Elliot
15, Sousa, Vianna e Santos-Magalhães
34encontraram para o esmalte dental
maduro, 92% de volume mineral e 2% e 6% de volumes de matéria orgânica e
água, ajustando, pela primeira vez, os valores destes três componentes em
100%
15,34.
2
lipídeos
17. A matéria orgânica situa-se no interior dos poros do esmalte, rodeando
a hidroxiapatita
32,22.
O terceiro componente do esmalte é a água. Esta se encontra sob duas
formas
10: água firmemente aderida, que é incorporada como uma camada de
hidratação ao redor dos cristais do mineral e está ionizada em OH
-e H
+(formando íons HPO4
2-). Já a água adsorvida, fracamente aderida ou livre,
encontra-se no interior dos poros e pode ser removida com mais facilidade
6,2,15.
Para He
24devido a dificuldades técnicas, a quantificação da água firmemente e
fracamente aderida não tem sido realizada com precisão
24.
Embora seja apenas uma pequena parte do esmalte, a água desempenha
um papel importante na função, pois mudanças em sua quantidade alteram
significantemente as propriedades mecânicas do tecido
29.
Uma das contribuições mais influentes no campo da patologia da cárie veio
a partir da interpretação da birrefringência do esmalte cariado sob microscopia de
luz polarizada (MLP) e através da radiomicrografia
9,31,18. Tanto em lesões de
dentes permanentes como em decíduos, diferentes zonas com conteúdo mineral
variável foram distinguidas utilizando microscopia de luz polarizada
9,33.
A birrefringência de esmalte vem do mineral (birrefringência intrínseca, com
o sinal negativo) e dos volumes não-minerais (birrefringência de forma, com sinal
positivo), de modo que a imagem de esmalte em MLP (a birrefringência
observada) é um resultado da soma destes dois tipos de birrefringência
34. Na
década de 1950, Darling
8propôs uma abordagem matemática para interpretar
birrefringência observada do esmalte (BRobs) que lhe permitiu obter informações
estruturais em pontos histológicos. Esta abordagem é baseada na aplicação de
um procedimento duplo para interpretar birrefringência do esmalte
8, isto é:
(i)
a utilização de meios de imersão com índices de refração e tamanhos
moleculares diferentes (ar, água e quinolina) em secções por desgaste
da mesma lesão, e
3
A análise de Darling
8se tornou extremamente popular. Nesta análise,
aplicou-se o pressuposto de que os poros do esmalte são preenchidos por um
único componente (e um único índice de refração), o meio de imersão (modelo
clássico do índice de refração da fase não mineral, neste caso, sendo
representado por
n
2)
8. Esse modelo foi usado para adaptar a equação de
Wiener
38para a birrefringência de forma (relacionada ao volume não mineral) do
esmalte. Esta clássica equação foi formulada para materiais heterogêneos
compostos por diferentes fases, cada uma com seu próprio índice de refração (n)
e volume.
De acordo com a abordagem matemática de Darling
8, considerando um
mesmo meio de imersão, qualquer alteração na birrefringência é interpretada
como alteração no volume mineral, uma vez que só são considerados dois
volumes no esmalte (volume mineral, com índice de refração
n
1, e volume não
mineral, com índice de refração
n
2)
8. Apesar de, em torno da época desta
publicação já ser conhecido que os poros do esmalte possuem matéria orgânica e
que sua água não é completamente removida à temperatura ambiente
1, esse
modelo teve popularidade por não ter sido proposta nenhuma melhor
aproximação para interpretar a birrefringência do esmalte. A grande quantidade
de informação que a imagem do esmalte em microscopia de luz polarizada
proporcionava era bastante atrativa para os pesquisadores. Como interpretação,
só havia a opção do modelo de Darling
8.
4
< (1,62-1,33)], se interpretava que os poros eram grandes; sem redução, se
interpretava que os poros eram pequenos demais para que a quinolina infiltrasse.
Desta forma, as zonas diferentes em tamanhos de poro e volumes de cárie
de esmalte foram descritos: camada superficial, corpo da lesão, zona escura e
zona translúcida. É bem conhecido, no entanto, que tais características não são
universais, de modo que muitas lesões podem não apresentar as zonas escura e
translúcida
33, e ainda a camada superficial
11,28,30,36.
Estas zonas surgem a partir de diferenças no volume de poros do esmalte
afetado durante a progressão da cárie. O corpo da lesão tem um volume de cerca
de 5-25% de poros, enquanto que a zona escura e a zona translúcida têm um
volume de poros entre 1% e 4%
5.
A zona translúcida pode variar de 5 a 100 µm de largura, e nela
encontra-se a primeira alteração cariosa visível no esmalte, correspondendo a uma perda
mineral de cerca de 1-2%, composta por um pequeno número de poros
relativamente grandes. Interpretações iniciais sugeriram que a primeira etapa a
acontecer é a remoção de proteínas, seguida de perda de íons inorgânicos.
Embora perda de mineral tenha sido mostrada, a perda de material orgânico não
foi demonstrada de forma convincente. Muita desta perda inicial também pareceu
derivar a partir das regiões interprismática e intercristalinas, devido, em parte, a
um fluxo facilitado de íons através destas regiões
7,4,16.
A interpretação de Darling
8dá suporte matemático para o evento de des e
remineralização e para o estabelecimento dos limites da lesão cariosa de esmalte
e como o esmalte cariado é contrastado do esmalte normal. Isto tem ampla
repercussão em estudos laboratoriais e de campo epidemiológicos, envolvendo
patologia, diagnóstico, prevenção e tratamento.
5
Considerada como o “front” da lesão pela interpretação de Darling
8, e
sendo confirmada posteriormente com dados quantitativos de volume mineral por
Hallsworth, Weatherell e Robinson
21, a zona translúcida foi descrita numa
localização muito aquém do “front” da lesão natural de esmalte
27. Este relato abre
um questionamento sobre os limites da lesão, que podem estar sendo
extremamente subestimados. Uma vez que a zona de BRobs positiva em água
(delimitada pela zona translúcida) é relacionada com esmalte opaco, e este é
comumente usado como critério para determinar os limites da lesão cariosa de
esmalte, a possibilidade da zona translúcida não ser o “front” da lesão coloca em
questão um volume gigantesco de dados sobre lesão cariosa do esmalte,
merecendo atenção de mais estudos.
6
2. CAPÍTULO 1
O manuscrito a seguir foi submetido para publicação no periódico Acta
Biomaterialia e encontra-se em análise.
Natural Enamel Caries in Quinoline: pattern of infiltration
Camila Brito 1
Kássia Regina 1
Frederico Barbosa de Sousa1,2,3*
1
Master program in Dentistry, Health Sciences Center, Federal University of Paraiba, Cidade Universitária, 58051-900, João Pessoa, Paraiba, Brazil.
2
Laboratory of Microscopy and Biological Image, Health Sciences Center, Federal University of Paraiba, Cidade Universitária, 58051-900, João Pessoa, Paraiba, Brazil.
3
Department of Morphology, Health Science Center, Federal University of Paraiba, Cidade Universitária, 58051-900, João Pessoa, Paraiba, Brazil
*Corresponding author:
Frederico Barbosa de Sousa
Departamento de Morfologia, Centro de Ciências da Saúde, Universidade Federal da
Paraíba, Cidade Universitária, S/N, CEP 58051-900, João Pessoa, Paraíba, Brazil
7
Abstract
Immersion of natural enamel caries (NEC) in quinoline and observed in polarized light
microscopy has been important for determining lesion size and mapping areas with different
pore sizes, but quantitative volumetric data of infiltration are not available. The present study
provides first quantitative volumetric data of the volume infiltrated by quinoline (mostly <
50% of pore volume were infiltrated) in histological layers (including dark zone) of ground
sections of NEC lesions (n = 20). Moreover, it is reported that a parameter related to
permeability predicted 60% of the variance of the volumetric infiltration. Distance from the
original enamel surface was inversely related to the infiltrated volume of quinoline. In most
lesions the translucent zone was not the lesion front. Real-time 2D mapping of transport
processes after immersion in quinoline revealed an early outward water flow and a late
inward quinoline penetration, both following prisms paths parallel to the main axis of ground
sections. New events on the nature of transport processes in ground sections of NEC lesions
reported here can be explored to improve efficiency of both remineralizing agents and resin
infiltrants for treatment of NEC.
8
1. IntroductionVariations in the apparent permeability of carious enamel in histological ground sections have long called attention of the scientific community, specially regarding the different histological zones seen in carious enamel when a given material is used as immersion medium [1]. The advent of radiographic techniques with microscopic resolution have also brought up that variations in mineral densities existed [2]. The most influential contributions came from studies with polarizing microscopy combined with the mathematical model proposed by Darling to interpret optical birefringence of enamel [3, 4]. Among the histological zone, a particular feature has called the most attention: a dark zone seen when carious enamel was immersed in an oil
ediu alled ui oli e. I the ea l ’s, it as epo ted that the relative penetration through the pores of the dark zone was inversely proportional to the molecular size of a wide range of liquids used to imbibe ground sections and that infiltrated into other zones of the same lesions [5, 6]. It was concluded then that the smaller pores in the dark zone resulted from remineralization, and since then, the most influential literature on the histopathology of enamel caries has been based on that assumption[7, 8].
9
enamel takes longer than water loss during dehydration of wet enamel, suggesting that drying could lead to conformation changes of the organic matter and this could reduce the diffusion rate of water [9]. It was also shown that concentrated salt solutions could diffuse very slowly, requiring a long time (months) to result in a slight penetration into the pores of normal enamel [10]. Recently, the first quantitative volumetric data on the infiltration of liquid with varying refractive indexes in developing (hypomineralized) enamel provided evidence that diffusion rate is inversely proportional to pore volume [11]. In this way, studies on the infiltration of dark zone have probably neglected the possible variations in the diffusion rates of the different liquids tested and the effect of organic matter (morphologically changed after air drying) involved in it [4, 5, 6]. There is evidence that removal of organic matter with solvents enhances infiltration of quinoline and reduces the size of the dark zone [12], suggesting that the dark zone may not be a result of remineralization. In addition, dark zone is not a universal feature of natural enamel caries (NEC) [13], and it has been shown, in figures published by the same author, that proposed it was located in a relatively normal enamel [4], to be partially located at the most demineralized histological zone of enamel caries (body of the lesion), in a frank contradiction with the most widely accepted description.10
has shown that the distance to be traveled by the liquid and air displacement in the pores during infiltration are major factors that need to be take into account to interpret the nature of the diffusion process in NEC [16]. Studying the infiltration of quinoline is important to further understand the nature of viscous liquids, and resin infiltrants used to arrest NEC are viscous liquids (more than watery liquids), and to validate the size of NEC lesions.Our previous report [16] indicated that prediction of infiltration could be strengthened with liquids with viscosity higher than that of salt solutions with refractive indexes 1.4-1.47. The aim of this study was thus to test this hypothesis using quinoline. We also tested the hypothesis that distance from the start location of penetration is a factor in the infiltration of NEC lesions by quinoline.
2. Materials and methods
2.1 Samples
11
different granulations) with final thickness between 50 and 90 m. All ground sections were kept in a 0.02 % sodium azide solution before infiltration with air and quinoline.Final sample thickness was obtained after immersion in quinoline. The sample was then cut using a razor blade under the stereomicroscope, as close as possible to the transversal (maximum distance of 100 a d follo i g p is s’ paths. Afte that, sections were positioned edge-on in a transmitted light polarizing microscope equipped with a 20X objective (resolution of 0.7 m) and digital photomicrograhs were taken in order to perform measurements of thickness with the aid of an image analysis software (ImageJ, NIH, USA).
2.1 Quantification of mineral volume
Quantification of mineral volume (V1) was performed using the Angmar equation [18],
based on a mineral density of hydroxiapatite 2.99 gcm-3 [19], as recently described [16]. The non-mineral volume (V2), the pore volume, was calculated by 1 – V1.
In each sample, a transversal line (from the enamel surface to the enamel-dentin junction) was drawn across the NEC lesion and histological points (area of 15 x 15 m), at 20m interval along the transversal, were selected for quantitative measurements of all parameters described in this study. A total of 1124 points comprised the final sample.
12
2.3 Quantification of water and organic volumes and the water more easily available for diffusion(permeability)
For the interpretation of observed birefringence (BRobs) in water, the approach of Sousa et al. [20] was used in order to quantify water () and organic () volumes (the two constituents of V2). This procedure has been minutely described in many earlier reports [4, 21, 11]. A
custom-made software was used to perform those calculations. It is available on the internet (http://hotfile.com/dl/204330734/6099675/EBI-0.1.jar.html) for free use. Afterwards, we calculated the water more easily available for diffusion (d, which we call a permeability parameter) by [21]:
100
2
d (1)This equation is the product of by /(100-V1), standing for the effective pore size and
the inverse of pore viscosity, respectively.
2.4 Quantification of quinoline infiltration
After measuring BRobs in water, each sample was dried at room temperature (25º C and
50% of relative humidity) for 48 hs and then immersed in quinoline for 24h.
13
enamel pores after drying. Recent studies performed by our group on the relationship between loosely bound water and organic volume made possible to calculate an approximation of 2 from experimental mineral and organic volumes. Those data were available in all NEC lesions of this study, and our approximate experimental 2 was given by [22]:
2exp
2theo
0
.
5759
0
.
7396
(2)theo
2
is the predicted 2 as a function of the experimental mineral volume and its volume fractionis calculated by [11]:
2
theo0.69871.2487 V1
100
0.544 V1
100 2 (3)
And is the difference between experimental and predicted organic volume. The fraction of the predicted organic volume is given by [11]:
2 1 1 100 584 . 0 100 46808 . 0 08654 . 0
V V
theo
(4)The results of Eqs. (3-4) have to be multiplied by 100 so that they can be inserted in Eq. (2).
2theo
is a parameter inversely related to pore viscosity.
Thus, we assumed that dried NEC had an air volume equal to
2exp. By the use of this value in the mathematical approach for interpretation of BRobs by Sousa et al [20], it could be14
2.5 Real-time two-dimensional mapping of the infiltration of quinolineThirteen out of the twenty samples were selected to perform real-time mapping of quinoline infiltration into NEC. As described in [16], an orientation-independent polarizing
i os ope s ste ith o e a ia le eta de k o as si gle pols ope [ ] as used to ap
15
which allowed measurements of retardances up to 265 nm. The system was calibrated with a sample of normal enamel with points where retardance had been measured manually with the Berek compensator. A good agreement between the two systems was found.After drying, the sample was placed between a glass slide and a cover glass and quinoline was injected with a brush into the space between cover glass and glass slide and diffused to the sample. Starting one minute after the injection of quinoline, a series of measurements of changes in birefringence were performed in the following time intervals: at 1 minute intervals within the first 10 minutes, at 5 minutes intervals up to 1 hour after injection. In two samples changes were registered for a longer time, using the following time intervals: at 3 minute intervals up to 30 minutes after immersion in quinoline, 10 minutes intervals up to 70 minutes after immersion in quinoline, at 30 minutes intervals up to 3.5 hs after immersion in quinoline, at 1 hour intervals up to 9.5 hs after immersion in quinoline, and at 12, 36 and 48 hs after immersion in quinoline.
Technical problems did not allow registration of longer periods for all samples. During each series, both the digital camera and the signal generator were controlled by customized software that automatically synchronized the signal generator (to release the proper voltage to the liquid crystal) and the digital camera (to shoot). The four resulting images were treated with the four-frame algorithm provided by Shribak [23], resulting in an image of the map of birefringence in enamel. Changes in retardance (retardance multiplied by sample thickness is the birefringence) were used to map the infiltration of the liquids.
2.6 Data analysis
16
hypothesis, differences between particular R2 pa a ete s e e tested usi g Cohe ’s effe t size for proportions [24]:y x
h
(5)and
P
arcsin
2
(6)In Eq (6) P is the R2 coefficient of a given parameter. When testing predictors of the proportion of the pore volume infiltrated by quinoline (
2qui/V2)
xand
y were related to R2
coefficients of d and of another parameter (mineral volume, or under comparison, respectively. For other comparisons,
xand
ywere related to the higher and the lower R2 parameters being compared, respectively. Real-time 2D-mapping of quinoline infiltration was analyzed qualitatively by visually examining videos made with the acquired birefringence images.3 Results
17
enamel surface inward, following the prisms paths, but with a lower rate this time. This inward wave (probably representing infiltration of quinoline) occurred only at a restricted area: the one where the body of the lesion had the deepest depth into the enamel layer. Changes in the remaining parts of the enamel layer were negligible up to 1 hour.In one of the lesions, the 2D-mapping of the infiltration was registered up to 48 hours and more details related to the late stages than to the early stages were registered. An inward penetration, starting at the original enamel surface, following prism paths towards the bottom of the body of the lesion, was registered (Video 2). At some time during this infiltration, some regions in the body of the lesion (the center of the field of view, just below the surface layer) underwent a reduction in retardance (corresponding to the dark zone) while the infiltrating material (probably quinoline) penetrated further at deeper areas of the body of the lesion. The amount of the infiltrated material at the surface layer remained unchanged while the amount located at an area just beneath it (along prisms paths) showed reduction as the material infiltrated to deeper parts. Adjacent to the area where the changes described above took place, at the left lower side (where the surface layer and part of the body of the lesion were lost), quinoline infiltrated towards the bottom of the body of the lesion decreasing the size of a dark zone under formation and penetrating a zone more internally located (translucent zone). Video 3 shows the same features shown in Video 2, but with a wider field of view.
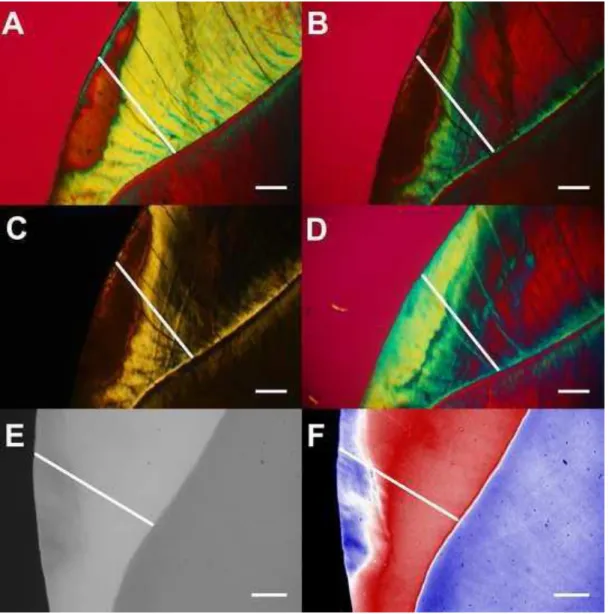
Fig.1 shows typical histological features of NEC lesions (located in mid-crown enamel) under all immersion media used and the path containing the histological points where quantitative measurements were performed. In water, a positively birefringent (positive
BR
obswater)18
enamel had parts with both positiveBR
obswater and negativeBR
obswater(Fig. 2B). Without the Red I filter, opaque enamel has the same color of the background (Fig. 2C). In quinoline, most of the surface layer and the whole body of the lesion with positiveBR
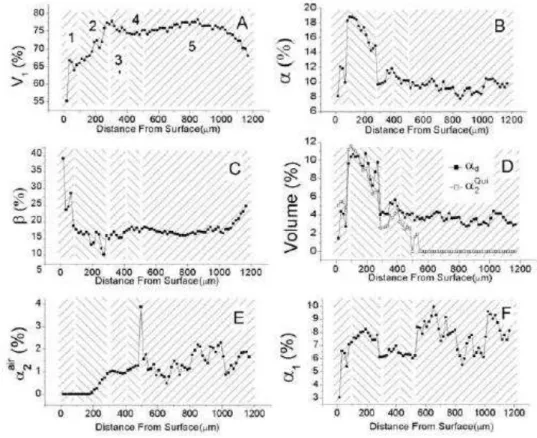
obswater became translucent (Fig. 1D). A translucent zone is located between the isotropic dark zone and isotropic inner enamel (Fig. 1D), and this later is slightly increased in relation to the size of the isotropic zone in inner enamel under air immersion (Fig.1B). The outer part of the NEC lesion is shown radiolucent under microradiography (Fig. 1E). In pseudo-colors, the microradiograph shows that the outer 300 m of dentin is also demineralized (Fig. 3F).Component volumes were measured at 1124 histological points from all lesions. Data on the component volumes measured along the line shown in Fig 1 revealed that mineral volumes were lower than 80% (Fig. 2A). Regarding non- i e al olu es, ate olu e p ofile had U shaped curve with the highest values in the positively (in water) body of the lesion (Fig. 2B), while organic volume had a decreasing profile from the enamel surface inward (Fig. 2C). The volume infiltrated by quinoline and d had very similar profiles up to ~500 m from the enamel surface, and thereafter d remained relatively flat while
2qui decreased until reaching zero at ~700 m from the enamel surface (Fig. 2D). The outer part of the enamel layer (which includes the surface layer, body of the lesion with positiveBR
obswater, dark zone and translucent zone) had some parts of its pore volume infiltrated by quinoline (Fig. 2D). After immersion in quinoline, some air remained in the pores and this air volume showed an increasing profile from the middle of the body of the lesions inward up to approximately reaching a plateau in inner enamel (Fig. 2E). The firmly bound water remaining after quinoline immersion showed a roughly flat profile with values ranging from 7 to 10% (Fig. 2F).19
The dark zone was found in all lesions, presenting either a small part located in the body of the lesion with positiveBR
obswater (11 lesions) or entirely located in the inner enamel with negativewater obs
BR
(9 lesions). In one lesion (without positiveBR
obswater) no dark and translucent zones were not seen and quinoline did not infiltrate (data not shown). In the lesion shown in Fig.1, the translucent zone was not the lesion front and the dark zone was entirely outside the body of the lesion with positiveBR
obswater. The lesion shown in Fig. 3 (see arrow) is an example of a dark zonepartially located in the body of the lesion with positive
BR
obswaterand opacity under air immersion.From all major component volumes, d was shown as the best predictor of the proportion of pore volume infiltrated by quinoline (
2qui/V2) (Fig. 4), predicting 60% of variances (Fig. 4D).The effect sizes of the differences were: 1.572 for d x V1; 0.677 for d x ; and 0.974 for d x .
Comparing d alues of ui oli e ith the o e of Thoulet’s solutio ith ef a ti e i de . [16], the effect size was 0.19.
In the outer part of the enamel layer, the distance from the enamel surface showed moderate inverse relationships with both
2qui/V2 (R2
= 0.155; Fig. 5A) and
2qui (R2 = 0.248; Fig. 5B). Considering the flow mechanics during infiltration of quinoline, we tested the hypothesys that d would be directly related to the negativeBR
obswater. In the outer part of the enamel layer, a very strong direct relationship (R2 = 0.798) was found between those parameters, but in the inner part a lower R2 (0.424) was found. The effect size of the differences between these R2 values was 0.791. Effect sizes are classified as [24]: negligible (0-0.2); small (< 0.5); medium (0.5< ES < 0.8);20
4 DiscussionCombining information on component volumes, permeability (d) and flow mechanics (real-time 2D-mapping), our data provide completely new information on changes in NEC during infiltration of an oil medium. In this report we focused on the pattern of infiltration, whilst more in depth details of both dark and translucent zones will be reported in a future publication. Confirming a recent report on NEC, most of the transport processes took place along prisms paths and were restricted to the main body of the ground sections. The first evidence that transport of materials occurs mostly along prisms paths in ground sections of enamel was shown by Medeiros et al [15] with water displacement in normal enamel. Data on the flow mechanics of the first stages following immersion in quinoline provided evidences suggesting a water flow from inner to outer enamel, following prisms paths, filling the body of the lesion (that part with positive
water obs
BR
) from the bottom up. The reasons why the material in this early flow is considered as water are: (i) quinoline has been shown to cause dehydration in ground sections of NEC [25]; (ii) a considerable amount of firmly bound water remained, after drying, in the inner part of the enamel layer of our samples (Fig. 2F); (iii) the flow rate was relatively fast; and (iv) considering prism paths as the main pathways, the outward flow occurred towards the location with the higher concentration of quinoline.The fact that water flowed following prisms paths is even more remarkable than the
e e t epo t that Thoulet’s solutio s also do so. Be ause ate is less is ous tha Thoulet’s
solutio a d is the ai o po e t i oth p is s’ sheaths a d p is ati a d i te -prismatic enamel [9], it was expected that the osmotic pressure caused by quinoline at the entrance of the
p is ’s paths at the o igi al e a el su fa e ould ause a do o e e t of ate . The
21
nanopores [26] is the main force responsible for a more firmly bound water in prismatic and inter-prismatic pores. As highlited recently [16], this suggest that demineralization mostly results ing o th of the ajo po es i p is s’ sheaths a d those po es e la ge at the e pe ses of the
intra-p is ati e a el. Othe ise, eigh o i g p is s’ sheaths ould o e t ea h othe laterally, causing random diffusion of water during the early stages after immersion in quinoline. We recognize, however, that this needs further structural confirmation. Nevertheless, it can be said that the enamel structure is highly preserved in NEC, confirming recent nanostructural characterization with high resolution 3D X-ray scattering [8]. This water flow is evidence that flow in the opposite directions is expected when aqueous liquids (that do no cause dehydration) are infiltrated into dry NEC. This has important implications for remineralizing agents that are very fluid. They might be transported to inner enamel by that flow along prisms sheaths, decreasing remineralization in the main body of the NEC lesion. Analysis of flow mechanics of the infiltration of remineralizing agents might be able to help in the development of agents with improved remineralization efficiency.
The key assumption in classic enamel studies that quinoline is the first material penetrating into enamel pores in dried ground sections of NEC [5, 6, 14] is inconsistent, compared to the data presented by this study. During the initial stage, because quinoline is a dehydrating agent [25], there occurs an outward water flow exerting a force against penetration of quinoline, which comes after the water flow is ceased. Then, quinoline flows starting at the original enamel
su fa e follo i g p is s’ paths to a ds the otto of the od of the lesio . As the flo
proceeds, d is the main factor determining the pore volume occupied by quinoline (
2qui/V2)22
indicating that there was enough water (as 1), although in a more viscous pore compartment, available for further diffusion of other agents after infiltration in quinoline. The permeability of the remaining pore volume is lower because 1 is lower than the total water volume. This parameter of permeability is expected to be the main factor controlling diffusion of other agents (eg. acid solutions) in infiltrated enamel. We propose that resin infiltrants should be tested based on the reduction of permeability they cause after infiltration.Confirming our hypothesis, prediction of the infiltration of quinoline by d was improved
o pa ed to Thoulet’s 1.40 and 1.47, in spite of a low effect size (0.19). It was also confirmed that distance from enamel surface is a factor reducing the infiltration of quinoline (Fig. 4A-B). The implication of the effect sizes of differences in predictions on the proportion of pore volume infiltrated by different materials needs to be investigated.
23
distance from enamel surface (the starting point of penetration), effective pore size () and time (Fig. 4 and Videos 2 and 3). The histopathological features shown here describe NEC lesions as a result of loss of mineral volume and gain of both water and organic volumes.Our results are consistent with the reduction of the dark zone after removal of organic matter [12], what can be explained by the fact that removal of organic matter is expected to increase permeability (d).
The strong relationship between
BR
obswater and d in the outer part of the enamel layer indicates that permeability of NEC lesions in ground sections can be fast screened based on the qualitative distribution ofBR
obswater. Once pris s’ paths a e the ai path a s fo t a spo t of materials in intact teeth [28], and recent data indicate that this is the same in ground sections of NEC [16], fast screening of NEC ground sections combined with real-time 2D mapping might provide an invaluable technique for exploring flow mechanics of both remineralizing and infiltrant agents, opening new avenues for enhancing non-invasive treatment of NEC lesions. The less strong relationship betweenBR
obswater and d in the inner part of the enamel layer gives further evidence of the important of 2D mapping in diffusion in NEC.24
AcknowledgementsThe authors would like to express their sincere thank to Dr Michael Shribak (Marine Biological Laboratory, USA), who helped with the selection of the appropriate parts of the single polscope and their alignment in single polscope setup, and Mr. Yuri Gonzaga (Master in Computer Science, Federal University of Paraiba, Brazil), who developed the softwares used to control the single polscope and obtain retardance images. The first two authors of this study were financially support by scholarships from CNPq (Brazilian Ministry of Science, Technology and Innovation).
Disclosures
Authors declare that there are no conflicts of interests.
References
[1] Williams JL. A contribution to the study of pathological enamel. Dent Cosmos 1987; 39, 169, 269, 353, 413.
[2] Applebaum E. Incipient dental caries. J Dent Res 1932; 12: 619.
[3] Darling AI. Studies of the early lesion of enamel caries of transmitted light, polarised
light and radiography. . Br Dent J 1956; 101: 289-297.
[4] Darling AI. Studies of the early lesion of enamel caries. Br. Dent. J 1958; 105: 119–135.
25
[6] Darling AI . The selective attack of caries on the dental enamel. Ann. R. Coll. Surg.
Engl. 1961; 29: 354
–
369.
[7] Robinson C, Shore RC, Brookes SW, Strafford S, Wood SR, Kirkham J. The chemistry
of enamel caries. Crit. Rev. Oral. Biol.Med. 2000; 11: 481
–
495.
[8] Deyhle H, White SN, Bunk O, Beckmann F, Müller B. Nanostructure of the carious
tooth enamel lesion. Acta Biomater 2014; 10: 355-364.
[9] Shellis RP, Dibdin GH: Enamel microporosity and its functional implications; In:
Teaford MF, Smith MM, Ferguson MWJ (eds): Development, Function and Evolution
of Teeth. New York, Cambridge University Press, 2000, 242
–
251.
[10]Houwink B. The limited usefulness of Thoulet’s solution in imbibitions experiment in
dental enamel. Br Dent J 1969; 126: 447-450.
[11] Sousa FB, Vianna SS, Santos-Magalhães NS. Dental enamel birefringence for a wide
mineral content range and for different immersion media's refractive indexes: an
improved mathematical interpretation. J Microsc 2009; 23: 69-75.
[12] Shellis RP, Hallsworth AS, Kirkham J, Robinson C. Organic material and the optical
properties of the dark zone in caries lesions of enamel. Eur. J. Oral Sci 2002; 110: 392
–
395.
[13] Crabb HSM. Enamel caries: observations on the histology and pattern of progress of
the approximal lesion. Br Dent J 1966; 121: 115 Pt 1: 161 Pt 2.
[14] Hallsworth, A.S., Robinson, C. & Weatherell, J.A. (1972) Mineral and magnesium
distribution within the approximal carious lesion of dental enamel. Caries Res. 6, 156
–
168.
[15] Medeiros RCG, Soares JD, Sousa FB. Natural enamel caries in polarized light
26
a quantitative approach to interpret enamel birefringence. Journal of Microscopy 2012;
246(2): 177-189.
[16] Meira K, Brito C, Sousa FB. Natural enamel caries: predicting permeability of the
surface layer. Acta Biomater 2014 (Submitted).
[17] Ismail AI, Sohn W, Tellez M, Amaya A, Sen A, Hasson H et al. The International Caries Detection and Assessment System (ICDAS): an integrated system for measuring dental caries. Community Dent Oral Epidemiol 2007;35:170–8.
[18] Angmar B, Carlstrom D, Glas JE . Studies onthe ultrastructure of dental enamel. IV.
The mineralization of normal human enamel. J. Ultrastruct 1963; 8: 12-23.
[19] Elliott JC. Structure, crystal chemistry and density of enamel apatites. In: Chadwick D, Cardew G (eds). Dental enamel, Ciba Foundation Symposium 205. Chichester; Wiley; 1997. pp. 54–72.
[20] Sousa FB, Vianna SS, Santos-Magalhães NS. A new approach for improving the birefringence analysis of dental enamel mineral content from polarizing microscopy. J Microsc. 2006; 221: 79-83
[21] Barbosa de Sousa F, Dias Soares J, Sampaio Viana S. Natural Enamel Caries: A Comparative Histological Study on Biochemical Volumes. Caries Res. 2013; 47:183–192.
[22] Macena MS, Leite MLA, Gouveia CL, DE Lima TAS, Athayde PA, Sousa FB. A comparative study on component volumes from outer to inner dental enamel in relation to enamel tufts. Arch Oral Biol 2014 (Submitted).
[23] Shirbak M. Complete polarization state generator with one variable retarder and its application for fast and sensitive measuring of two dimensional birefringence distribution. J Opt Soc Am A 2011; 28: 410-419.
27
[25] Gwinnett AJ. The pH of Thoulet's solution for various dilutions with saturated potassiumiodide, Arch Oral. Biol 1965; 10:187-88.
[26] Tas NR, Mela P, Kramer T, Berenschot JW, Van Den Berg A. Capillarity induced negative pressure of water plugs in nanochannels. Nano Lett 2003; 3: 1537–1540.
[27] Stokes AR. The Theory of the Optical Properties of Inhomogeneous Materials. SPON 1963, London.
[28] Shellis RP. Transport processes in enamel and dentine. In: Addy M, Embery G, Edgar WM, Orchardson R, eds. Tooth wear and sensivity. London: Martin Duniz, 2000; 19–24.
28
Captions for figures and videosFig. 1. Typical features of a NEC lesion in all media with the transversal line where histological points were located. A, in water, a positively birefringent (positive
BR
obswater) body of the lesion issurrounded by two negatively birefringent zones (negative
BR
obswater), the surface layer and the inner enamel, respectively. B, in air with Red I filter (red background), the positive body of the lesion with positiveBR
obswater and part of the surface layer became opaque (no birefringence), and29
zone is also located between the isotropic dark zone and isotropic inner enamel. E, microradiography shows radiolucency in the outer part of the NEC lesion. F, microradiography in pseudo-colors, evidence of demineralization in the outer 300 m of dentin adjacent to the lesion. Scale bars = 300 m.Fig. 2. Plots of quantitative component volumes found along the transversal shown in Fig. 1, distributed at the surface layer (1), body of the lesion with positive
BR
obswater(2), dark zone (3), translucent zone (4) and the inner part of the enamel layer (5). Mineral (V1) (A), total water (B),organic (C), permeability (
d) and volume infiltrated by quinoline (
2qui) (D), volume filled by air (air
2
31
Fig. 4. Correlations between candidate predictors (A, mineral volume; B, total water volume; C, organic volume; and D, d) and the proportion of the pore volume infiltrated by quinoline (2 2
/
V
qui
).Fig. 5. A, plot of the proportion of the pore volume infiltrated by quinoline (
2qui/
V
2) and the distance from the enamel surface showing a weak linear inverse correlation. B, plot of the volume infiltrated by quinoline (
2qui) and the distance from enamel surface showing a medium32
Video 1. Real-time 2D mapping (for 1 hour; 21 frames) of the infiltration of quinoline in a NEC lesion. Time interval was of 1 minute between first 11 frames, and 5 minutes between the last 10 ones. The first stages of transport processes after immersion in quinoline are shown. A wave, following prisms paths, comes from the innermost enamel towards outer enamel. The displacement of water fills the body of the lesion from the bottom to the surface layer, also following prisms paths. After that, a new wave appeared, at this time (quinoline) coming from the original enamel surface inward, following prisms paths, but with a lower rate. Infiltration of quinoline occurred only in the area with the highest depth of body of the lesion with positivewater obs