Sustainable Forest Management in Subtropical
Plantation Forests
Xiaohua Wei1, Juan A. Blanco2*
1Department of Earth and Environmental Sciences, University of British Columbia, Kelowna, British Columbia, Canada,2Departmento de Ciencias del Medio Natural, Universidad Pu´blica de Navarra, Pamplona, Navarra, Spain
Abstract
Subtropical planted forests are rapidly expanding. They are traditionally managed for intensive, short-term goals that often lead to long-term yield decline and reduced carbon sequestration capacity. Here we show how it is possible to increase and sustain carbon stored in subtropical forest plantations if management is switched towards more sustainable forestry. We first conducted a literature review to explore possible management factors that contribute to the potentials in ecosystem C in tropical and subtropical plantations. We found that broadleaves plantations have significantly higher ecosystem C than conifer plantations. In addition, ecosystem C increases with plantation age, and reaches a peak with intermediate stand densities of 1500–2500 trees ha21. We then used the FORECAST model to simulate the regional implications of switching
from traditional to sustainable management regimes, using Chinese fir (Cunninghamia lanceolata) plantations in subtropical China as a study case. We randomly simulated 200 traditional short-rotation pure stands and 200 sustainably-managed
mixed Chinese fir – Phoebe bournei plantations, for 120 years. Our results showed that mixed, sustainably-managed
plantations have on average 67.5% more ecosystem C than traditional pure conifer plantations. If all pure plantations were gradually transformed into mixed plantations during the next 10 years, carbon stocks could rise in 2050 by 260.22 TgC in east-central China. Assuming similar differences for temperate and boreal plantations, if sustainable forestry practices were applied to all new forest plantation types in China, stored carbon could increase by 1,482.80 TgC in 2050. Such an increase would be equivalent to a yearly sequestration rate of 40.08 TgC yr21, offsetting 1.9% of China’s annual emissions in 2010.
More importantly, this C increase can be sustained in the long term through the maintenance of higher amounts of soil organic carbon and the production of timber products with longer life spans.
Citation:Wei X, Blanco JA (2014) Significant Increase in Ecosystem C Can Be Achieved with Sustainable Forest Management in Subtropical Plantation Forests. PLoS ONE 9(2): e89688. doi:10.1371/journal.pone.0089688
Editor:Dafeng Hui, Tennessee State University, United States of America
ReceivedNovember 3, 2013;AcceptedJanuary 22, 2014;PublishedFebruary 24, 2014
Copyright:ß2014 Wei, Blanco. This is an open-access article distributed under the terms of the Creative Commons Attribution License, which permits unrestricted use, distribution, and reproduction in any medium, provided the original author and source are credited.
Funding:Funding for this research was provided by: 1) Forest Carbon Counting Method Project (XDA05060101) of the Chinese Academy of Science Strategic and Flagship Program on the Chinese Ecological and Engineering Projects and their Contributions to Carbon; and 2) BC-China Innovation and Commercialization Strategic Development Program (ICSD-2007-Wei-Kimmins). The funders had no role in study design, data collection and analysis, decision to publish, or preparation of the manuscript.
Competing Interests:The authors have declared that no competing interests exist.
* E-mail: [email protected]
Introduction
Reforestation efforts are promoted globally to meet the growing demand of forest products, especially in developing countries. Subtropical forests are therefore promoting the maintenance of forest cover in the region and the production of goods that improve the livelihoods of local communities. Subtropical forests cover 7–10% of the global land area, and store 40–50% of carbon present in terrestrial vegetation [1]. However, subtropical forests also account for most of current deforestation, with accumulated losses in the 1996–2010 period of,100 million ha [2]. Because
forests are a major carbon pool, their management is crucial to develop successful policies for climate change mitigation. Carbon storage versus production of timber and non-timber forest products are seen sometimes as incompatible objectives to be implemented at the same time in a forest, but this view is being challenged [3]. Clarifying if subtropical forest plantations can support multi-objective forestry and estimating how much carbon could be stored in working forest plantations would help to
maximize the outcome of forest management plans while helping to reach a more sustainable development of the subtropical regions.
New planted forests are typically established on sites that have rapid growth and access to processing facilities and growing markets. Hence, very large areas of new forest plantations have been established in subtropical countries, particularly in Latin America and parts of Asia. In spite of such rapid growth, only 3% of the world forest land is covered with productive forest plantations. However, this area expanded by 2 million ha annually in the 1990s and by 2.8 million ha in the 2000s [4].
While much attention and discussion have been devoted on controlling and reverting deforestation, how to enhance forest carbon stocks by improving forest ecosystem condition has received less emphasis until recently [5]. Reforestation has been suggested not only as an effective way to restore degraded ecosystems, but also as a way to mitigate elevated atmospheric CO2, hence contributing towards the reduction of climate change
forest C storage largely remains unexamined [7,8,9]. Recent decisions by the U.N. Framework Convention on Climate Change have encouraged consideration of other ecosystem services while implementing REDD+(Reducing greenhouse gas Emissions from Deforestation and forest Degradation) projects for forest carbon sequestration and storage. Therefore, selecting the most appro-priate approaches for implementing multipurpose forest manage-ment in planted forests is just as important as growing more forests [10]. However, few incentives and policy guidelines are in place to encourage growing better forests globally, perhaps due to the lack of a clear understanding of long-term benefits from growing better forests as well as operational difficulties.
Traditional forest management practices in forest plantations, particularly in developing countries, usually involve application of short rotations, usage of monoculture and exotic species, and high-level removal of biomass, with the main purpose of maximizing short-term economic gains [11]. The ecological problems associ-ated with those traditional forestry practices have been well documented: declines in long-term productivity [12,13], biodiver-sity loss [14], increased susceptibility to insects and diseases [15], physicochemical changes in forest soils [16], and losses of other ecological services [17]. In the context of climate change mitigation, traditional forestry practices may lead to short-term carbon sequestration in wood products, but those gains are unlikely sustainable due to losses in ecosystem C linked to the above-mentioned ecological problems. Sustainable forestry prac-tices, however, could have an important role in mitigating climate
change impacts, if they are well designed and implemented [3]. For example, transformation of conifer monocultures into mixed conifer-broadleaved plantations has been considered as an efficient strategy to sustain forest productivity and restore degraded forests [18].
China has both subtropical and temperate forests, and aggressive reforestation policies have turned it into one of the five most forest-rich countries in the world, accounting for the largest gain in forested areas globally [12,19]. However, most of ecosystems reforested during the past decades in China have been by monocultures dominated by coniferous species. It has been widely reported that timber yield declines and degradation in soil fertility in coniferous plantations over several continuous rotations (see [20], and references therein). On the other hand, in subtropical China, evergreen broadleaved forests are the main native ecosystem type in the region, with a clear potential capacity for carbon sequestration [11]. Among the native species, the broadleafPhoebe bournei(Hemsley) Yang is one of the most valuable tree species in this subtropical region because of its high-quality wood properties, with significant economic and ecological benefits [21]. Sharing the same distribution area, the conifer Chinese fir (Cunninghamia lanceolata (Lamb.) Hook. is the most important commercial forest species in subtropical China. It has been widely planted in the southeast provinces of China [20,22], becoming one of the most abundant planted species in the world [23].
The traditional management of Chinese fir plantations is representative of the type of management usually carried out in
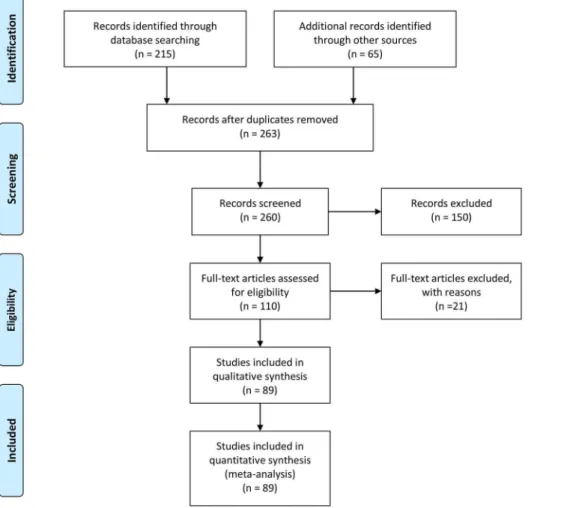
Figure 1. PRISMA flow diagram for the creation of the database of carbon pools in tropical and subtropical forest plantations.
many other tropical and subtropical forest regions around the world. After harvesting and slash-burning the native mixed evergreen broad-leaved forests, pure plantations of fast-growing conifers were established. The plantation sites used to be abandoned after one or two rotations and allowed to regenerate naturally to mixed species stands by stump sprouting and natural seeding, which then acted as a fallow period to restore the site [24]. However, since the 1950s, the plantation area of Chinese fir has been enlarged, and this species has been repeatedly planted on the same sites without intercropping or periods of fallow. Local foresters have generally used a 25-year rotation, with variation from 20 to 30 years depending on soil nutrient abundance [25]. A trend towards rotation length shortening is being observed in the latest years, driven by increasing demand for timber products fueled by economic development and population increase in China. Continuous cultivation of Chinese fir at the same site has resulted in a well-known ecological problem: yield decline over consecutive rotations [20,26]. With these conditionings, an important question has recently been raised in Chinese forestry with implications for the management of forest plantations in other subtropical regions of the world: can forest plantations be managed to produce forest products but in a way that also maintains or even increases ecosystem C? If so, can the differences in ecosystem C between traditional and sustainable management be quantified?
To answer these questions, in this work we tested the hypothesis that subtropical tree plantations accumulate less carbon under traditional exploitative management than under sustainable forest management, which is more similar to natural stand development. We also aim to quantify the potential increase in ecosystem C at a regional level. To test this hypothesis we first reviewed available information on C pools in subtropical forest plantations and related them to factors defining their management (species type, rotation length, stand density). Also, the literature review allowed us to identify the management prescriptions with the highest carbon storage, and to define realistic sustainable management scenarios. Finally, we estimated potential C sequestration gains
through time at a regional level by comparing ecosystem C values under traditional and sustainable management regimes in subtropical plantations in China, simulating plantation growth with the forest ecosystem model FORECAST [27].
Materials and Methods
We first carried out a literature review to test if differences in ecosystem C among subtropical plantation types exist, and also to identify the management factors that have maximized ecosystem C in those plantations in the past. Then, we used ecological modelling to estimate the average differences between traditional forest management and sustainable forest management, with consideration of the factors identified in the literature review. As ecological models need to be calibrated for specific ecosystem types [28], we used Chinese fir plantations (Cunninghamia lanceolata
(Lamb.) Hook.) located in the subtropical region of China as a case study. Continuous repetitions of traditional practices over several rotations (monoculture, short rotations, whole-tree harvesting, and slash burning) have resulted in severe yield decline [26]. Among various possible reasons, N limitation by nutrient exports and resource competition between tree seedlings and understory are the most important factors [20]. Therefore, there is a need to improve the management of this species to establish a more sustainable and multi-purpose forestry in China.
Literature Review of Carbon in Subtropical Plantations
We conducted a structured search of published scientific documents to define the observed range in carbon storage in the ecosystem, as well as in the belowground and aboveground fractions, and their relationships with plantation type (broadleaf or coniferous), plantation age, and stand density. We searched in the on-line databases Google Scholar (by Google Inc. http://scholar. google.com), ISI Web of Knowledge (by Thomson Reuters, http://www.isiwebofknowledge.com), China Academic Journal Database (by China National Knowledge Infrastructure, http:// cnki.en.eastview.com/kns50), CAB Abstracts (by the Centre for Agricultural Bioscience International, http://www.cabdirect.org), and the databases hosted by the Canadian Forest Service Bookstore (http://bookstore.cfs.nrcan.gc.ca), the University of British Columbia’s library (http://www.ubc.ca/library), and the Public University of Navarre’s library (http://www1.unavarra.es/ biblioteca).
We divided the population of collected documents into two groups: 1) documents reporting C pools in broadleaf or other non-coniferous forests, and 2) documents describing non-coniferous or mixed conifer-broadleaf plantations. The final number of docu-ments and sites used for further analysis after a standardized selection process [29] were, for broadleaves 38 documents and 138 sites; whereas for conifers 51 documents and 160 sites (Figure 1; see the full reference list and values of carbon and management variables for each site in Material S1). For each site, we gathered data on plantation age, density, aboveground C density (MgC ha21), belowground C density, and ecosystem C density. Aboveground C was calculated as tree C plus understory C (if reported). Belowground C carbon was calculated as C in tree roots (and in plant roots if reported), litter C and mineral soil C. Values from graphs were extracted using DataThief III [30]. Original values for mineral soil C were often not directly comparable, as they were measured for different soil depths. To standardize soil carbon values, we modified the method by [31] and used bulk density and soil C concentration to calculate and plot soil C content versus soil depth, obtaining a significant correlation between both variables (Figure 2). We then estimated the
Figure 2. Values of soil carbonvs.soil depth in the reviewed literature.
Figure 3. Probability distributions of the four variables defining the management scenarios.Different color linescorrespond to the different site qualities as defined in the top graph. FF: Forest floor removal.
standardized mineral soil carbon content at 60 cm depth as the value that would correspond if soil carbon distribution in each soil followed a relationship with soil depth parallel to the regression line.
We tested the equality of means for aboveground, belowground and ecosystem C between the two types of plantations using Welch’s modifiedt-test, (a robust test that does not assume equality of variances; [32]), setting significance level at 0.05. We also carried out regressions (weighted by the error associated to each measure) of carbon density vs. plantation age and stand density, lumping together data from conifer and broadleaf plantations as initial analysis did not show improvement of the regression results by splitting the data into species groups or location (data not shown). All the statistical analyses where carried out with Sigmaplot 10.0 (Systat Software Inc.), JMP v.5.0.1 (SAS Institute, NC, USA), and S-PLUS 6.1 (Insightful Corp.).
Simulating Ecosystem C in Planted Forests with FORECAST
In the second part of our research, we used the results from the literature review to define probability distributions for the two main factors defining forest plantation management (stand density and rotation length) that maximized ecosystem C, and we assumed that they are indicators of more sustainable forest management. Probability distribution of site quality was defined using the distribution map of site qualities for Chinese fir in south-eastern China [33]. Probability distributions of planting density, rotation length and utilization level for traditional management were also created for both sets of simulations after consultations with panels of local experts composed by academics, forest officers, and forest
managers (Figure 3). The panel of local experts indicated the need for creating different management scenarios based on site quality for sustainable management. Hence, probability distributions of tree density and rotation length were different in each site quality for sustainable management, but they were the same in all sites under traditional management.
Using the probability functions, we constructed 200 Monte Carlo projections for each set of simulations (traditional manage-ment and sustainable forest managemanage-ment). Each run simulated a management scenario (a random combination of site quality, rotation length, and stand density). In traditional management, all trees planted were Chinese fir. In sustainable management, probability distributions show total tree density, which was composed by Chinese fir and Phoebe bournei in a 1:1 ratio, the most suitable species mix for carbon sequestration [21].
We then simulated each scenario for 120 years with the ecosystem model FORECAST, which is a stand-level model specially designed for assessing the effects of various forest management practices on forest carbon storage and sequestration. FORECAST has been successfully tested and applied in many world forests before, including tropical and subtropical forests [28].
FORECAST is a management-oriented, deterministic, non-spatial stand-level forest growth and ecosystem dynamics simulator that operates at annual time steps. The model has been described in detail before [27,28], and therefore only a summary of the main driving function used to calculate tree growth is provided in Material S1. The model uses a mass balance approach to estimate ecosystem nutrient circulation, and how nutrient availability limits tree growth together with available light in the canopy.
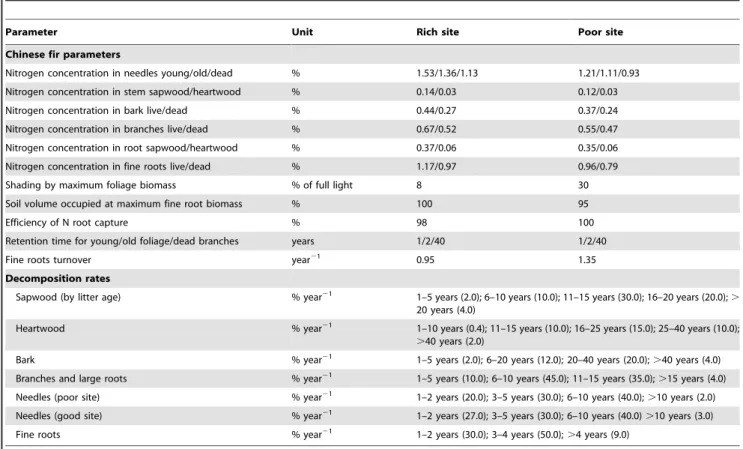
Table 1.Values used to calibrate FORECAST parameters related to Chinese-fir.
Parameter Unit Rich site Poor site
Chinese fir parameters
Nitrogen concentration in needles young/old/dead % 1.53/1.36/1.13 1.21/1.11/0.93
Nitrogen concentration in stem sapwood/heartwood % 0.14/0.03 0.12/0.03
Nitrogen concentration in bark live/dead % 0.44/0.27 0.37/0.24
Nitrogen concentration in branches live/dead % 0.67/0.52 0.55/0.47
Nitrogen concentration in root sapwood/heartwood % 0.37/0.06 0.35/0.06
Nitrogen concentration in fine roots live/dead % 1.17/0.97 0.96/0.79
Shading by maximum foliage biomass % of full light 8 30
Soil volume occupied at maximum fine root biomass % 100 95
Efficiency of N root capture % 98 100
Retention time for young/old foliage/dead branches years 1/2/40 1/2/40
Fine roots turnover year21 0.95 1.35
Decomposition rates
Sapwood (by litter age) % year21 1–5 years (2.0); 6–10 years (10.0); 11–15 years (30.0); 16–20 years (20.0); . 20 years (4.0)
Heartwood % year21 1–10 years (0.4); 11–15 years (10.0); 16–25 years (15.0); 25–40 years (10.0); .40 years (2.0)
Bark % year21 1–5 years (2.0); 6–20 years (12.0); 20–40 years (20.0);
.40 years (4.0)
Branches and large roots % year21 1–5 years (10.0); 6–10 years (45.0); 11–15 years (35.0);
.15 years (4.0)
Needles (poor site) % year21 1–2 years (20.0); 3–5 years (30.0); 6–10 years (40.0);
.10 years (2.0)
Needles (good site) % year21 1–2 years (27.0); 3–5 years (30.0); 6–10 years (40.0)
.10 years (3.0)
Fine roots % year21 1–2 years (30.0); 3–4 years (50.0);
.4 years (9.0)
FORECAST has three application stages: 1) assembling calibra-tion data and generating historical rates of key ecosystem processes; 2) model initialization by establishing the ecosystem condition for the beginning of a simulation run; and 3) simulation of tree and plant growth.
Input data came from sites covering the observed range of Chinese-fir plantation growth, qualitatively described as poor, medium and good (Table 1). The sites were scaled quantitatively as 17, 21 and 27 (from poor to good, based on canopy top height in m at age 50 years) to represent a relative index of tree growth required for extrapolation within the model. Tree data on biomass, mortality, stand density, tree height, canopy height, nutrient concentrations of live tissues and other data were based on reported values for similar Chinese-fir plantations [25,34,35,36,37,38,39,40,41,42,43].
Model calibration data forPhoebe bourneiforests (Table 2) came from literary sources and field data [21]. They included data of biomass accumulation and stand density [44,45,46,47,48,49,50], decomposition rates [51,52,53,54], soil nutrients under different site conditions [55,56,57], and photosynthetic efficiency [58,59,60,61]. Understory was simulated as grass and shrub complexes [20]. Published data were used to characterize shrub biomass, height, tissue nutrient concentrations and other relevant data [62,63,64,65] (Table 3).
Data describing soil processes and nutrient inputs in precipita-tion and slope seepage, mineral soil caprecipita-tion and anion exchange capacities, humus mass, nutrient concentrations in litterfall, litter decomposition rates and others. were derived from literature [38,39,40,66,67,68,69,70,71] (Table 3). To establish initial site conditions the model was run in set-up mode, forcing the model to
match the observed site conditions [72,73]. Initial conditions were created for each site quality, by running several cycles of tree growth ending with stand-replacing windthrow, as typhoons are the most common natural disturbance in this region [74]. A library of initial conditions was created with initial soil organic matter values (humus+litter) ranging from 90.9 to 296.3 Mg ha21for the poorest and richest sites, respectively.
Published field data on several chronosequences at different site qualities were used to evaluate FORECAST performance for Chinese fir andPhoebe bourneiplantations (see Material S1). After obtaining a satisfactory model performance, we run the model for the 400 randomly-generated scenarios described above. A sub-set of documents gathered during the literature review dealing with Chinese fir plantations was also used to evaluate the model performance for ecosystem C.
Results
From our review, 23.9% of the studies on bradleaves used local native species, butPopulusspp. (19.6%),Tectionia sp.(13.1%) and
Eucalyptusspp. (8.10%) were the most common commercial species used. For conifers, 81.4% of the studies reported data from
Cunninghamia sp. plantations, and 14.3% came from Pinus spp. plantations. Our results showed that subtropical broadleaves plantations can, on average, sustain higher carbon densities than subtropical conifer plantations (Figure 4). The differences, however, are mostly caused by differences in belowground C, whereas differences among plantations types in aboveground C are non-significant. Not surprisingly, the trend in subtropical forest plantations is to increase ecosystem carbon storage as plantation age increases. This is basically the result of increase in tree size,
Table 2.Values used to calibrate FORECAST parameters related toPhoebe bournei.
Parameter Unit Rich site Poor site
Chinese fir parameters
Nitrogen concentration in leaves young/old/dead % 1.35/0.92/0.69 1.15/0.80/0.67
Nitrogen concentration in stem sapwood/heartwood % 0.18/0.04 0.16/0.04
Nitrogen concentration in bark live/dead % 0.55/0.47 0.49/0.33
Nitrogen concentration in branches live/dead % 0.33/0.29 0.28/0.26
Nitrogen concentration in root sapwood/heartwood % 0.37/0.29 0.34/0.27
Nitrogen concentration in fine roots live/dead % 0.81/0.57 0.65/0.56
Shading by maximum foliage biomass % of full light 8 25
Soil volume occupied at maximum fine root biomass % 100 100
Efficiency of N root capture % 100 100
Retention time for young/old foliage/dead branches years 1/0.5/30 1/0.5/30
Fine roots turnover year21 1.00 1.15
Decomposition rates
Sapwood (by litter age) % year21 1–3 years (0.1); 4–15 years (2.0); 15–20 years (12.0);
.20 years (9.0)
Heartwood % year21 1–3 years (0.1); 4–15 years (2.0); 15–20 years (12.0); 20–40 years (9.0); . 40 years (2.0)
Bark % year21 1–10 years (20.0); 11–20 years (40.0); 21–30 years (35.0); .30 years (2.0)
Branches and large roots % year21 1–5 years (15.0); 6–15 years (35.0); 16–20 years (45.0);
.20 years (15.0)
Leaves (poor site) % year21 1–2 years (45.0); 3–5 years (35.0);
.6 years (20.0)
Leaves (good site) % year21 1–2 years (50.0); 3–5 years (40.0);
.6 years (20.0)
Fine roots % year21 1–5 years (45.0);
.6 years (35.0)
and accumulation of litter and coarse woody debris biomass. This trend, however, seems to slow down over time, with little expected gains beyond plantation age,90, as described by the significant
exponential model (Figure 5). Ecosystem C initially increases as plantation density increases, reaching a peak at about 1500–2500 stems ha21. For higher densities the trend is to reduce ecosystem C (Figure 5).
During the simulation runs, the most frequent scenario for sustainable forest management was 3000 trees ha21
(1500 Chinese fir, 1500 P. bournei), rotation length of 40 years and stem-only harvesting. For traditional management, the most frequent scenario was 1500 trees ha21
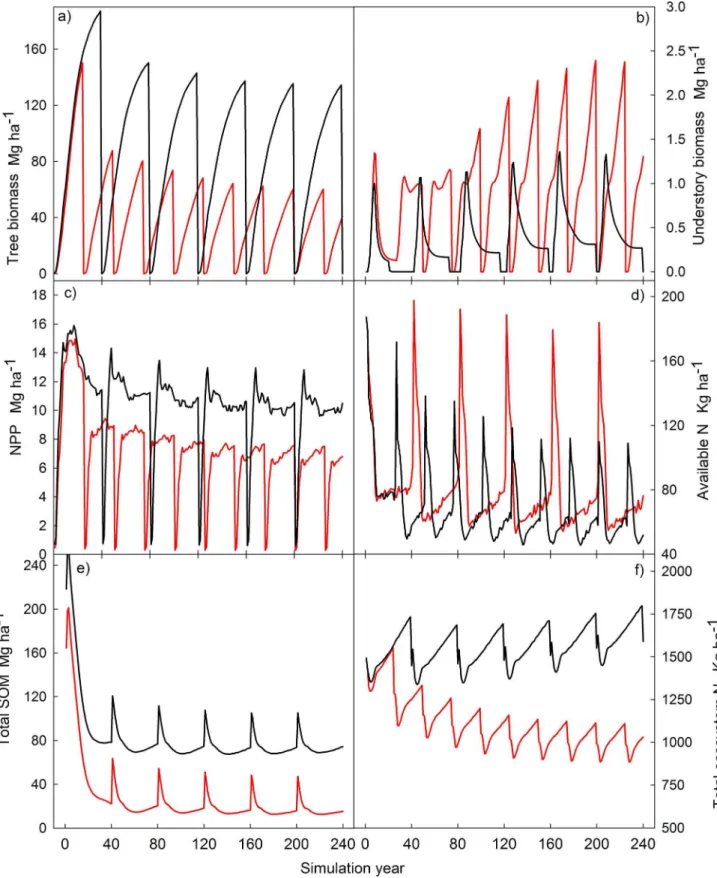
(Chinese fir only), rotation length of 25 years, stem plus slash removal, and site preparation by understory burning. Comparing these two scenarios when run for 240 years, we can see how plantations managed for sustainable, long-term goals, maintain ecosystem productivity higher and during longer periods that traditional intense management.
Yearly net primary productivity under traditional management quickly drops in each consecutive rotation, and as a consequence tree biomass (and the associated merchantable volume) also decreases rapidly over time (Figure 6). In addition, there is an increasingly stronger competition with understory. Although with traditional management higher peaks of available soil N are achieved than in the sustainable management, the total amount of ecosystem N decreases over time. On the other hand, under sustainable management higher levels of soil organic matter are sustained (Figure 6).
When all the inputs and outputs are accumulated through the 240 years of simulation, it is clear how current management is depleting ecosystem N reserves. On the other hand, sustainable management can maintain and even increase N pools (Figure 7). Traditional management removes N from the ecosystems during the site preparation (directly through slash-burning and indirectly
by erosion caused by heavy machinery and losses of plant cover), with the export of harvested products, and by N leaching. Under sustainable forest management, slash-burning is not used and erosion is greatly reduced as practices affecting soil stability and plant cover are minimized. N removal in harvested products is also lower as only stems (with low N concentrations) leave the plantations. On the other hand, as N reserves under sustainable management are higher, leaching losses are also higher, just because the soil N pool is bigger than in traditional management. All flows considered, N outputs with current practices are not only higher, but N inputs are also smaller, as there is less N fixation due to the reduced biological activity in sites of lower productivity. Also, because any given stand gets less N inputs by seepage as it is surrounded by stands that also have lower N capitals.
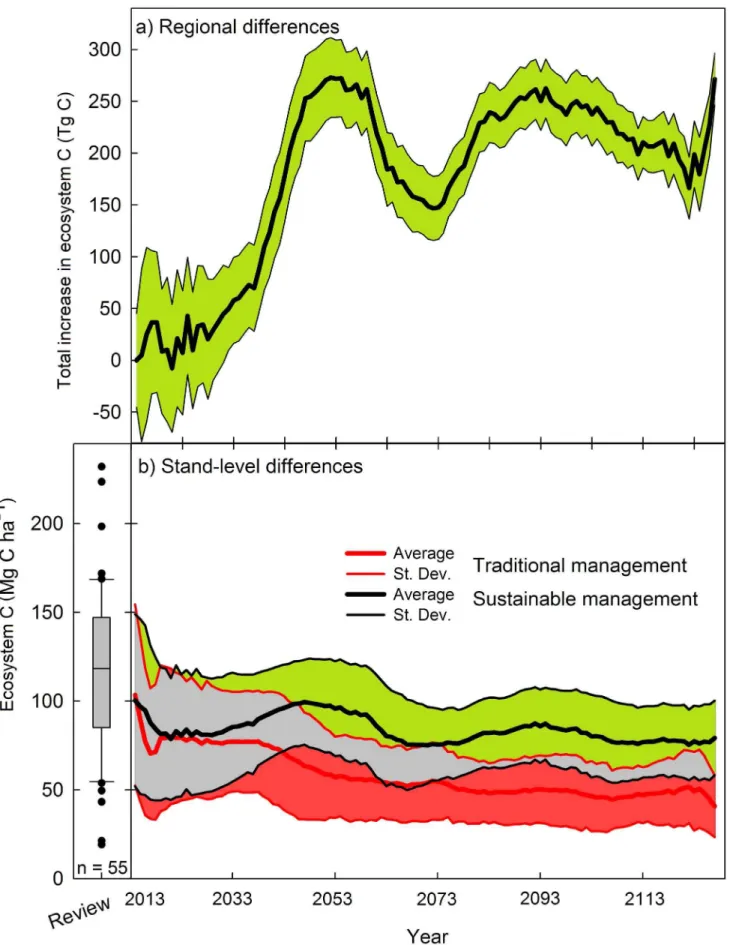
When simulating how the C pools in Chinese fir stands would evolve over the 21st century, our results showed that if sustainable forestry practices were introduced at a rate of 10% of the total planted area, the region would keep on average a higher and sustained level of carbon storage over the long term, compared to traditional management (Figure 8). At the beginning of our scenarios a large overlapping range for ecosystem C between traditional and sustainable plantations can be seen (grey area). Such fact indicates that some time is needed for the sustainable management to significatively reduce C loses compared to traditional management. This is not surprising as productivity losses are accumulative and occur mostly at the change of rotation. However, by the middle and until the end of the simulated 120 years the overlap has been greatly reduced. By that time, only the sites with the highest C contents and managed traditionally would be comparable to the poor sites under sustainable management. Such increase in carbon density could be 12% by 2020. This difference would grow over time, reaching 17%, 52%, 79%, and 67% greater carbon density under sustainable forest management
Table 3.Values used to calibrate FORECAST parameters related to the shrub complex and soil processes.
Shrub complex parameters Unit Rich site Poor site
Nitrogen concentration in leaves live/dead % 1.68/1.38 1.12/0.76
Nitrogen concentration in stems live/dead % 0.48/0.14 0.32/0.10
Nitrogen concentration in rhizomes live/dead % 1.14/1.05 0.76/0.70
Nitrogen concentration in roots live/dead % 1.10/0.84 0.73/0.56
Shading by maximum foliage biomass % of full light 0.20 0.45
Soil volume occupied at maximum fine root biomass % 60 50
Efficiency of N root capture % 99 99
Transfer from live to dead stem/rhizomes/roots % year21 20/20/30 20/20/40
Retention time for foliage years 1 1
Decomposition rates Litter age in years (decomposition rate in %)
Foliage (poor site) % year21 1 year (80.0); 2–3 years (60.0); 4–5 years (50.0);
.5 years (2.0)
Foliage (rich site) % year21 1 year (95.0); 2–3 years (60.0); 4–5 years (50.0);
.5 years (2.0)
Stems & roots % year21 1 year (20.0); 2–3 years (30.0); 4–5 years (40.0);
.5 years (2.0)
Soil parameters Rich site Poor site
Nitrogen concentration in slow/fast humus % 3.00/1.40 3.0/1.40
Decomposition rate slow/fast humus % year21 0.15/2.00 0.15/2.00
CEC soil (CEC humus)/AEC kg N ha21 80.0 (0.2)/20.0 40.0 (0.2)/5.0
Atmospheric deposition/non-symbiotic fixation kg N ha21 year21
4.9/1.0 4.9/1.0
Non-symbiotic N fixation rate Kg N ha21 2.5 3.0
after 25, 50, 75 and 100 years, respectively. The average weighted carbon density increase over the 100-year simulation period was 67.5%.
As a way to validate our estimations at the stand level, when analyzing the average and 95% confidence intervals for the whole set of projected ecosystem C values they were always inside the range of reported values for Chinese-fir plantations (Figure 8), providing confidence on our estimations.
Stand-level differences between management regimes would have large regional implications. Extrapolated to the whole area dedicated to Chinese fir plantations (7,046,520 ha [11]), together with the plan of substituting traditional by sustainable manage-ment implemanage-mented at a ratio of 10% of the land every year, the increase in ecosystem C stored in the mixed Chinese fir plantations could reach 261.2 TgC by 2050 (Figure 8). After that year, the differences in ecosystem carbon storage between management options show a temporal decline. This is as a consequence of the
Figure 4. Distribution of C storage in published bibliography for different subtropical plantation types.The thick horizontal line indicates the average of all observations. Letters indicate significant differences with Welch’statP,0.05. See Material S1 for the complete list of references used.
doi:10.1371/journal.pone.0089688.g004
Figure 5. Carbon stocks in subtropical plantations for different A) rotation ages, and B) stand densities.Black lines indicate the best-fit model, blue lines 95% confidence interval and red lines 95% prediction intervals.
harvesting of sustainable forest plantations primarily clustered around the years 40 to 60. The second rotation growth would
again produce an increase in stored C, which would remain above 200 TgC after 120 years of simulation.
Figure 6. Change in ecological variables in Chinese fir plantations in 240 years of simulation under the average plan two types of management.Current (red line) 25-year rotation, whole-tree harvesting, 1500 trees ha21Chinese fir planted; and close-to-nature management
(black line) 40-year rotations, stem-only harvesting, 1500 trees ha21Chinese fir
Discussion
Subtropical plantations have been described as the most effective for C sequestration [75,76,77]. In subtropical regions, local broadleaved species are usually planted, but the available data on C stocks in subtropical plantations came mostly from the five genuses more widely planted around the globe: Eucalyptus, Populus, Tectonia, Pinus and Cunninghamia. These are the most valuable among the fast-growing species currently used, and our results show that selecting among the species type (broadleaves or conifers) can produce significant differences in C pools depending on plantation type and management regime. Ecosystem C increases with tree age in subtropical plantations, as these systems develop ecological structures that make them closer to natural forests over time [78]. Older plantation age has also been associated to higher soil carbon levels [79]. Therefore, increasing rotation length should be encouraged when implementing sustainable forestry plans for increasing carbon stocks, as well as generating more biophysical structure for higher niche diversity and its associate biodiversity.
[80] have pointed out that density plays an important role in the productivity of mixed stands, with higher productivities in mixed stands than in monocultures at medium to high densities (.1500 trees ha21
). Our results also indicate that density should be maintained at medium values, avoiding excessive inter-tree competition for resources such as light, water and nutrients that could reduce stand productivity, but also avoiding low densities that may leave some resources unused by trees. Our estimates also fit with several field experiments in mixed plantations of Chinese fir with other trees species, which have consistently shown higher biomass and C density in mixed stands with a tree density ratio of 1:1 for Chinese fir/companion species, for total densities in the 2000–3000 trees ha21
range [81,82,83,84].
Our results indicate that managing plantations designed for multiple values could sustain higher carbon storage potentials if they include broadleaves, are managed for rotations lengths of 25– 50 years, and have planting densities of 1500–2500 stems ha21
. Our estimations corroborate previous field research that have reported maximum biomass values in mixed Chinese fir
planta-tions for similar rotation and density ranges, reporting little gain or even biomass decrease with plantation densities above 3000 trees ha21 [82,85]. In this regard, forest plantations seem to have important functional similarities with native forests, where intermediate tree densities have been reported as the ones reaching the carrying capacity of the ecosystem, without surpassing it [86].
Differences in C density among management types can be better understood by comparing the typical (most frequent in our set of simulations) management regimes for traditional and sustainable forest management practices. Depletion in ecosystem N reserves reduces ecosystem productivity, which in turn produces a long-term decrease in tree biomass [87]. This productivity reduction is much more pronounced under traditional practices, as shorter rotation lengths accumulate higher and faster nutrient exports. In addition, short rotations and lower stand densities produce an under-canopy environment with more light available and therefore more suitable for understory growth (Figure 6). In these plantations, understory grass and shrubs usually sprout from rhizomes and other underground structures, rather than from seeds [20]. This phenomenon provides a competitive advantage against planted tree seedlings, which is exacerbated by the advantage of understory’s lower nutrient needs in increasingly nutrient-poor sites as a consequence of intensive organic matter extraction after harvesting [88], slash burning [89], and N leaching [90] (Figure 7).
Reductions in soil organic matter and its associated sources of nutrients, water retention and physical properties would also be more severe under traditional management [16], leading to the already reported yield decline in Chinese fir plantations [26]. On the other hand, our results show that using longer rotations, moderately higher stand densities, and mixing conifers and broadleaves would prevent site productivity decline. With more sustainable management, the ecosystem would maintain and even can increase N reserves by keeping a positive N balance, an indicator of ecological sustainability of forest management in the long-term [26,91].
Theoretical forest ecology indicates that in tree species mixtures, if each species has different growing patterns (differential shade
Figure 7. Accumulated N inputs (solid bars) and outputs (dashed bars) in Chinese subtropical plantations after 240 years of management under two most typical management regimes for traditional and sustainable plantations.
tolerance, physical separation of canopies, phenological differenc-es, successional separation, and differences in soil resource utilization), inter-specific competition may be reduced. Growing evidence indicates a generalized pattern in mixed forests, in which niche separation at both canopy and root levels leads to a more complete use of site resources [80,92,93,94]. This phenomenon has already been reported in mixed tropical plantations [95,96,97]. Therefore, resources in the mixed stand are used more efficiently, hence total stand productivity increases. This phenomenon is due to two facts: complementary resource use between species and facilitative improvement in nutrition in mixtures with a nitrogen-fixing species [93,95,98].
Our results fit with this theoretical background, showing that in Chinese fir plantations, implementing mixtures withPhoebe bournei
will not only increase productivity, but it will also prevent SOM and N losses and their associated yield decline over time. The additional increase in sequestered ecosystem C is another positive effect of species mixtures in these sites. Similar results have also been reported when simulating boreal [99], temperate [73] and tropical [100] forests.
Forest management can greatly affect net C exchange with the atmosphere, not only because it changes ecosystem C pools, but also because the C removed from the ecosystem during harvesting is stored in wood products, such as paper, cardboard, furniture, structural timber, etc. [101]. We have shown that subtropical plantations managed under sustainable forest management can store more ecosystem carbon. However, their net effect on C sequestration depends on forest types, their management regimes, the type of wood products produced, and the efficiency of biomass conversion, as well as assumptions about how the wood and wood residues will substitute for other products with greater GHG emissions and for fossil energy [102].
In Chinese fir plantations under traditional management, most of the production goes to the market as small diameter trunks. Over time, harvested sizes become increasingly smaller as plantation sites lose productivity due to the nutrient losses and competition with understory. However, using a more sustainable forest management, harvesting rates are reduced as it takes more time to complete the harvesting turn, but on the other hand harvested tree sizes are bigger and stay bigger through several rotations. These wood products are expected to reach better prices and last longer because they will be used more as structural timber and high quality furniture [103]. The increased ecosystem C storage, combined with the longer lifespan of higher quality wood products, could compensate the reduced harvesting rates com-pared to traditional management. Although a life-cycle analysis is needed to test this hypothesis, previous work has shown that secondary forests allowed growing rather than being harvested and their wood products stored could result in lower net CO2
emissions [104].
Effects of forest management actions on carbon should be examined for large areas and over long time periods [105]. In the case of China, government’s commitment to increase forest cover by 40 million ha with new plantations may not have an impact on carbon storage as important as intended unless better forest
management is also implemented [106]. In this context, applying a more ecologically-based forestry could make a significant differ-ence. Assuming those new 40 million ha were evenly distributed among all Chinese forest types, there could be 17.55 million ha of new subtropical plantations by 2020 [8]. If the differences between sustainable and traditional forestry were similar to the ones we have estimated for Chinese fir plantations, a more ecologically-based forestry implemented in Chinese subtropical plantations could add 650.8 TgC by 2050.
Previous research on long-term C storage under sustainable forest management regimes in Chinese temperate forests have estimated ecosystem C densities of 600–750 MgC ha21
in poplar (Daiet al. under review), 450–800 MgC ha21
in spruce [107], and 200–325 MgC ha21larch plantations [108]. In all cases, estimates C densities for temperate plantations were higher than our estimates for subtropical plantations. Therefore, it seems reason-able to assume that differences between traditional and sustainreason-able forest management regimes in temperate plantations are at least similar to the ones calculated for subtropical plantations. Under this assumption, C storage in Chinese plantations could potentially be increased by 1,482.8 TgC by 2050. These estimations could even be conservative, as temperate plantations have on average higher levels of ecosystem carbon stocks [109].
In terms of emissions, applying sustainable forestry to all new Chinese plantations could potentially lead to an average net increase in stored C of 0.04 PgC y21
in 2050, equivalent to offsetting 1.91% of China’s annual carbon emissions in 2010 [110]. More importantly, this carbon increase would be sustain-able with opportunities to maintain other ecological services and functions linked to increased biodiversity and less degraded forest soil [3].
In conclusion, our results show that applying a more ecologically-based forestry would have positive impacts not only on long-term plantations productivity, but it can also be a better strategy to implement climate change mitigation programs. Carbon stored in plantations could be further increased if sustainable forestry practices were combined with other practices not examined here, such as genetic improvement of trees, landscape design, etc., although the ecological sustainability of such practices should also be assessed. Finally, socio-economic incentives for farmers to extend rotations and to market non-conifer timber and other products would also be important.
Supporting Information
Material S1 Additional information describing the
FORE-CAST model, its validation for subtropical forests in China, and the list of references used for the review on carbon pools in subtropical planted forests.
(PDF)
Author Contributions
Conceived and designed the experiments: XW JAB. Performed the experiments: JAB. Analyzed the data: XW JAB. Contributed reagents/ materials/analysis tools: XW JAB. Wrote the paper: XW JAB.
represent one standard deviation. The grey area indicates values of ecosystem C that can be achieved by either sustainable or traditional management plans. The box-plot in the bottom-left summarizes the values obtained from a review of 55 published peer-reviewed papers on carbon stocks in Chinese fir plantations (see Material S1 for the complete reference list).
References
1. Lewis SL, Lo´pez-Gonza´lez G, Sonke´ B, Affum-Baffoe K, Baker TR, et al. (2009) Increasing carbon storage in intact African tropical forests. Nature 457: 1003–1007.
2. Food and Agriculture Organization (2012) State of World’s Forests 2012. Rome: Food and Agriculture Organization.
3. Paquette A, Messier C (2010) The role of plantations in managing world’s forests in the Anthropocene. Fron Ecol Environ 8: 27–34.
4. Kirilenko AP, Sedjo RA (2007) Climate change impacts on forestry. PNAS 104, 19697–19702.
5. Rhemtulla JM, Mladenoff DJ, Clayton MK (2009) Historical forest baselines reveal potential for continue carbon sequestration. PNAS 105: 6082–6087. 6. Kimmins JP, Blanco JA, Seely B, Welham C, Scoullar K (2008) Complexity in
Modeling Forest Ecosystems; How Much is Enough? For Ecol Manage 256: 1646–1658.
7. Niu XZ, Duiker SW (2006) Carbon sequestration potential by afforestation of marginal agricultural land in the Midwestern U.S. For Ecol Manage 223: 415– 427.
8. State Forestry Administration People’s Republic of China (2009). People’s Republic of China forestry outlook study. FAO Working Paper No. APFSOS II/WP/2009/11. Bangkok.
9. Chen X, Zhang X, Zhang Y, Wan C (2009) Carbon sequestration potential of the stands under the Grain for Green program in Yunnan Province, China. For Ecol Manage 258: 199–206.
10. Nabuurs GJ et al. (2007) Forestry. In: Metz, B., Davidson, O.R., Bosch, P.R., Dave, R., Meyer, L.A. (eds) Climate Change 2007: Mitigation. Contribution of Working Group III to the Fourth Assessment Report of the Intergovernmental Panel on Climate Change. Cambridge: Cambridge University Press. 11. Wei X, Blanco JA, Jiang H, Kimmins JP (2012) Effects of nitrogen deposition
on carbon sequestration in Chinese fir forests. Sci Tot Environ 416: 351–361. 12. Food and Agriculture Organization (2001) Biological Sustainability of productivity in successive rotations. Report based on the work of J. Evans. Forest Plantation Thematic Papers, Working Paper 2. Forest Resources Development Service, Forest Resources Division. Rome: Food and Agriculture Organization.
13. Carson KM, Curran LM, Asner GP, Pittman AM, Trigg SM, et al. (2013) Carbon emissions from forest conversion by Kalimantan oil palm plantations. Nature Clim Change 3: 283–287.
14. Gibson L, Lee TM, Koh LP, Brook BW, Gardner TA, et al. (2011) Primary forests are irreplaceable for sustaining tropical biodiversity. Nature 478: 378– 381.
15. Jactel H, Brockerhoff EG (2007) Tree diversity reduces herbivory by forest insects. Ecol Let 10: 835–848.
16. Liao C, Luo Y, Fang C, Chen J, Li B (2012) The effects of plantation practice on soil properties based on the comparison between natural and planted forests: a meta-analysis. Global Ecol Biogeogr 21: 318–327.
17. Constanza R, D’arge R, De Groot R, Farber S, Grasso M, et al. (1997) The value of the world’s ecosystem services and natural capital. Nature 387: 253– 260.
18. Lo YH, Lin YC, Blanco JA, Yu CH, Guan BT (2012) Moving from ecological conservation to restoration: an example from central Taiwan, Asia. In: Blanco JA, Lo YH (Eds.) Forest Ecosystems: more than just trees. Rijeka: InTech. 339– 354.
19. Lewis SL (2006) Tropical forests and the changing Earth system. Phil Trans R Soc Lond B 261: 195–210.
20. Bi J, Blanco JA, Kimmins JP, Ding Y, Seely B, et al. (2007) Yield decline in Chinese Fir plantations: A simulation investigation with implications for model complexity. Can J For Res 37: 1615–1630.
21. Wang W, Wei X, Liao W, Blanco JA, Liu Y, et al. (2013) Evaluation of the effects of forest management strategies on carbon sequestration in evergreen broad-leaved (Phoebe bournei) plantation forests using FORECAST ecosystem model. For Ecol Manage 300: 21–32.
22. Lu ZH, Wu G, Ma X, Bai GX (2002) Current situation of Chinese forestry tactics and strategy of sustainable development. J For Res 13: 319–22. 23. Food and Agriculture Organization (2006) Global planted forests thematic
study: results and analysis, by D. Del Lungo, J. Ball, J. Carle. Planted Forests and Trees Working Paper 38. Rome: Food and Agriculture Organization. 24. Yu XT (1997) (Ed.) Silviculture of Chinese Fir. Fuzhou: Science and
Technology Press of Fujian. 250 pp. (in Chinese).
25. Wu ZL (1984) Chinese-fir China Forestry. Beijing: Publishing House. (in Chinese).
26. Tian DL, Xiang WH, Chen XY, Yan WD, Fang X, et al. (2011) A long-term evaluation of biomass production in first and second rotations of Chinese fir plantations at the same site. Forestry 84: 411–418.
27. Kimmins JP, Mailly D, Seely B (1999) Modelling forest ecosystem net primary production: the hybrid simulation approach use in FORECAST. Ecol Model 122: 195–224.
28. Kimmins JP, Blanco JA, Seely B, Welham C, Scoullar K (2010) Forecasting Forest Futures: A Hybrid Modelling Approach to the Assessment of Sustainability of Forest Ecosystems and their Values. London: Earthscan. 218 p.
29. Moher D, Liberati A, Tetzlaff J, Altman DG, The PRISMA Group (2009) Preferred Reporting Items for Systematic Reviews and Meta-Analyses: The PRISMA Statement. PLoS Med 6(6): e1000097. doi:10.1371/jour-nal.pmed1000097.
30. Tummer B (2006) DataThief III v1.6. Available: http://datathief.org. Accessed: 22 October 2013.
31. Guo LB, Gifford M (2002) Soil carbon stocks and land use change: a meta analysis. Global Chan Biol 8: 345–360.
32. Quinn GP, Keough MJ (2002) Experimental design and data analysis for biologist. Cambridge: Cambridge University Press.
33. Yu XT (1999) Chinese fir: In Chinese Forests Forests Editorial Committee (Eds) (China Forestry Publishing House, Beijing) 1–29 (in Chinese). 34. Pan WC, Tian DL, Lei ZX, Kang WX (1983) Studies on the nutrient cycling in
the Chinese-fir plantations: (II) Contents, accumulation rate and biological cycling of nutrient elements in the fast-growing Chinese-fir forest in the hill regions. J Central South For Inst 3: 1–12 (in Chinese).
35. Shao L (1992) Chinese fir. In: Sheng W, Chen B, Xu H, Xu X (Eds) Research on Site Degradation of Timber Plantation. Beijing: Chinese Science & Technology Press. 87–92 (in Chinese).
36. Yang YS, He ZM, Qiu RH, Yu XT, Huang BL (1999) Growth pattern of 29-year-old Chinese-fir grown from seed in different rotations. Sci Silvae Sin 35: 32–36 (in Chinese).
37. Xiao W, Nie D, Zhang J (1999) Study on biomass and energy use efficiency of the stands ofCunninghamia lanceolatain China. For Res 3: 253–258. 38. Liu F, Luo R, Jiang J (1991) Quantities and effects of various phosphorus
compounds in soil under Chinese-fir plantation. J Nanjing For Univ 4: 7–12 (in Chinese).
39. Tian DL, Zhao K (1989) Studies on the litter in a Chinese-fir plantation ecosystem: (I) Amounts, composition and dynamics of litter. J Central South For Inst 9(Sup): 38–43 (in Chinese).
40. Tian DL (1994) Study on bio-geochemistry cycling in Chinese-fir ecosystem. In: Forestry Ministry of China (Ed.) Studies on Forest Ecosystems in China. Harbin: Publishing House of Northeast Forestry Univ. 136–145 (in Chinese). 41. Zhong AL, Hsiung WY (1993) Evaluation and diagnosis of tree nutritional
status in Chinese-fir (Cunninghamia lanceolata(Lamb) Hook) plantations, Jiangxi, China. For Ecol Manage 62: 245–270.
42. Zhou X (1994) Long-Term Research On China’s Forest Ecosystems. Harbin: Northeast Forestry Univ. Press. 320 pp. (in Chinese).
43. Zhou H (1999) Study on productivity of mixed forest planted on site of continuously planted Chinese-fir. J Fujian College For 2: 165–169. (in Chinese). 44. Du J, Lu Y (2009) Study on growth regularity ofPhoebe zhennanplantation.
J Zhejiang For Sci Technol 29: 9–12 (in Chinese).
45. Ma M, Jiang H, Liu Y (2008). Biomass, carbon content, carbon storage and their vertical distribution ofPhoebe bourneiartificial stand. Scien Silv Sin 44: 34– 39 (in Chinese).
46. Peng L (2003) Biomass and productivity in 35 year oldPhoebe bourneiplantation. J Fujian College For 23: 128–131 (in Chinese).
47. Peng L (2008) Preliminary study on the biomass ofPhoebe bourneiplantation with different density and site condition. J Fujian For Sci Technol 35: 15–23 (in Chinese).
48. Wu W (2009) Study on stand structure and growth law of near maturePhoebe bourneiplantation. Develop. For Sci Technol 23: 75–78 (in Chinese). 49. Lu M (2006) Study On Biomass And Nutrient Of Phoebe Bournei Plantation
In Heterogeneity Spatiality Of Density And Site. PhD Thesis. Fujian: Fujian Agriculture and Forestry Univ (in Chinese).
50. Liao H, Di D, Zhang C, et al. (1989) Planting density management to Cinnamoum camphoraandPhoebe bournei. J. Fujian College For. 9: 80–84 (in Chinese).
51. Cheng Y (2003) Study On Litter Fall Decomposing Dynamic And Nutrients Releasing Rule Of Phoebe Bournei. PhD Thesis. Fujian: Fujian Agriculture and Forestry Univ. (in Chinese).
52. Guo Y (2007) Decomposition and the nutrient dynamics ofPhoebe bourneileaf litter. J Fujian College For 27: 199–202 (in Chinese).
53. Lin KM, Zhang ZQ, Cao GQ, He ZM, et al. (2006) Decomposition characteristics and its nutrient dynamics of leaf litter mixtures of both Chinese fir andPhoebe bournei. Acta Ecol Sin 26: 2732–2738 (in Chinese).
54. Lin KM, Zhang ZQ, Ye FM, Lin Y, Li QS. (2010) Dynamic analysis of decomposition characteristics and content change of nutrient elements of leaf litter ofCunninghamia lanceolata, Phoebe bournei and Schima superba under C. lanceolataartificial forest. J Plant Resour Environ 19: 34–39 (in Chinese). 55. Peng L (2008) Study on nutrient elements of Phoebe bournei plantation in the
different site conditions. J Fujian For Sci Tech 35: 10–15 (in Chinese). 56. Chen S (2010) Effect of different site conditions on the growth ofPhoebe bournei.
J. Fujian College For. 30: 157–160 (in Chinese).
57. Liu Q (2009) Study of soil fertility ofPhoebe bourneiplanted forest. J Jiangxi For Sci Technol 1: 31–33 (in Chinese).
59. Hu J, Liu G (2010) Preliminary investigation on photosynthetic characteristics of saplings ofPhoebe zhennanandMachilus leptophylla.J Anhui Agri Univ 37: 541– 546 (in Chinese).
60. Ren CH, Chen H, Zhou LH (1990) Study on L.A.I. (Leaf Area Index) ofPhoebe bourneistand in Youxi county. J Fujian College For 10: 67–71 (in Chinese). 61. Wu Z, Chen S (2004) The effect of light on growth ofPhoebe bourneiplantation.
J Fujian College For 24: 371–373 (in Chinese).
62. Fan X, Ma X, Fu R, Liu A (2001) Comparative study on underground vegetation develop of different generation plantations of Chinese-fir. For Res 14: 11–19 (in Chinese).
63. Lin KM, Yu XT, Hong W, Huang BL (2001) Effect of minor vegetation on soil fertility in Chinese-fir plantation. Scient Silv Sin 37: 94–98 (in Chinese). 64. Xiang WH, Tian DL, Yan WD, Kang WX, Fang X (2003) Biomass and
nutrient content of vegetation on fallow site after clear-cutting of Chinese-fir plantation. Acta Ecol Sin 23: 695–702 (in Chinese).
65. Yan W, Tian D, Jiao X (2003) A study on biomass dynamics and distribution of undervegetation in the secondary generation of Chinese-fir plantation in Hui Tong. For Res 16: 82–86 (in Chinese).
66. Zhou X, Luo R, Ye J (1991) Effect of continuous cropping with Chinese-fir upon soil nutrients and its feedback. J Nanjing For Univ 3: 47–52 (in Chinese). 67. Tian DL, Zhu XP, Cai BY, Gao YM (1989) Studies on the litter in a Chinese-fir plantation ecosystem: (II) Nutrient contents and decomposition rate of litter. J Central South For Inst 9(Sup): 45–55 (in Chinese).
68. Liao LP (2000) Decomposition of leaf litter of Chinese-fir in mixture with major associated broad-leaved plantation species. Acta Phytoecol Sin 24: 27–33 (in Chinese).
69. Ding YX, Tian Y, Qi L (1999) A testing simulation with FORECAST on long-term productivity of Chinese-fir plantations. For Studies China 1: 34–38 (in Chinese).
70. Ding YX, Chen JL (1995) Effect of continuous plantation of Chinese-fir on soil fertility. Pedosphere 5: 57–66.
71. Yang YS, Chen GS, Huang BL (2000) Variation in the soil water and nutrients between different rotation stands of Chinese-fir. J Nanjing For Univ 24: 25–28 (in Chinese).
72. Seely B, Welham C, Kimmins JP (2002) Carbon sequestration in a boreal forest ecosystem: results from the ecosystem simulation model, FORECAST. For Ecol Manage 169: 123–135.
73. Blanco JA, Seely B, Welham C, Kimmins JP, Seebacher TM (2007) Testing the performance of FORECAST, a forest ecosystem model, against 29 years of field data in aPseudotsuga menziesiiplantation. Can J For Res 37: 1808–1820. 74. Guan BT, Wrigth WE, Chung CH, Chang ST (2012a) ENSO and PDO
strongly influence Taiwan spruce height growth. For Ecol Manage 267: 50–57. 75. Masera OR, Garza-Caligaris JF, Kanninen M, Karjalainen T, Liski J, et al. (2003) Modeling carbon sequestration in afforestation, agroforestry and forest management projects: the CO2FIX V.2 approach. Ecol Model 164: 77–199. 76. Cannell MGR (2003) Carbon sequestration and biomass energy offset: Theoretical, potential and achievable capacities globally, in Europe and the UK. Biomass Bioener 24: 97–116.
77. Van Minnen JG, Strngers BJ, Eickhout B, Swart RJ, Leemans R (2008) Quantifying the effectiveness of climate change mitigation through forest plantations and carbon sequestration with an integrated land-use model. Carbon Balance Manage 3: 3.
78. Blanco JA (2012) Forests may need centuries to recover their original productivity after continuous intensive management: an example from Douglas-fir. Sci Total Environ 437: 91–103.
79. Marı´n-Spiotta E, Sharma S (2013) Carbon storage in successional and plantation forest soils: a tropical analysis. Global Ecol Biogeogr 22: 105–117. 80. Amoroso MM, Turnblom MM (2006) Comparing productivity of pure and mixed Douglas-fir and western hemlock plantations in the Pacific Northwest. Can J For Res 36: 1484–1496.
81. Wu Z (2005) Study on growth effect of the mixed forest of Cunninghamia lanceolataandPhoebe bournei.J Fujian College For 25(2): 142–146.
82. Duan W, Zhu B, Lu JL, Lu R, Yang CJ, et al. (2008) Carbon Storage Effects in Artificial Mixed Forest of Cryptomeria fortune - Cunninghamia lanceolata in MontaneAreas of Western Sichuan Province of China. Sichuan Environment 27(5): 57–63 (in Chinese).
83. Zhang G (2009) Growth and biomass in the Chinese fir mixtures. Anhui Agri. Sci. Bull. 15(21): 131–132.
84. Lin T (2011) Mixed Forests ofMichelia macclureiandCunninghamia lanceolatain Coastal Mountains Land of Southern Fujian. Jiangxi Forestry Sci Tech 3: 16– 19.
85. Chen XY (2009) Stand biomass and its distribution of mixed forests ofAlnus crematogyneandCunninghamia lanceolata.Jiangxi Forest Science and Technology 1, 14–17.
86. Keith H, MaKey B, Berry S, Lindenmayer D, Gibbons P (2010) Estimating carbon carrying capacity in natural forest ecosystems across heterogeneous landscapes: addressing sources of error. Glob Change Biol 16: 2971–2989. 87. Berthrong ST, Jobbagy EG, Jackson RB (2009) A global-meta-analysis of soil
exchangeable cation, pH, carbon and nitrogen with afforestation. Ecol Appl 19: 2228–2241.
88. Minghe L, Ritchie GA (1999) Eight hundred years of clonal forestry in China: I. Traditional afforestation with Chinese fir (Cunninghamia lanceolata (Lamb.) Hook.). New For 18: 131–142.
89. Zhang XQ, Kirschbaum MKU, Hou Z, Guo Z (2004) Carbon stock changes in successive rotations of Chinese-fir (Cunninghamia lanceolata (Lamb.) Hook) plantations. For Ecol Manage 202: 131–147.
90. Blanco JA, Wei X, Jiang H, Jie CY, Xin ZH (2012) Impacts of enhanced nitrogen deposition and soil acidification on biomass production and nitrogen leaching in Chinese fir plantations. Can J For Res 42: 437–450.
91. Blanco JA, Zavala MA, Imbert JB, Castillo FJ (2005) Sustainability of forest management practices: Evaluation through a simulation model of nutrient cycling. For Ecol Manage 213: 209–228.
92. Kelty MJ (1992) Comparative productivity of monocultures and mixed-species stands. In: Kelty, M.J., Larson, B.C., Oliver, C.D. (Eds.), The Ecology and Silviculture of Mixed-Species Forests. Kluwer Academic Publishers, Dordrecht, Boston, 125–141.
93. Pretzsch H, Bielak K, Block J, Bruchwald A, Dieler J, et al. (2013) Productivity of mixed versus pure stands of oak (Quercus petraea(Matt.) Liebl. andQuercus robur L.) and European beech (Fagus sylvatica L.) along an ecological gradient. Eur J For Res 132: 263–280.
94. Primicia I, Camarero JJ, Imbert JB, Castillo FJ (2013) Effects of thinning and canopy type on growth dynamics ofPinus sylvestris: inter-annual variations and intra-annual interactions with microclimate. Eur J Forest Res 132: 121–135. 95. Bauhus J, Khanna PK, Menden N (2000) Aboveground and belowground
interactions in mixed plantations ofEucalyptus globulus and Acacia mearnsii. Can J For Res 30: 1886–1894.
96. Erskine PD, Lamb D, Bristow M (2006) Tree species diversity and ecosystem function: Can tropical multi-species plantations generate greater productivity? For Ecol Manage 233: 206–210.
97. Forrester DI, Bauhus J, Cowie AL, Vanclay JK (2006) Mixed-species plantation ofEucalyptuswith nitrogen fixing trees: a review. For Ecol Manage 233: 211– 230.
98. Kelty MJ (2006) The role of species mixtures in plantation forestry. For Ecol Manage 233: 195–204.
99. Seely B, Welham C, Blanco JA (2010) Towards the application of soil organic matter as an indicator of ecosystem productivity: Deriving thresholds, developing monitoring systems, and evaluating practices. Ecol Ind 10: 999– 1008.
100. Blanco JA, Gonza´lez E (2010) Exploring the sustainability of current management prescriptions for Pinus caribaea plantations in Cuba: a modelling approach. J. Trop. For. Sci. 22: 139–154.
101. Fahey TJ, Woodbury PB, Battles JJ, Goodale CL, Hamburg SP, et al. (2010) Forest carbon storage: ecology, management, and policy. Front Ecol Environ 8: 245–252.
102. Eriksson E, Gillespie AR, Gustavsson L, Langvll O, Olsson M, et al. (2007) Integrated carbon analysis of forest management practices and wood substitution. Can J For Res 37: 671–681.
103. Lippke B, Oneil E, Harrison R, Skog K, Gustavsson L, et al. (2011) Life cycle impacts of forest management and wood utilization on carbon mitigation: knowns and unknowns. Carbon Manage 2: 303–333.
104. Perez-Garcia J, Lippke B, Comnick J, Manriquez C (2005) An assessment of carbon pools, storage, and wood products market substitution using life-cycle analysis results. Wood Fiber Sci 37: 140–148.
105. McKinley DC, Ryan MG, Birdsey RA, Giardina CP, Harmon ME, et al. (2011) A synthesis of current knowledge on forests and carbon storage in the United States. Ecol Appl 21: 1902–1924.
106. Liu P, Yin R (2012) Sequestering carbon in China’s forest ecosystems: potential and challenges. Forests 3: 417–430.
107. Jie C, Jiang H, Zhou G, Wei X, Blanco JA, et al. (2011) Simulating the carbon storage of spruce forests based on the FORECAST model and remotely sensed data. Proceedings - 2011 19th International Conference on Geoinformatics, Geoinformatics 2011. Article number 5981581. ISBN: 978–161284848–8. DOI: 10.1109/GeoInformatics.2011.5981581.
108. Qi G (2011) Carbon pool and sequestration potential of larch plantations in Northeast China. PhD thesis. Shenyang: Chinese Academy of Sciences. 109. Keith H, Mackey BG, Lindenmayer DB (2009) Re-evaluation of forest biomass
carbon stocks and lessons from the world’s most carbon-dense forests. PNAS 106: 11635–11640.