www.biogeosciences.net/11/4099/2014/ doi:10.5194/bg-11-4099-2014
© Author(s) 2014. CC Attribution 3.0 License.
Biomass uptake and fire as controls on groundwater solute evolution
on a southeast Australian granite: aboriginal land management
hypothesis
J. F. Dean1,2,*, J. A. Webb1,2, G. E. Jacobsen3, R. Chisari3, and P. E. Dresel4
1Agricultural Sciences Department, La Trobe University, Bundoora, Victoria, Australia 2National Centre for Groundwater Research and Training, Australia
3Institute for Environmental Research, ANSTO, Sydney, Australia
4Department of Environment and Primary Industries, Bendigo, Victoria, Australia *now at: Biological and Environmental Sciences, University of Stirling, Scotland
Correspondence to:J. F. Dean ([email protected])
Received: 18 December 2013 – Published in Biogeosciences Discuss.: 30 January 2014 Revised: 6 June 2014 – Accepted: 22 June 2014 – Published: 4 August 2014
Abstract. The chemical composition of groundwater and surface water is often considered to be dominated by water– rock interactions, particularly weathering; however, it has been increasingly realised that plant uptake can deplete groundwater and surface water of nutrient elements. Here we show, using geochemical mass balance techniques, that water–rock interactions do not control the hydrochemistry at our study site within a granite terrain in southwest Vic-toria, Australia. Instead the chemical species provided by rainfall are depleted by plant biomass uptake and exported, predominantly through fire. Regular landscape burning by Aboriginal land users is hypothesized to have caused the de-pletion of chemical species in groundwater for at least the past 20 000 yr by accelerating the export of elements that would otherwise have been stored within the local biomass. These findings are likely to be applicable to silicate terrains throughout southeast Australia, as well as similar lithological and climatic regions elsewhere in the globe, and contrast with studies of groundwater and surface water chemistry in higher rainfall areas of the Northern Hemisphere, where water–rock interactions are the dominant hydrochemical control.
1 Introduction
The geochemistry of groundwater has been generally consid-ered to be dominated by water–rock interactions (Garrels and Mackenzie, 1967; Moulton et al., 2000; Pogge von Strand-mann et al., 2008; Taylor and Velbel, 1991; Turner et al., 2010; Velbel, 1985; Velbel and Price, 2007; White et al., 2002). However, despite often being in contact with the aquifer rock for long periods of time, groundwater in south-east Australia does not always show strong water–rock in-teraction signatures (e.g. Bennetts et al., 2006; Edwards and Webb, 2009; Raiber et al., 2009).
Furthermore, it has been increasingly recognised that veg-etation can influence the composition of groundwater in two ways. Firstly, through increased weathering rates resulting from low pH micro-environments around the roots, acceler-ating the release of elements from rock and soil minerals and encouraging cation exchange; and secondly, through biomass acting as a nutrient sink, exporting chemical species in or-ganic matter that is removed from the system through flood-ing and fire (Calmels et al., 2011; Cleaves et al., 1970; Ed-wards and Webb, 2009; Feikema et al., 2012; Moulton et al., 2000; Taylor and Velbel, 1991; Velbel and Price, 2007; White et al., 2002).
Ca2+, K+, HCO−
3, Mg2+, and S (macronutrients), Si
Wallace et al., 1979). As a result the infiltrating water can become depleted in these elements, potentially overwriting any water–rock signature in the groundwater and surface wa-ter (Edwards and Webb, 2009). To what extent vegetation re-moves these elements from the system and temporarily locks them up in biomass depends on the vegetation type, whether uptake is consistent year-round, the underlying geology, and the amount of water moving through the system (Moulton et al., 2000; Velbel and Price, 2007).
To assess the relative importance of different processes on the evolution of groundwater and surface water com-position as they travel through a hydrological system, geo-chemical mass balances are commonly used (Bricker et al., 2004; Garrels and Mackenzie, 1967; Locsey et al., 2012; Rasmussen et al., 2011; Velbel and Price, 2007; Wood and Low, 1986). Most geochemical mass balance studies have focused on surface water, looking at the export of chemi-cal species from a system via stream baseflow (e.g. Turner et al., 2010). These present-day (short term) studies look at a snapshot of weathering, extrapolating to consider the broader impacts of silicate weathering on CO2dynamics over longer
timescales (Velbel and Price, 2007). The same mass balance approach can be used to investigate the longer term evolution of groundwater, taking into account the entire chemical evo-lution that has taken place while the water was beneath the surface (Chapelle, 2010; Locsey et al., 2012; Plummer and Back, 1980; Wood and Low, 1986).
Previous studies on the role of plant uptake in ground-water and surface ground-water chemistry are dominated by high rainfall settings in the Northern Hemisphere. In contrast, the present study is in the much drier southeast of Australia where the vegetation was native Eucalypt forest for the rele-vant timescale (up to 20 000 yr BP). This study aims to deter-mine the long term geochemical evolution of groundwater at the study site, and to investigate the role of vegetation uptake within this.
2 Background 2.1 Wider project
This study is part of a larger paired-catchment investigation into the impacts of tree plantations on the quality and quan-tity of groundwater and surface water resources in Victo-ria, Australia (Adelana et al., 2014; Camporese et al., 2013; Dresel et al., 2012). Due to the age of the groundwater (gen-erally 1000–7000 yr old, with a maximum age of ∼20000
yr; see later discussion) it was not possible to use the hydro-chemistry to determine the effect of the tree plantation on the water composition, as the trees were planted in July 2008.
2.2 Study site
The study area is a pair of small, adjacent catchments, 1.33 km2 in total, in southwest Victoria, situated on the
Devonian-aged Dwyer Granite,∼390–395 Ma old (Fig. 1;
Hergt et al., 2007; VandenBerg, 2009). The mineralogy of the Dwyer Granite is dominated by potassium-rich alkali-feldspar, quartz and plagioclase (An18−30, with phenocryst
cores generally ∼An25−30), along with minor biotite,
cal-cic hornblende and accessory phases, the latter including opaque oxides, apatite, allanite, titanite and zircon (Hergt et al., 2007). The upper∼20 m of the granite is well
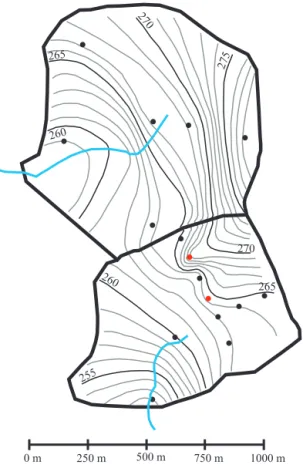
weath-ered, porous and permeable saprolite; below this is relatively fresh, fractured bedrock; together saprolite and bedrock form a single, connected aquifer. The fractured granite aquifer ex-tends no deeper than 150 m, as below this depth the fracture conductivity is negligible due to the high lithostatic pressure (Cook, 2003; Boutt et al., 2010; Dept. Sustainability and En-vironment, 2012). The topography of the site, a series of hills in the middle of a broad valley (Fig. 1), means that both catchments are local ground water systems, and that there are no regional groundwater inputs.
The climate is maritime/temperate, Cfb in the Köppen classification; the average annual rainfall for the area is 672 mm (±125σ), while pan evaporation is 1350 mm
annu-ally, exceeding rainfall for the majority of the year, excepting the winter months of May through September (data from Bu-reau of Meteorology, Hamilton, Australia; Fig. 2). As a result the streams draining the site are dry for most of the year but flow after heavy rain, particularly during winter.
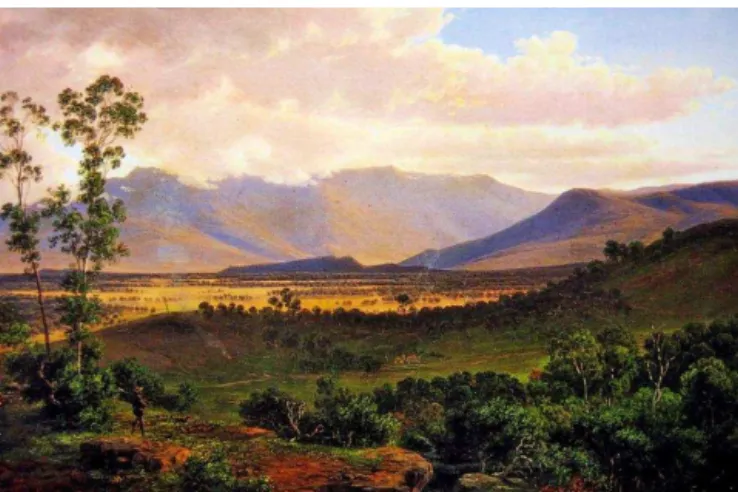
The pre-European vegetation of the area was mostly open Eucalypt woodland (Department of Sustainability and En-vironment, Victoria; Fig. 3). Following European settlement there was extensive land clearance, and the catchments were entirely converted to pasture by 1869 (White et al., 2003); aEucalyptus globulusplantation, planted in July 2008, now
covers the majority of the northern catchment (Fig. 1). Euca-lypt forests are evergreen and transpire and grow throughout the year, but tend to have slower growth and transpiration periods over winter due to decreased sunlight hours.
3 Methods
3.1 Water sampling
Figure 1.Left – Location of the study site in southwestern Victoria, Australia. Right – location of the bores, streams and weirs.
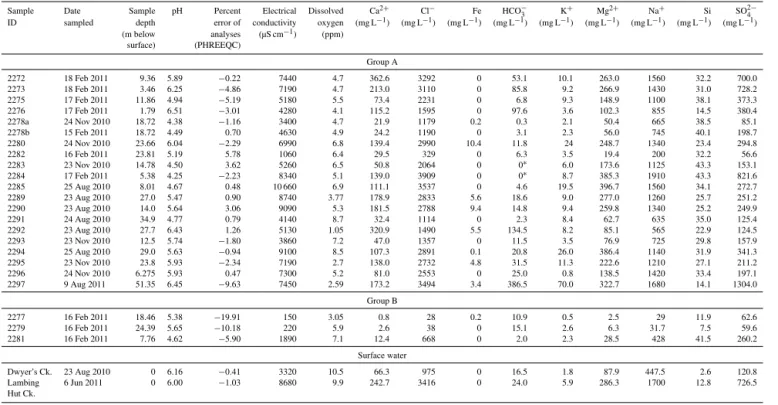
Table 1.Groundwater and surface water sampling details, field parameters and major ion compositions.
Sample Date Sample pH Percent Electrical Dissolved Ca2+ Cl− Fe HCO−
3 K+ Mg2+ Na+ Si SO2−4
ID sampled depth error of conductivity oxygen (mg L−1) (mg L−1) (mg L−1) (mg L−1) (mg L−1) (mg L−1) (mg L−1) (mg L−1) (mg L−1)
(m below analyses (µS cm−1) (ppm)
surface) (PHREEQC)
Group A
2272 18 Feb 2011 9.36 5.89 −0.22 7440 4.7 362.6 3292 0 53.1 10.1 263.0 1560 32.2 700.0 2273 18 Feb 2011 3.46 6.25 −4.86 7190 4.7 213.0 3110 0 85.8 9.2 266.9 1430 31.0 728.2 2275 17 Feb 2011 11.86 4.94 −5.19 5180 5.5 73.4 2231 0 6.8 9.3 148.9 1100 38.1 373.3 2276 17 Feb 2011 1.79 6.51 −3.01 4280 4.1 115.2 1595 0 97.6 3.6 102.3 855 14.5 380.4 2278a 24 Nov 2010 18.72 4.38 −1.16 3400 4.7 21.9 1179 0.2 0.3 2.1 50.4 665 38.5 85.1 2278b 15 Feb 2011 18.72 4.49 0.70 4630 4.9 24.2 1190 0 3.1 2.3 56.0 745 40.1 198.7 2280 24 Nov 2010 23.66 6.04 −2.29 6990 6.8 139.4 2990 10.4 11.8 24 248.7 1340 23.4 294.8 2282 16 Feb 2011 23.81 5.19 5.78 1060 6.4 29.5 329 0 6.3 3.5 19.4 200 32.2 56.6 2283 23 Nov 2010 14.78 4.50 3.62 5260 6.5 50.8 2064 0 0∗ 6.0 173.6 1125 43.3 153.1
2284 17 Feb 2011 5.38 4.25 −2.23 8340 5.1 139.0 3909 0 0∗ 8.7 385.3 1910 43.3 821.6
2285 25 Aug 2010 8.01 4.67 0.48 10 660 6.9 111.1 3537 0 4.6 19.5 396.7 1560 34.1 272.7 2289 23 Aug 2010 27.0 5.47 0.90 8740 3.77 178.9 2833 5.6 18.6 9.0 277.0 1260 25.7 251.2 2290 23 Aug 2010 14.0 5.64 3.06 9090 5.3 181.5 2788 9.4 14.8 9.4 259.8 1340 25.2 249.9 2291 24 Aug 2010 34.9 4.77 0.79 4140 8.7 32.4 1114 0 2.3 8.4 62.7 635 35.0 125.4 2292 23 Aug 2010 27.7 6.43 1.26 5130 1.05 320.9 1490 5.5 134.5 8.2 85.1 565 22.9 124.5 2293 23 Nov 2010 12.5 5.74 −1.80 3860 7.2 47.0 1357 0 11.5 3.5 76.9 725 29.8 157.9 2294 25 Aug 2010 29.0 5.63 −0.94 9100 8.5 107.3 2891 0.1 20.8 26.0 386.4 1140 31.9 341.3 2295 23 Nov 2010 23.8 5.93 −2.34 7190 2.7 138.0 2732 4.8 31.5 11.3 222.6 1210 27.1 211.2 2296 24 Nov 2010 6.275 5.93 0.47 7300 5.2 81.0 2553 0 25.0 0.8 138.5 1420 33.4 197.1 2297 9 Aug 2011 51.35 6.45 −9.63 7450 2.59 173.2 3494 3.4 386.5 70.0 322.7 1680 14.1 1304.0
Group B
2277 16 Feb 2011 18.46 5.38 −19.91 150 3.05 0.8 28 0.2 10.9 0.5 2.5 29 11.9 62.6 2279 16 Feb 2011 24.39 5.65 −10.18 220 5.9 2.6 38 0 15.1 2.6 6.3 31.7 7.5 59.6 2281 16 Feb 2011 7.76 4.62 −5.90 1890 7.1 12.4 668 0 2.0 2.3 28.5 428 41.5 260.2
Surface water
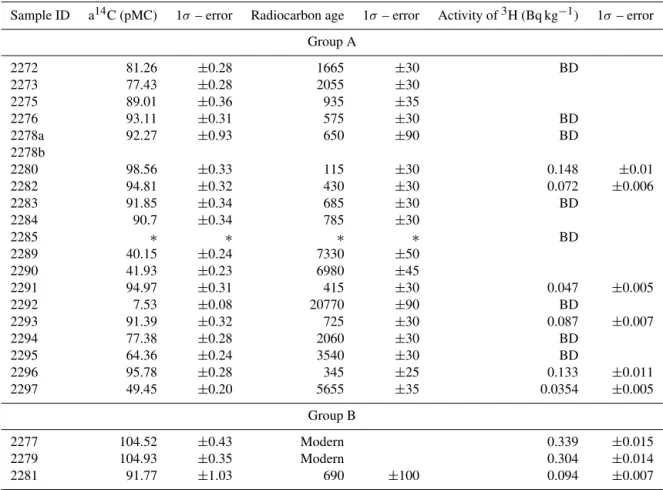
Table 2. Groundwater dates. Samples with14C activity>100 pMC are younger than 1950. Samples with measureable tritium contain
groundwater<50 yr old, in some cases mixed with older groundwater (pMC<100).
Sample ID a14C (pMC) 1σ – error Radiocarbon age 1σ – error Activity of3H (Bq kg−1) 1σ– error
Group A
2272 81.26 ±0.28 1665 ±30 BD
2273 77.43 ±0.28 2055 ±30
2275 89.01 ±0.36 935 ±35
2276 93.11 ±0.31 575 ±30 BD
2278a 92.27 ±0.93 650 ±90 BD
2278b
2280 98.56 ±0.33 115 ±30 0.148 ±0.01
2282 94.81 ±0.32 430 ±30 0.072 ±0.006
2283 91.85 ±0.34 685 ±30 BD
2284 90.7 ±0.34 785 ±30
2285 ∗ ∗ ∗ ∗ BD
2289 40.15 ±0.24 7330 ±50
2290 41.93 ±0.23 6980 ±45
2291 94.97 ±0.31 415 ±30 0.047 ±0.005
2292 7.53 ±0.08 20770 ±90 BD
2293 91.39 ±0.32 725 ±30 0.087 ±0.007
2294 77.38 ±0.28 2060 ±30 BD
2295 64.36 ±0.24 3540 ±30 BD
2296 95.78 ±0.28 345 ±25 0.133 ±0.011
2297 49.45 ±0.20 5655 ±35 0.0354 ±0.005
Group B
2277 104.52 ±0.43 Modern 0.339 ±0.015
2279 104.93 ±0.35 Modern 0.304 ±0.014
2281 91.77 ±1.03 690 ±100 0.094 ±0.007
∗CO
2too low; BD=below detectable limit.
showed no significant compositional changes over this time, which included a shift from drought to wetter conditions. Six other bores (2285, 2289, 2290, 2291, 2292 and 2294) were also sampled twice, 10 months apart for field parame-ters only, and showed no significant change either. Ground-water bores were sampled after first removing three hold-ing volumes to ensure representative water samples were ob-tained (USEPA, 1999). Temperature, pH, dissolved oxygen and electrical conductivity were all measured in the field, at the time of sampling.
The focus of this study is on the long term groundwa-ter evolution, with no intention of reporting a “present-day” weathering mass balance which would require a much higher resolution sampling of the surface water (Velbel and Price, 2007).
3.1.1 Chemical analysis
Sub-samples for cations were filtered through 0.45 µm filter paper and acidified using HNO3. Na+ and K+ were
anal-ysed on a flame photometer, and Ca2+and Mg2+were anal-ysed using atomic absorption spectroscopy. Subsamples for
anions were filtered with 0.45 µm filter paper, but not acid-ified. HCO−
3was manually repeat-titrated to a pH of 4.5
us-ing HCl standardised to NaCO3. Si was analysed using
in-ductively coupled plasma optical emission spectroscopy, Cl− was analysed using ion chromatography, and SO2−
4 was
anal-ysed using both these methods. Each of these analyses was completed at La Trobe University, Melbourne. All charge balance errors were within ±10 %, except for one sample
in Group B (−19 %, most likely due to an underestimation
of Ca2+), which is very dilute (Table 1), and so this level of accuracy is acceptable (Hem, 1985).
3.1.2 14C analysis
Radiocarbon dating was carried out at the Australian Nuclear Science and Technology Organisation (ANSTO) in Sydney, where dissolved inorganic carbon was extracted from the water samples by addition of phosphoric acid and sparging with He. CO2 was collected cryogenically then converted
Table 3.Rainfall composition (mol L−1×10⁵).
Sample ID Ca2+ Cl− HCO−
3 K+ Mg2+ Na+ Si SO24−
Rainfall: Cavendish 1.50 12.0 4.00 0.50 1.50 12.0 ND ND
Rainfall: Hamilton 2.45 12.8 UR 3.09 2.41 10.9 0.08 2.52
Rainfall: Horsham 3.44 9.39 UR 0.64 1.18 9.52 ND 1.55
Median Rainfall 2.45 12.0 4.00 0.64 1.50 10.9 0.08 2.03
ND=not determined; UR=unreliable data.
Figure 2.Average daily rainfall and potential evaporation for the
study region, based on data from 1965–2000, Hamilton, Victoria, Bureau of Meteorology.
measurements normalised against the oxalic acid (HOXI) international standard. For each sample 14C concentration
and/or radiocarbon age was determined after corrections for AMS (Accelerator Mass Spectrometry) machine back-ground, procedural blank and isotopic fractionation using the
δ13C of the graphite which was obtained by analysis using
EA-IRMS (Elemental Analysis – Isotope Ratio Mass Spec-trometry) (Fink et al., 2004). Radiocarbon ages are uncali-brated ages (Table 2). Samples with pMC values>100 are
considered modern, i.e. younger than 1950 (Clark and Fritz, 1997). A correction for dead carbon was not required due to the absence of carbonates in the granite and overlying re-golith (based on XRD (X-Ray Diffraction) analyses), and the limited effects of other processes potentially affecting the
14C activity in this region (Cartwright, 2010).
3.1.3 Tritium analysis
Samples were analysed for tritium at ANSTO by distillation, electrolytic enrichment and finally counting using the liquid scintillation counting technique. Samples with measureable tritium values contain modern groundwater, i.e. recharged in
courtesy of Sotheby’s Australia).
Figure 3.Painting of Victoria Valley prior to land clearance
(Eu-gene vo Guérard, 1866; courtesy of Sotheby’s Australia).
the past 50 yr (Clark and Fritz, 1997). Some of these sam-ples also have pMC<100, indicating that they are mixtures
of older and younger water. Using data from Adelaide, Cape Grim and Melbourne for atmospheric tritium present in rain-fall and the decay curve of tritium (half-life of 12.32 yr), the ages of the modern groundwater components can be esti-mated, e.g. sample 2297 is most likely to have received some recharge in 1960 or earlier (Fig. 4). However, the age of most samples is poorly constrained, e.g. sample 2281 has a much broader age window, from 1975–1995 or during 1960 and earlier (Fig. 4).
3.2 Geochemical mass balance
Geochemical mass balances are a popular method for de-termining the source of solutes in groundwater and surface water, particularly the contribution from weathering (Garrels and Mackenzie, 1967; Velbel and Price, 2007). In a typical geochemical mass balance, the local rainfall composition is subtracted from the groundwater composition, and the re-maining element concentrations present are assigned to pro-cesses taking place within the system, particularly mineral weathering reactions.
0.01 0.1 1 10 100
1955 1960 1965 1970 1975 1980 1985 1990 1995 2000 2005 2010
Ac ti vit y 3H (Bq /kg ) Year Adelaide Melbourne Cape Grim
2277 2279 2280 2296 2281 2293 2282 2291 2297 Group A
Group B
Figure 4.Tritium decay curves for the nine samples with detectable tritium levels (Table 2); each curve is calculated for 50 years of de-cay. The atmospheric tritium values are shown also to indicate pos-sible recharge times; unpublished rainfall data from ANSTO. The precision of the tritium dates varies; sample 2297 was recharged in 1960 or earlier, whereas sample 2281 was recharged from 1975– 1995 or during 1960 and earlier.
of evapotranspiration (Moulton et al., 2000). While this step is commonly omitted in high rainfall, Northern Hemisphere studies of groundwater and surface water composition (Gar-rels and Mackenzie, 1967; Taylor and Velbel, 1991; Velbel and Price, 2007; White et al., 2002), it is important in the southeast Australian setting where groundwater solutes are strongly concentrated by evapotranspiration, which is typi-cally higher than rainfall for much of the year (Fig. 2; Ben-netts et al., 2006; Herczeg et al., 2001). Cl−is assumed to be conservative at the study site over the time period of ground-water recharge (∼20 000 yr), with rainfall the dominant Cl−
source; Cl−/Br−ratios from nearby studies rule out signif-icant input from wind-blown halite deposition (Bennetts et al., 2006; Edwards and Webb, 2009; Raiber et al., 2009).
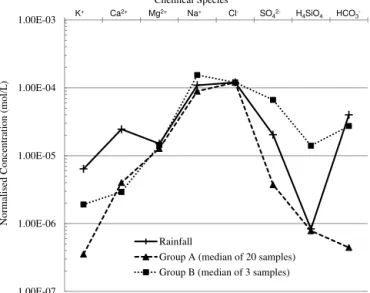
To calculate the mass balance, the local rainfall chemical composition is subtracted from the normalised groundwater and surface water compositions, and the net values remaining can then be used to stoichiometrically balance the expected water–mineral chemical reactions. The groundwater values used in the mass balance are median values of each of the two groups of samples identified in this study (see Sect. 4.1; Fig. 5).
The rainfall composition used in this study was the median local rainfall chemistry from three nearby sites: Cavendish (1954–1955, lacks Si and SO2−
4 data; Hutton and Leslie,
1958), Hamilton (2003–2004, unreliable HCO−
3 data;
Bor-mann, 2004), and Horsham (2007–2009, HCO−
3 by charge
balance only; Nation, 2009) (Table 3; Fig. 1). The median of these three data sets takes into account the natural variabil-ity of rainfall chemistry during different climatic conditions, including wet (1954–1955) and dry (2003–2004 and 2007– 2009) years. For each station, the entire rainfall for each year was collected using a standard rainfall gauge, which by its design (an open funnel) automatically collects both rainfall and dry deposition. Because groundwater in the study area is
1.00E-07 1.00E-06 1.00E-05 1.00E-04 1.00E-03 Rainfall
Group A (median of 20 samples) Group B (median of 3 samples)
K+ Nor malis ed C onc entra ti on (mol/ L ) Chemical Species
Ca2+ Mg2+ Na+ Cl- SO
42- H4SiO4 HCO3-
Figure 5.Schoeller plot of sampled waters normalised to local
rain-fall Cl−(see Sect. 4.2).
up to 20 000 yr old (Table 2), climate variations over this time period will have affected the rainfall composition, which was probably more concentrated during the arid phase at the Last Glacial Maximum (∼20 ka), when there is evidence of dune
mobility in southeastern Australia (e.g. Gardner et al., 2006). However the ion/chloride ratios of rainfall were probably lit-tle changed by the increase in aridity; the distance from the coast, which is the dominant influence on rainfall composi-tion in this area (Hutton, 1976), did not increase significantly during the fall in sea level at the Last Glacial Maximum, as the continental shelf is relatively narrow. Because the mass balance involves normalising the concentrations of all ions in groundwater and surface water to rainfall Cl−, any change in rainfall composition that does not significantly affect the ion/chloride ratios will not alter the results of the mass bal-ance calculations.
3.2.1 Isocon diagram and element mobility
0 10 20 30 40 50 60 70 80
0 10 20 30 40 50 60 70 80 Zr max
Zr min Fe2O3
Al2O3
TiO2
SiO2
MnO
K2O
Na2O MgO GAIN LOSS Zr (ppm) CaO In S it u Gr anit e S apr oli te C ompos it ion (w eig ht % )
Unaltered Granite Composition (weight %)
y = 1.06 x y = 0.84 x
y = 0.77 x
Figure 6.Comparison of element concentrations of the in situ
gran-ite saprolgran-ite (median of 3 analyses) and the unaltered grangran-ite (Hergt et al., 2007) from the study site (determined by X-ray fluorescence (XRF) analysis). Zr (as ppm) is assumed to be immobile and an isocon (Grant, 1986; Webb and Golding, 1998) is defined from the origin through this point. Above this line the granite saprolite is en-riched in that element, below the line it is depleted. Minimum and maximum isocons are defined by the equivalent Zr ratios from both sets of analyses. In order to better show some elements visually on this graph both values were multiplied by 10, 100 or 1000. As these are ratios, so long as both values have the same multiplication ap-plied to them, the result is not affected.
The slope of the isocon defines the mass change during alteration; the relative enrichment or depletion of mobile el-ements can then be calculated from the following equation:
% change in composition= (1)
Cxweathered regolith−A•Cx[fresh rock] A•Cx[fresh rock]
•100,
where A is the slope of the isocon
(Zr[weathered regolith]/Zr[fresh rock]; Zr is the concentration of Zirconium), andCxis the concentration in wt% of element x in either the weathered regolith or the fresh rock (Grant,
1986). The change in composition calculated from Eq. (1) is exactly equivalent to the mass transfer coefficient of Brimhall et al. (1991), and is the negative of the chemical depletion fractions (CDF) as defined by Riebe et al. (2003):
CDFx= (2)
1− Cx
weathered regolith Cx[fresh rock]
Zr[fresh rock]
Zr[weathered regolith] !
.
Those elements that have been lost from the system during the weathering of the fresh rock to regolith can be clearly identified, and are assumed to enrich the groundwater and surface water as they are exported (Garrels and Mackenzie, 1967). In the present study, the isocon was calculated us-ing the composition of the fresh granite taken from Hergt
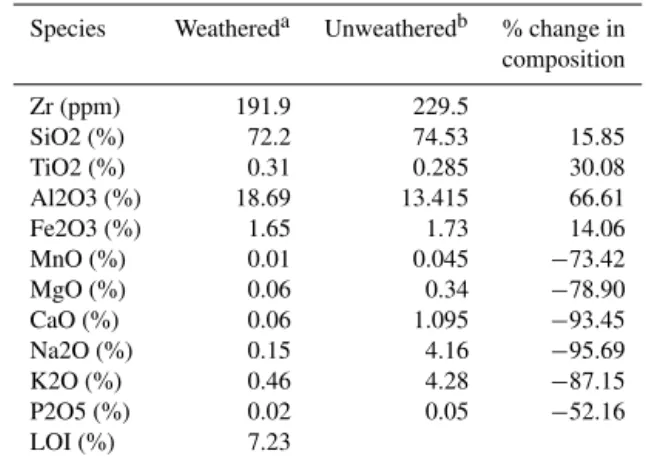
Table 4.Major element (wt%) composition of weathered and unal-tered granite from the study site.
Species Weathereda Unweatheredb % change in composition
Zr (ppm) 191.9 229.5
SiO2 (%) 72.2 74.53 15.85
TiO2 (%) 0.31 0.285 30.08
Al2O3 (%) 18.69 13.415 66.61
Fe2O3 (%) 1.65 1.73 14.06
MnO (%) 0.01 0.045 −73.42
MgO (%) 0.06 0.34 −78.90
CaO (%) 0.06 1.095 −93.45
Na2O (%) 0.15 4.16 −95.69
K2O (%) 0.46 4.28 −87.15
P2O5 (%) 0.02 0.05 −52.16
LOI (%) 7.23
aMedian of three analyses;bfrom Hergt et al. (2007) .
et al. (2007), and the composition of the weathered granite in the overlying regolith obtained from XRF analyses (Table 4; Fig. 6).
3.2.2 X-ray fluorescence (XRF) and X-ray diffraction (XRD)
The bulk chemical composition of weathered granite sam-ples from bore 2281 at depths of 6, 18 and 38 m was determined by XRF using 0.7500±0.0001 g of sample
mixed with 6.7500±0.0001 g of 66:34 lithium
tetrabo-rate : lithium metabotetrabo-rate flux (oven-dried at 400◦C for 2 h) and fused at 1050◦C into a glass button using an auto-mated fusion machine. Glass buttons were analysed using a Siemens SRS 303 AS Wavelength Dispersive XRF spec-trometer. Elements were reported as wt% oxides (Table 4).
XRD analysis was performed on the same samples (dried and milled to ∼60 µm) from 4–70◦ for 90 min, using a
Siemens D5000 X-ray Diffractometer.
4 Results and discussion
4.1 Geochemical mass balance I –
Group A groundwater and surface water samples For the majority of groundwater samples (20), once the rainfall had been subtracted from the normalised concentra-tions, the remaining concentrations of all the major chemical species were negative (Table 5); these samples are termed Group A. These negative values mean that there are no re-maining element concentrations to assign to water–mineral interactions once rainfall inputs have been taken into ac-count, and therefore the mass balance cannot be taken past this step.
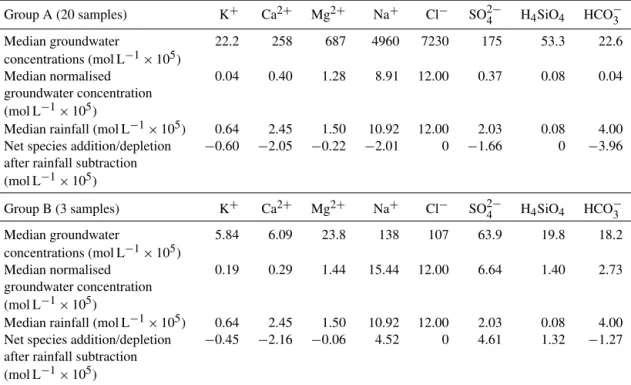
Table 5.Subtraction of rainfall input from groundwater composition.
Group A (20 samples) K+ Ca2+ Mg2+ Na+ Cl− SO2−
4 H4SiO4 HCO−3
Median groundwater 22.2 258 687 4960 7230 175 53.3 22.6
concentrations (mol L−1×10⁵)
Median normalised 0.04 0.40 1.28 8.91 12.00 0.37 0.08 0.04
groundwater concentration
(mol L−1×10⁵)
Median rainfall (mol L−1×10⁵) 0.64 2.45 1.50 10.92 12.00 2.03 0.08 4.00
Net species addition/depletion −0.60 −2.05 −0.22 −2.01 0 −1.66 0 −3.96
after rainfall subtraction
(mol L−1×10⁵)
Group B (3 samples) K+ Ca2+ Mg2+ Na+ Cl− SO2−
4 H4SiO4 HCO−3
Median groundwater 5.84 6.09 23.8 138 107 63.9 19.8 18.2
concentrations (mol L−1×10⁵)
Median normalised 0.19 0.29 1.44 15.44 12.00 6.64 1.40 2.73
groundwater concentration
(mol L−1×10⁵)
Median rainfall (mol L−1×10⁵) 0.64 2.45 1.50 10.92 12.00 2.03 0.08 4.00
Net species addition/depletion −0.45 −2.16 −0.06 4.52 0 4.61 1.32 −1.27
after rainfall subtraction
(mol L−1×10⁵)
Table 6.Subtraction of rainfall input from surface water composition.
K+ Ca2+ Mg2+ Na+ Cl− SO2−
4 H4SiO4 HCO−3
Dwyer’s Ck. composition 4.60 158 346 1950 2760 98.6 4.28 26.2
(mol L−1×10⁵)
Normalised Dwyer’s Ck. 0.02 0.69 1.51 8.47 12.00 0.43 0.02 0.11
composition (mol L−1×10⁵)
Median rainfall (mol L−1×10⁵) 0.64 2.45 1.50 10.92 12.00 2.03 0.08 4.00
Net species addition/depletion −0.62 −1.76 −0.01 −2.45 0 −1.60 −0.06 −3.89
after subtraction of rainfall
(mol L−1×10⁵)
K+ Ca2+ Mg2+ Na+ Cl− SO2−
4 H4SiO4 HCO−3
Lambing Hut Ck. composition 15.0 546 1060 7380 9700 518 21.5 44.3
(mol L−1×10⁵)
Normalised Lambing Hut Ck. 0.02 0.68 1.32 9.13 12.00 0.64 0.03 0.05
composition (mol L−1×10⁵)
Median rainfall (mol L−1×10⁵) 0.64 2.45 1.50 10.92 12.00 2.03 0.08 4.00
Net species addition/depletion −0.62 −1.77 −0.18 −1.79 0 −1.39 −0.05 −3.95
after subtraction of rainfall
(mol L−1×10⁵)
concentrations (Fig. 7a and b). The varying times for ground-water to interact with the aquifer rock have not resulted in an increase in cation concentrations with groundwater age; most of the modern groundwater (containing tritium: 0.035– 0.399 Bqkg−1) shows a similar range of cation depletion to much older samples. There is also no relationship
be-tween groundwater sampling depth and cation concentrations (Fig. 7c).
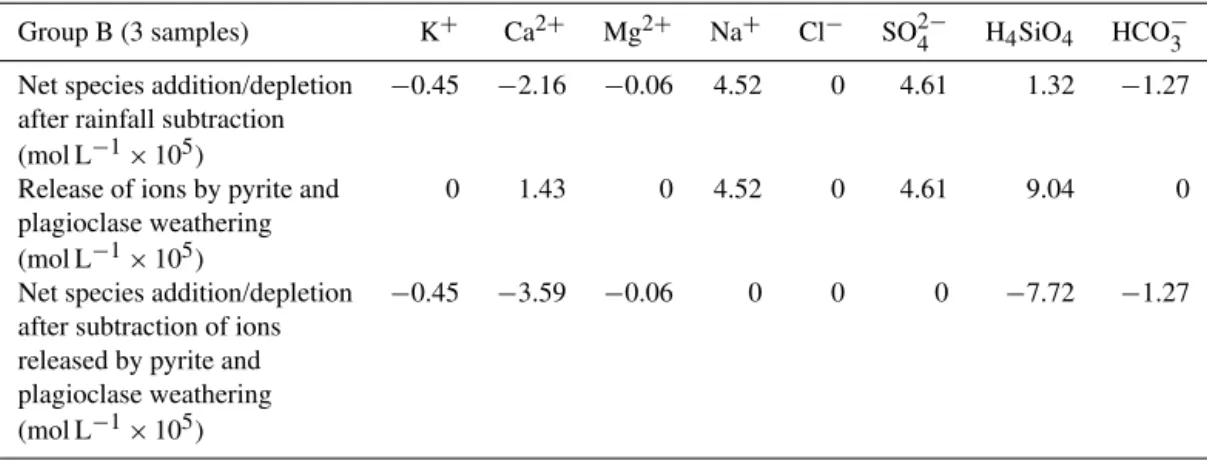
Table 7.Mass balance calculations to show influence of pyrite oxidation and plagioclase weathering on Group B groundwater composition.
Group B (3 samples) K+ Ca2+ Mg2+ Na+ Cl− SO2−
4 H4SiO4 HCO−3
Net species addition/depletion −0.45 −2.16 −0.06 4.52 0 4.61 1.32 −1.27
after rainfall subtraction
(mol L−1×10⁵)
Release of ions by pyrite and 0 1.43 0 4.52 0 4.61 9.04 0
plagioclase weathering
(mol L−1×10⁵)
Net species addition/depletion −0.45 −3.59 −0.06 0 0 0 −7.72 −1.27
after subtraction of ions released by pyrite and plagioclase weathering
(mol L−1×10⁵)
Table 8.Saturation indices for all the groundwater and surface
wa-ter samples used in this study.
Sample ID SI: Calcite SI: Gypsum SI: Aragonite SI: Halite
Group A
2272 −1.80 −0.72 −1.95 −4.00
2273 −1.44 −0.90 −1.59 −4.06
2275 −4.16 −1.49 −4.31 −4.29
2276 −1.26 −1.23 −1.41 −4.53
2278a −5.49 −2.41 −5.64 −4.74
2278b −5.15 −2.05 −5.30 −4.69
2280 −2.65 −1.41 −2.80 −4.09
2282 −4.14 −2.24 −4.29 −5.75
2283 ∗ −2.02 ∗ −4.31
2284 ∗ −1.10 ∗ −3.85
2285 −4.50 −1.60 −4.66 −3.95
2289 −2.96 −1.37 −3.11 −4.13
2290 −2.88 −1.36 −3.03 −4.11
2291 −4.95 −2.09 −5.10 −4.77
2292 −0.79 −1.27 −0.94 −4.73
2293 −3.31 −1.88 −3.46 −4.65
2294 −2.98 −1.49 −3.13 −4.17
2295 −2.31 −1.53 −2.45 −4.17
2296 −2.65 −1.73 −2.80 −4.12
2297 −0.79 −0.80 −0.94 −3.94
Group B
2277 −5.14 −3.51 −5.29 −7.61
2279 −4.15 −3.07 −4.29 −7.47
2281 −5.43 −2.12 −5.58 −5.16
Surface Water
Dwyer’s Ck. −2.61 −1.79 −2.76 −4.97
Lambing Hut Ck. −2.27 −0.85 −2.42 −3.93
∗pH too low for analysis.
for weathering rate estimations as in some other geochemi-cal mass balance studies (e.g. Turner et al., 2010).
4.2 Geochemical mass balance II – Group B groundwater samples For three of the samples, Na+, SO2−
4 and H4SiO4
concen-trations were still positive after subtracting rainfall inputs
(Table 5); these samples are termed Group B. The strong SO2−
4 excess after normalisation and rainfall subtraction
is attributed to pyrite oxidation. Pyrite is present in small amounts in the granite (Atkinson, 1976), but pyrite oxida-tion is evident in only a few of the groundwater samples in this study. This is because pyrite distribution in the granite is very heterogeneous and/or because the resulting SO2−
4
addi-tion is small relative to the effect of evapotranspiraaddi-tion. Acid-ity released by pyrite oxidation (Eq. 3) has attacked plagio-clase in the Dwyer Granite (Eq. 4); biotite and K-feldspar are present in much smaller amounts than plagioclase (Hergt et al., 2007), and so do not contribute significantly to the water composition.
2.31FeS2+8.07O2+2.31H2O (3) =2.31Fe2++4.61SO42−+3.61H+
The plagioclase weathering reaction (Eq. 4) results in the for-mation of kaolinite (the only clay mineral identified in the soil using XRD), and is balanced using the average compo-sition of plagioclase in the Dwyer Granite (An18−30; Hergt et al., 2007) and the excess Na+ levels present in Group B samples (underlined). The H+ released by pyrite oxidation is less than that consumed by plagioclase weathering, indi-cating an additional source of acidity, probably carbonic acid from CO2-rich soil water (Garrels and Mackenzie, 1967):
5.95Na0.76Ca0.24Al1.24Si2.76O8+7.38H++3.69H2O (4) =3.69Al2Si2O5(OH)4+4.52Na+
+1.43Ca2++9.04SiO2.
Once the ions released by these two weathering reactions are accounted for, the Group B samples are depleted in all chem-ical species, preventing the use of additional mineral weath-ering reactions in the mass balance (Table 7).
Two of the Group B samples are modern (tritium concen-trations of 0.304 and 0.339 Bqkg−1; Fig. 7b) and are very
di-lute (150–220 µScm−1; Table 1), showing minimal influence
Table 9.Comparison of plant nutrient requirements with percentage species depletion in groundwater (calculated by dividing median rainfall composition by depletion values for Group A groundwater in Table 5).
Group A (20 samples) K+ Ca2+ Mg2+ SO2−
4 HCO−3 H4SiO4 Na+
Percentage of rainfall 1.9 7.3 4.5 6.0 11.9 0.2 32.5
composition (molar)
Percentage of rainfall input 93.8 83.7 14.7 81.7 99.0 100 18.4
depleted in groundwater
Macro- or micro- nutrient macro macro macro macro macro micro beneficial
(Atwell et al., 1999; Marschner, 1989)
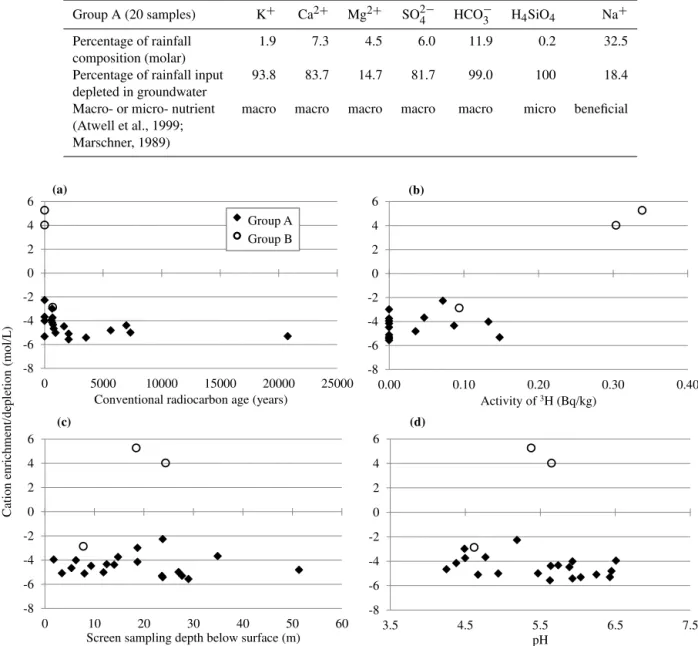
(a) (b)
(c) (d)
-8 -6 -4 -2 0 2 4 6
0 5000 10000 15000 20000 25000
Conventional radiocarbon age (years)
-8 -6 -4 -2 0 2 4 6
0.00 0.10 0.20 0.30 0.40
Activity of 3H (Bq/kg)
-8 -6 -4 -2 0 2 4 6
0 10 20 30 40 50 60
Screen sampling depth below surface (m)
-8 -6 -4 -2 0 2 4 6
3.5 4.5 5.5 6.5 7.5
pH
C
ati
on
enr
ichment
/deple
ti
on
(mol/
L
)
Group A Group B
“modern” –
Figure 7.The cation depletion in the groundwater samples (after subtracting rainfall and rock weathering inputs) shows no clear trend with
age(a, b), sampling depth(c), or pH(d). The zero values in graphs(a)and(b)indicate values outside the range of the respective dating
techniques. A detectable level of tritium indicates that the water is “modern” – recharged in the last∼50 yr (Clark and Fritz, 1997; see
Sect. 3.1.3). Those samples that contained measurable tritium and also sufficient14C to give a radiocarbon date indicate mixing of modern
and older groundwater (Table 2).
rapidly, despite their sampling depths (Fig. 7c), along prefer-ential pathways, most likely open fractures in surface out-crops of the granite. This is clearly visible in the ground-water potentiometric surface from late 2012, where prefer-ential flow paths through these two bores are evident com-pared to the surrounding bores (Fig. 8). They show evidence of pyrite oxidation, probably facilitated by the rapid influx of oxygenated waters, and this reaction releases relatively large amounts of acidity quickly, so it has caused rapid alteration
270
270 260
260
265
255
265
275
0 m 250 m 500 m 750 m 1000 m
Figure 8. Groundwater potentiometric surface map for
Septem-ber 2012. Note the northeast corner of the farm catchment where the fracture flow evident in bores 2279 and 2277 (red dots) exhibit preferential pathways in the equipotential lines. See Fig. 1 for loca-tion.
4.2.1 Predicted groundwater inputs from granite weathering
TiO2, FeO and SiO2 all plot along the Zr isocon,
sug-gesting they have not moved significantly during weather-ing (within the uncertainty due to compositional variations; Fig. 6; Grant, 1986; Webb and Golding, 1998). The small gain in Al is not believed to be significant. CaO, K2O, MgO,
MnO and Na2O are all strongly depleted in the weathered
granite saprolite (by 52–96 %; Table 4). These elements are lost into the groundwater, and so the groundwater should therefore be enriched in these species with respect to rain-fall. However, for the majority of groundwater samples, the geochemical mass balance shows that all species are depleted (Table 5). This has also been observed in a nearby catchment where Ca2+, HCO−
3, K+, Mg2+and Na+are all depleted in
the groundwater (Edwards and Webb, 2009). Even the Group B groundwater samples in this study are enriched in only two species (Na+and SO2−
4 ; Table 7).
4.3 Depletion of chemical species
It is evident that one or more processes overwrite the influ-ence of rock weathering on the hydrochemistry, causing de-pletion of all species in the groundwater. This dede-pletion could be due to mineral precipitation (Adams et al., 2001; Bennetts et al., 2006; Bullen et al., 1996), cation exchange (Adams et al., 2001; Bennetts et al., 2007), or plant uptake (Edwards and Webb, 2009).
Mineral precipitation can cause species depletion, but PHREEQC equilibrium modelling (to determine saturation indices) shows that groundwater and surface water satura-tion indices in the study area for all likely minerals (calcite, gypsum, aragonite and halite), are all strongly negative (Ta-ble 8). XRD analyses of the soil profile in the study area and nearby areas found that none of these or other minerals are present, and only kaolinite is being formed by the weathering process, which is already accounted for in geochemical mass balance II (see Sect. 4.2; Edwards and Webb, 2009).
Cation exchange on clays cannot be causing the deple-tion in the Group A samples because there is no evidence of cation enrichment in the water compositions to balance the removal of the cation which is being substituted (Table 5, Fig. 5); this includes H+as shown by the absence of a rela-tionship between pH and cation depletion (Fig. 7d).
Thus water–rock interactions cannot explain the mass bal-ance results, and the depletion observed here is instead as-cribed to plant uptake. As outlined in the introduction, plants use all of the depleted elements from this study for normal function. This is verified by the amount of each element that is depleted expressed as a percentage of what is delivered in rainfall. The depletion of each element, as a percentage of the total input in rainfall, generally matches the macro-/micro-nutrient demands of plants (Table 9). It is notable that the percentage depletion for Na from rainfall is relatively low, but the actual amount removed is substantial, because Na is the dominant cation supplied in rainfall (Table 3).
Rapid depletion by plant uptake within the soil has been previously documented in southwest Victoria, with most de-pletion occurring within the top 50 cm of the regolith, indi-cating that vegetation is influencing the chemistry of ground-water as it infiltrates through the root zone (Edwards and Webb, 2009). This has also been observed in granitic catch-ments north of the current study site, where groundwater composition was shown to be directly influenced by deple-tion by biomass uptake (Hagerty, 2013).
Bennetts et al., 2006; Edwards and Webb, 2009; Herczeg et al., 2001; Raiber et al., 2009). Evapotranspiration is of lower importance in chemical weathering studies carried out in high rainfall, Northern Hemisphere regions because it is less than rainfall in all these study areas, with rock–water interactions found to be more significant (Einarsson, 1972; Garrels and Mackenzie, 1967; Gislason et al., 1996; Moul-ton et al., 2000; Rasmussen et al., 2011; Taylor and Velbel, 1991; Velbel and Price, 2007; White and Blum, 1995; White et al., 2002). In contrast, water–rock interactions have only localised effects in this study, observed as excess Na+and SO2−
4 due to plagioclase weathering and pyrite oxidation (see
Sect. 4.2), with the vast majority of samples having a sig-nature of element depletion due to the overriding impact of plant uptake.
4.4 Export of chemical species
Depletion of elements in the soil and the groundwater and surface water over the Dwyer Granite indicates that the veg-etation is mining the hydrological system, removing more nutrients than are being introduced through precipitation and rock weathering. As a result, although the saprolite is depleted in mobile elements compared to unweathered bedrock, the groundwater is not enriched but depleted in these species, because plant uptake has removed virtually all the elements supplied to the groundwater by rock weather-ing.
Important nutrient species utilised by the vegetation are recycled; in Eucalypt species like those growing in the study area, leaf litter, bark shedding, and dead wood re-introduce large amounts of nutrient species back into the system (At-tiwill, 1978; Feikema et al., 2012). Continued input through precipitation and rock weathering, together with recycling by vegetation, should result in a buildup of elements in the sys-tem, but there is no evidence of this occurring in the isocon plot (Fig. 6), or the groundwater and surface water mass bal-ance calculations (Tables 5–7), so export of elements must be taking place. The erosion of particulate organic matter is a potential export process, but because of generally low flows in southeast Australian rivers, large scale removal of organic matter occurs only during infrequent flood events and is therefore unlikely to be the major process responsible for export of nutrients from the system (Edwards and Webb, 2009; McMahon et al., 1987).
A much more effective process of nutrient removal is through fire. Burning clears away the forest understory and fallen bark, branches and leaf litter (Atwell et al., 1999; Gammage, 2011). Nutrients are exported within particles of smoke, which are so widely dispersed that the proportion of exported elements returned as dry deposition to any particu-lar area will be minor. Nutrients are also rapidly leached out of the ash remaining on the ground; nutrient pulses in surface water following bush fires are well documented in southeast-ern Australia (Chessman, 1986; Lane et al., 2008), and are
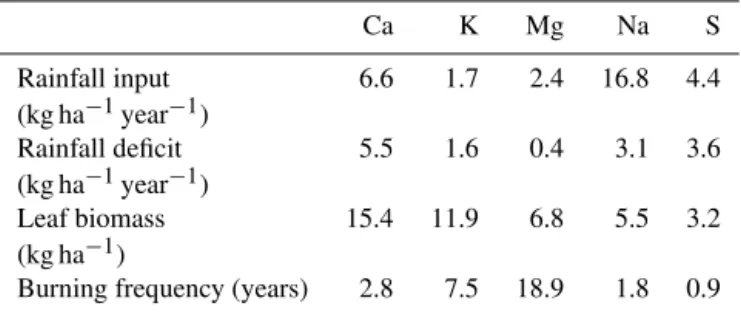
Table 10. Burning frequency required for depletion of common elements in groundwater. Rainfall deficit from Table 5 (Group A
groundwater); leaf biomass values for Eucalyptus camaldulensis
from Briggs and Maher (1983) and Fekeima et al. (2012); see text for explanation.
Ca K Mg Na S
Rainfall input 6.6 1.7 2.4 16.8 4.4
(kg ha−1year−1)
Rainfall deficit 5.5 1.6 0.4 3.1 3.6
(kg ha−1year−1)
Leaf biomass 15.4 11.9 6.8 5.5 3.2
(kg ha−1)
Burning frequency (years) 2.8 7.5 18.9 1.8 0.9
also evident in water quality data from streams around the study site after recent bushfires in the area.
Recharge of the majority of groundwater samples (15) col-lected in this study occurred prior to European settlement, during the Late Pleistocene and Holocene (Fig. 7a). Fire has been a feature of the Australian landscape during this time, as shown by charcoal distribution in sediment cores throughout Australia, and has been attributed to anthropogenic promo-tion of fire across most of Australia for the last∼45 000 yr
(Bowman, 1998; Edney et al., 1990; Head, 1988, 1989; Ker-shaw, 1986; Kershaw et al., 1991; Lynch et al., 2007; Mooney et al., 2011). Controlled fire was used regularly by Aborigi-nal land users in Australia to increase the productivity of the land, burning areas as often as once every 2 to 4 years, to the extent that the pre-European settlement forests were gener-ally very open and mostly devoid of understory (Gammage, 2011). Fire encourages seed release, seed germination and the stimulation of budding and flowering, with many Aus-tralian plant species dependent on fire for seed propagation and fruit production (Bowman, 1998; Gammage, 2011; Gott, 2005). Newly germinated bulbs, seeds and grasses promoted by burning the land can soon attract animals, expose their tracks and increase their visibility for hunting, improving the availability of this food source for Aboriginal land users (At-tiwill et al., 1978; Bowman, 1998).
To calculate the burning frequency that would account for the chemical species depletion observed in the groundwa-ter (Table 10), the quantities in the leaf biomass of Euca-lyptus camaldulensis, a common tree species at the study
site prior to European clearance, were divided by the rain-fall deficit from Table 5. The leaf biomass values were de-rived from the average composition inE. camaldulensis
hy-brids (Fekeima et al., 2012) and the median values of yearly leaf litter (163 000 kg ha−1)in an E. camaldulensisswamp
The calculated fire frequencies (in the order of every 1 to 10 years) are probably too high, as they assume that 100 % of elements stored in the biomass are exported during the fire. Furthermore, these fire frequencies underestimate the biomass lost in fires, because although leaf mass repre-sents the bulk of the tree material removed during fire, other biomass such as bark and smaller limbs are also consumed. Gammage (2011) estimated that Aboriginal burning occurred in landscapes like that of the study area as frequently as ev-ery 2 to 4 years. This broadly matches the calculated fire fre-quencies from Table 10, where, for example, the vegetation foliage would need to be burned every 8 years to account for the observed depletion of K in the groundwater based on average rainfall K compositions.
Many Australian plant species are fire adapted, recover-ing rapidly after fire, especially when competition species are eliminated, as the ash is a rich source of plant nutri-ents (Atwell et al., 1999; Gammage, 2011). Fire was com-mon in southwest Victoria throughout the time that most of the older groundwater samples at the study site were being recharged, providing a strong link between Aboriginal land management practices and groundwater composition.
Hydrochemical studies in higher rainfall, Northern Hemi-sphere areas have not shown a significant influence of plant uptake and nutrient export on the water composition; rock-weathering processes dominate (Garrels and Mackenzie, 1967; Moulton et al., 2000; Taylor and Velbel, 1991; Turner et al., 2010; Velbel and Price, 2007; White et al., 2002). This is due either to reduced uptake by the vegetation species compared to Australian Eucalypts, and/or the lack of large, regular export events. The larger input from rock-weathering is not due solely to greater element availability in rocks freshly exposed by recent glacial processes, as some of the study areas are beyond the limit of the Pleistocene glaciations (Garrels and Mackenzie, 1967; Taylor and Velbel, 1991; Vel-bel and Price, 2007; White et al., 2002).
Some of the groundwater samples in this study (nine in-cluding mixed samples, Fig. 7b) are young enough to have been recharged following European settlement in the area, but show the same depletion pattern as the older samples. Following extensive land clearance in the area after 1869 there has been a decrease in the regularity of bush fires, but the intensity of the fires has increased, and elements con-tinue to be removed from the system through this process. In addition, nutrient species are exported by crop harvesting and grazing (Clymans et al., 2011; Heckman et al., 2003). Thus while modern agriculture is a significantly different land management practice to that of pre-European Aborig-inals, the outcome of nutrient depletion of groundwater in the study area is the same.
5 Conclusions
At the study site a geochemical mass balance was carried out to investigate the role of granite weathering on groundwa-ter and surface wagroundwa-ter geochemical evolution. A small num-ber of samples from this site showed the influence of granite weathering (through pyrite oxidation), but for the majority of the samples, once rainfall inputs were taken into account, all major cations and anions are depleted. Cation exchange and mineral precipitation are ruled out as possible causes for this depletion, with the most likely mechanism being uptake by plant biomass.
Continued uptake of chemical species by vegetation should result in a build-up of these species in the soil and biomass, but in fact the soil is depleted as well, so there must be an export mechanism. For this study site we hypothesise that regular burning by Aboriginal land users was responsible for much of this export, given that the majority of the ground-water samples were recharged before European settlement.
This study has shown that the uptake of species through vegetation growth and removal through fire regimes has a dominating influence on groundwater and surface water chemistry and on geochemical cycling in southeast Australia. These results are likely to be applicable to silicate terrains in similar low precipitation, high transpiration biomes else-where in Australia and globally, and this should be explored further.
Acknowledgements. We would like to acknowledge Phil Cook and
Peter Hekmeijer at the Department of Primary Industries Victo-ria, our collaborators in the National Centre for Groundwater Re-search and Training (of which this reRe-search is part of program 4 – http://www.groundwater.com.au) for funding and support, the Aus-tralian Institute of Nuclear Science and Engineering (AINSE – grant number AINSTU0710) for funding and support, and funding from the State of Victoria through the Department of Environment and Primary Industries, Future Farming Systems Research Division.
We would like to thank Dr Jason Price and all the other anony-mous reviewers involved with this manuscript throughout the re-view process, whose highly constructive feedback have led to the final production of this paper as it is now.
Neither the NCGRT, AINSE nor DEPI Victoria (as funding sources) were involved in the design of this specific study, nor were they involved in the collection or analysis of the resulting data.
Edited by: C. P. Slomp
References
Adams, S., Titus, R., Pieterson, K., Tredoux, G., and Harris, C.: Hy-drochemical characteristics of aquifers near Sutherland, Western Karoo, South Africa, J. Hydrol., 241, 91–109, 2001.
South-Western Victoria, Australia, Hydrol. Process., accepted, 2014.
Atkinson, P. L.: Geology and geochemistry of the Victoria Valley Batholith, Grampians Ranges, South Eastern Australia, Honours Thesis, La Trobe University, Melbourne, Australia, 1976. Attiwill, P. M., Gurthrie, H. B., and Leuning, R.: Nutrient cycling
in aEucalyptus obliqua (L’Hérit) forest, I. Litter production and
nutrient return, Aust. J. Bot., 26, 79–91, 1978.
Atwell, B., Kriedemann, P., and Turnbull, C.: Plants in Action, Macmillan Publishing, Melbourne, 1999.
Bennetts, D. A., Webb, J. A., Stone, D. J. M., and Hill, D. M.: Un-derstanding the salinization process for groundwater in an area of South-Eastern Australia, using hydrochemical and isotopic evi-dence, J. Hydrol., 323, 178–192, 2006.
Bennetts, D. A., Webb, J. A., McCaskill, M., and Zollinger, R.: Dryland salinity processes within the discharge zone of a local groundwater system, Southeastern Australia, Hydrogeol. J., 15, 1197–1210, 2007.
Bormann, M. E.: Temporal and spatial trends in rainwater chemistry across Central and Western Victoria, Honours Thesis, La Trobe University, Melbourne, Australia, 2004.
Boutt, D. F., Diggins, P., and Mabee, S.: A field study (Mas-sachusetts, USA) of the factors controlling the depth of ground-water flow systems in crystalline fractured-rock terrain, Hydro-geol. J., 18, 1839–1854, 2010.
Bowman, D. M. J. S: The impact of Aboriginal landscape burning on the Australia biota, New Phytol., 140, 385–410, 1998. Bricker, O. P., Jones, B. F., and Bowser, C. J.: Mass-balance
ap-proach to interpreting weathering reactions in watershed sys-tems, in: Treatise in Geochemistry, edited by: Holland, H. D. and Turekain, K. K., Elsevier Permagon, Amsterdam, 119–132, 2004.
Briggs, S. V. and Maher, M. T.: Litter fall and leaf decomposition
in a river red gum (Eucalyptus camaldulensis) swamp, Aust. J.
Bot., 31, 307–316, 1983.
Brimhall, G. H., Lewis, C. J., Ford, C., Bratt, J., Taylor, G., and Warin, O.: Quantitative geochemical approach to pedogenesis: importance of parent material reduction, volumetric expansion, and eolian influx in lateritization, Geoderma, 51, 51–91, 1991. Bullen, T. D., Krabbenhoft, D. P., and Kendall, C.: Kinetic and
min-eralogic controls of groundwater chemistry and 87Sr/86Sr in a
sandy silicate aquifer, Northern Wisconsin, USA, Geochim. Cos-mochim. Ac., 60, 1807–1821, 1996.
Calmels, D., Galy, A., Hovius, N., Bickle, M., West, A. J., Chen, M.-C., and Chapman, H.: contribution of deep groundwater to the weathering budget in a rapidly eroding mountain belt, Taiwan., Earth Planet. Sc. Lett., 303, 48–58, 2011.
Camporese, M., Dean, J. F., Dresel, P. E., Webb, J., and Daly, E.: Hydrological modelling of paired catchments with competing land uses, Proceedings of the 20th International Congress on Modelling and Simulation, Adelaide, Australia, 1–6 December, 1819–1825, 2013.
Cartwright, I.: Using groundwater geochemistry and
environmen-tal isotopes to assess the correction of 14C ages in a
silicate-dominated aquifer system, J. Hydrol., 382, 174–187, 2010. Chapelle, F. H.: Geochemistry of groundwater, in: Readings from
the Treatise on Geochemistry, edited by: Holland, H. D. and Turekian, K. K., Elsevier, Amsterdam, 289–315, 2010.
Chessman, B. C.: Impact of wildfires on river water quality in East Gippsland, Victoria, Aus. J. Mar. Fresh. Res., 37, 399–420, 1986. Clark, I. D. and Fritz, P.: Environmental Isotopes in Hydrogeology,
Taylor and Francis Group, New York, 1997.
Cleaves, E. T., Godfrey, A. E., and Bricker, O. P.: Geochemical bal-ance of a small watershed and its geomorphic implications, Geol. Soc. Am. Bull., 81, 3015–3032, 1970.
Clymans, W., Struyf, E., Govers, G., Vandevenne, F., and Conley, D. J.: Anthropogenic impact on amorphous silica pools in temper-ate soils, Biogeosciences, 8, 2281–2293, doi:10.5194/bg-8-2281-2011, 2011.
Cook, P. G.: A Guide to Regional Groundwater Flow in Fractured Rock Aquifers, CSIRO Land and Water, Adelaide, SA, 2003. Dept. Sustainability and Environment: Groundwater SAFE: Secure
Allocations, Future Entitlements, Victorian Gov. Dept. of Sus-tainability and Environment, Melbourne, 2012.
Dresel, P. E., Hekmeijer, P., Dean, J. F., Harvey, W., Webb, J. A., and Cook, P.: Use of laserscan technology to analyse topography and flow in a weir pool, Hydrol. Earth Syst. Sci., 16, 2703–2708, doi:10.5194/hess-16-2703-2012, 2012.
Edney, P. A., Kershaw, A. P., and De Deckker, P.: A Late Pleis-tocene and Holocene vegetation and environmental record from Lake Wangoom, western plains of Victoria, Australia, Palaeo-geogr. Palaeocl., 80, 325–343, 1990.
Edwards, M. and Webb, J.: The importance of unsaturated zone bio-geochemical processes in determining groundwater composition, Southeastern Australia, Hydrogeol. J., 17, 1359–1374, 2009. Einarsson, M. A.: Evaporation and Potential Evapotranspiration in
Iceland, Icelandic Meterological Office, Reykjavik, 1972. Feikema, P. M., Sasse, J. M., and Bandara, G. D.: Chloride content
and biomass partitioning inEucalyptus hybrids grown on saline
sites, New Forest, 43, 89–107, 2012.
Fink, D., Hotchkis, M., Hua, Q., Jacobsen, G., Smith, A. M., Zoppi, U., Child, D., Mifsud, C., van der Gaast, H., Williams, A., and Williams, M.: The ANTARES AMS facility at ANSTO, NIM B, 223/224, 109–115, 2004.
Gammage, B.: The Biggest Estate on Earth, Allen and Unwin, Syd-ney, Australia, 2011.
Gardner, T. W., Webb, J. A., Davis, A. G., Cassell, E. J., Pezzia, C., Merritts, D. J. and Smith, B.: Late Pleistocene landscape response to climate change: eolian and alluvial fan deposition, southeastern Victoria, Australia. Quaternary Sci. Rev., 25, 1552– 1569, 2006.
Garrels, R. M. and Mackenzie, F. T.: Origin of the chemical compo-sitions of some springs and lakes. Equilibrium concepts in natu-ral water systems, Adv. Chem. Ser., 67, 222–242, 1967. Gislason, S. R., Arnórsson, S., and Ármannsson, H.: Chemical
weathering of basalt in Southwest Iceland: effects of runoff, age of rocks and vegetative/glacial cover, Am. J. Sci., 296, 837–907, 1996.
Gott, B.: Aboriginal fire management in South-Eastern Australia: aims and frequency, J. Biogeogr., 32, 1203–1208, 2005. Grant, J. A.: The isocon diagram – a simple solution to Gresens’
equation for metasomatic alteration, Econ. Geol., 81, 1976– 1982, 1986.
Head, L.: Holocene vegetation and environmental history of the Discovery Bay region, South-Western Victoria, Aust. J. Ecol., 13, 21–49, 1988.
Head, L.: Prehistoric Aboriginal impacts on Australian vegetation: an assessment of the evidence, Aust. Geogr., 20, 37-46, 1989. Heckman, J. R., Sims, J. T., Beegle, D. B., Coale, F. J., Herbert, S.
J., Bruulsema, T. W., and Bamka, W. J.: Nutrient removal by corn grain harvest, Agron. J., 95, 587–591, 2003.
Hem, J. D.: Study and Interpretation of the Chemical Characteris-tics of Natural Water, US Geological Survey Water-Supply Paper 2254, 1985.
Herczeg, A. L., Dogramcai, S. S., and Leaney, F. W. J.: Origin of dissolved salts in a large, semi-arid groundwater system: murray basin, Australia, Mar. Freshwater Res., 52, 41–52, 2001. Hergt, J., Woodhead, J., and Schofield, A.: A-type magmatism in
the Western Lachlan Fold Belt? A study of granites and rhyolites from the Grampians region, Western Victoria, Lithos, 97, 122– 139, 2007.
Hua, Q., Jacobsen, G. E., Zoppi, U., Lawson, E. M., Williams, A. A., Smith, A. M., and Mc-Mann, M. J.: Progress in radiocarbon target preparation at the ANTARES AMS Centre, Radiocarbon, 43, 275–282, 2001.
Hutton, J. T.: Chloride in rainwater in relation to distance from ocean. Search, 7, 207–208, 1976.
Hutton, J. T. and Leslie, T. I.: Accession of non-nitrogenous ions dissolved in rainwater to soils in Victoria, Aust. J. Agr. Res. 9, 59–84, 1958.
Kershaw, A. P.: Climatic change and Aboriginal burning in North-East Australia during the last two glacial/interglacial cycles, Na-ture, 322, 47-49, 1986.
Kershaw, A. P., D’Costa, D. M., McEwen Mason, J. R. C., and Wagstaff, B. E.: Palynological evidence for Quaternary vegeta-tion and environments of mainland Southeastern Australia, Qua-ternary Sci. Rev., 10, 391–404, 1991.
Lane, P. N. J., Sheridan, G. J., Noske, P. J., and Sherwin, C. B.: Phosphorus and nitrogen exports from SE Australian forests fol-lowing wildfire, J. Hydrol., 361, 186–198, 2008.
Locsey, K. L., Grigorescu, M., and Cox, M. E.: Water-rock inter-actions: an investigation of the relationships between mineralogy and groundwater composition and flow in a subtropical basalt aquifer, Aquat. Geochem., 18, 45–75, 2012.
Lynch, A. H., Beringer, J., Kershaw, P., Marshall, A., Mooney, S., Tapper, N., Turney, C., and Van Der Kaars, S.: Using the pa-leorecord to evaluate climate and fire interactions in Australia, Annu. Rev. Earth Planet. Sci., 35, 215–239, 2007.
Marschner, H.: Mineral Nutrition of Higher Plants, Academic Press Ltd., San Diego, CA, 1989.
McMahon, T. A., Finlayson, B. L., Haines, A., and Srikanthan, R.: Runoff variability: a global perspective, in: The influence of cli-mate change and climatic variability on the hydrologic regime and water resources, edited by: Solomon, S. I., Beran, M., and Hogg, W., IAHS Publication No. 168, 3–11, 1987.
Mooney, S. D., Harrison, S. P., Bartlein, P. J., Daniau, A.-L., Stevenson, J., Brownlie, K. C., Buckman, S., Cupper, M., Luly, J., Black, M., Colhoun, E., D’Costa, D., Dodson, J., Haberle, S., Hope, G. S., Kershaw, P., Kenyon, C., McKenzie, M., and Williams, N.: Late Quaternary fire regimes of Australasia, Qua-ternary Sci. Rev., 30, 28–46, 2011.
Moulton, K. L., West, J., and Berner, R.: Solute flux and mineral mass balance approaches to the quantification of plant effects on silicate weathering, Am. J. Sci., 300, 539–570, 2000.
Nation, E.: Groundwater Recharge for Agriculture: Rainfall Chem-istry Report, Bureau of Rural Sciences, Canberra, 2009. Plummer, I. N. and Back, W.: The mass balance approach:
applica-tion to interpreting the chemical evoluapplica-tion of hydrological sys-tems, Am. J. Sci., 280, 130–142, 1980.
Pogge von Strandmann, P. A. E., Burton, K.W., James, R. H., van Calsteren, P., Gislason, S. R., and Sigfússon, B.: The influence of weathering processes on riverine magnesium isotopes in a basaltic terrain, Earth Planet. Sc. Lett., 276, 187–197, 2008. Raiber, M., Webb, J. A., and Bennetts, D. A.: Strontium isotopes
as tracers to delineate aquifer interactions and the influence of rainfall in the basalt plains of Southeastern Australia, J. Hydrol., 367, 188–199, 2009.
Rasmussen, C., Brantley, S., Richter, D., Blum, A., Dixon, J., and White, A. F.: Strong climate and tectonic control on plagioclase weathering in a granitic terrain, Earth Planet. Sc. Lett., 301, 521– 530, 2011.
Riebe, C. S., Kirchner, J. W., and Finkel, R. C.: Long-term rates of chemical weathering and physical erosion from cosmogenic nuclides and geochemical mass balance, Geochim. Cosmochim. Ac., 67, 4411–4427, 2003.
Taylor, A. B. and Velbel, M. A.: Geochemical mass balances and weathering rates in forested watersheds of the Southern Blue Ridge II. Effects of botanical uptake terms, Geoderma, 51, 29– 50, 1991.
Turner, B. F., White, A. F., and Brantley, S. L.: Effects of tempera-ture on silicate weathering: Solute fluxes and chemical weather-ing in a temperate rain forest watershed, Jamieson Creek, British Columbia, Chem. Geol., 269, 62–78, 2010.
Ugolini, F. C., Minden, R., Dawson, H., and Zachara, J.: An
ex-ample of soil processes in theAbies amabiliszone of Central
Cascades, Washington, Soil Sci., 124, 291–302, 1977.
USEPA: Compendium of ERT Groundwater Sampling Procedures, United States Environmental Protection Agency, Washington, DC, 1999.
VandenBerg, A. H. M.: Rock Unit Names in Western Victoria, Seamless Geology Project, Geological Survey of Victoria Re-port, Geoscience Victoria, 130 pp., 2009.
Velbel, M. A.: Geochemical mass balances and weathering rates in forested watersheds of the Southern Blue Ridge, Am. J. Sci., 285, 904–930, 1985.
Velbel, M. A. and Price, J. R.: Solute geochemical mass-balances and mineral weathering rates in small watersheds: methodol-ogy, recent advances, and future directions, Appl. Geochem., 22, 1682–1700, 2007.
Wallace, A., Mueller, R. T., Wood, R. A., and Soufi, A. M.: Plant
uptake of bicarbonate as measured with the11C isotope, Plant
Soil, 51, 431–435, 1979.
Webb, J. A. and Golding, S. D.: Geochemical mass-balance and oxygen-isotope constraints on silcrete formation and its paleocli-matic implications in Southern Australia, J. Sediment Res., 68, 981–993, 1998.
White, A. F., Blum, A. E., Schulz, M. S., Huntington, T. G., Peters, N. E., and Stonestrom, D. A.: Chemical weathering of the Panola Granite: solute and regolith elemental fluxes and the weathering rate of biotite, Geo. Soc. S. P., 7, 37–59, 2002.
White, M., Oates, A., Barlow, T., Pelikan, M., Brown, J., Rosen-gren, N., Cheal, D., Sinclair, S., and Stutter, G.: The Vegetation of North-West Victoria, Department of Sustainability and Envi-ronment, Melbourne, Australia, 2003.