www.earth-syst-dynam.net/3/189/2012/ doi:10.5194/esd-3-189-2012
© Author(s) 2012. CC Attribution 3.0 License.
Earth System
Dynamics
Enhanced Atlantic subpolar gyre variability through baroclinic
threshold in a coarse resolution model
M. Mengel1,2, A. Levermann1,2, C.-F. Schleussner1,2, and A. Born3,4
1Potsdam Institute for Climate Impact Research, Telegrafenberg A62, 14473 Potsdam, Germany 2Physics Institute, Potsdam University, Potsdam, Germany
3Climate and Environmental Physics, Physics Institute, University of Bern, Bern, Switzerland 4Oeschger Centre for Climate Change Research, Bern, Switzerland
Correspondence to:M. Mengel ([email protected])
Received: 6 March 2012 – Published in Earth Syst. Dynam. Discuss.: 13 April 2012 Revised: 2 November 2012 – Accepted: 5 November 2012 – Published: 21 November 2012
Abstract. Direct observations, satellite measurements and paleo records reveal strong variability in the Atlantic subpo-lar gyre on various time scales. Here we show that variations of comparable amplitude can only be simulated in a coupled climate model in the proximity of a dynamical threshold. The threshold and the associated dynamic response is due to a positive feedback involving increased salt transport in the subpolar gyre and enhanced deep convection in its cen-tre. A series of sensitivity experiments is performed with a coarse resolution ocean general circulation model coupled to a statistical-dynamical atmosphere model which in itself does not produce atmospheric variability. To simulate the impact of atmospheric variability, the model system is per-turbed with freshwater forcing of varying, but small ampli-tude and multi-decadal to centennial periodicities and obser-vational variations in wind stress. While both freshwater and wind-stress-forcing have a small direct effect on the strength of the subpolar gyre, the magnitude of the gyre’s response is strongly increased in the vicinity of the threshold. Our re-sults indicate that baroclinic self-amplification in the North Atlantic ocean can play an important role in presently ob-served SPG variability and thereby North Atlantic climate variability on multi-decadal scales.
1 Introduction
Most northern deep water formation occurs in the Nordic Seas in combination with strong overflows over the Greenland-Scotland ridge (GSR) and associated entrainment
of surrounding water masses (Hansen et al., 2004). This deep water formation is a crucial part of the Atlantic meridional overturning circulation (AMOC), an important element of the global climate system (Rahmstorf, 2002; Kuhlbrodt et al., 2007). Simulations with a high resolution ocean model sug-gest that the Atlantic inflow into the Nordic Seas is modu-lated significantly by the strength of the subpolar gyre (SPG) south of the GSR (H´at´un et al., 2005). Surface wind stress has a strong influence on the strength and variability of the SPG and the gyre strength has been linked to the northern hemi-sphere main mode of wind stress variability (Hurrell, 1995), the North Atlantic Oscillation (NAO) (Curry et al., 1998; B¨oning et al., 2006) and the Atlantic Multidecadal Oscilla-tion (AMO) (H¨akkinen et al., 2011a,b). However, part of the gyre circulation is controlled by baroclinic adjustments and thereby the density structure in the region (Greatbatch et al., 1991; Penduff et al., 2000; Eden and Willebrand, 2001).
observation of sea surface elevation suggest a rapid decline in SPG strength between 1992 and 2003 (H¨akkinen and Rhines, 2004).
Observations, higher-resolution models and fully coupled climate models with atmospheric variability exhibit strong variations of the SPG circulation strength. Inter-annual ability can reach up to 25 % of the long-term mean and vari-ability on multi-decadal time-scales can be even stronger (Treguier et al., 2005; H´at´un et al., 2005; H¨akkinen and Rhines, 2009; B¨oning et al., 2006). However, due to their complexity the dynamical cause of the variability is often dif-ficult to identify in these models.
In order to understand the SPG’s past role in climate vari-ability (Born and Levermann, 2010; Thornalley et al., 2009) and to project its future evolution, the gap between simula-tions on short time scales with high spatial resolution and those on long time scales and lower resolution needs to be overcome. The coarse-resolution climate model CLIMBER-3α, which we apply in this study, exhibits a threshold be-haviour of the Atlantic SPG with respect to surface fresh-water forcing (Fig. 1) that has been related to baroclinic feedbacks in the region (Levermann and Born, 2007; Born and Mignot, 2011). Similar abrupt changes in Labrador Sea convection and the SPG have been observed in a number of models of varying complexity (LeGrande and Schmidt, 2008; Wu and Wood, 2008; Jongma et al., 2007; Weijer, 2002; Born et al., 2011) as well as sea surface temperature and sea ice reconstructions over the last 140 yr (Dima and Lohmann, 2011). The SPG dynamics of four comprehen-sive coupled climate models of the CMIP3 intercomparison project are dominated by the baroclinic feedback mechanism (Born et al., 2013). The cessation of Labrador Sea convec-tion and a subsequent weakening of the SPG is a promi-nent feature in 21st century global warming simulations with atmosphere-ocean general circulation models (AOGCMS) (Yin et al., 2010; Landerer et al., 2007).
The appreciation of the SPG non-linear and feedback driven dynamics has proven useful for the understanding of historic climate events. The baroclinic response of the SPG to surface wind-stress forcing can depend on the existence of the GSR overflows and lead to two dynamically distinct regimes of the SPG in glacial and interglacial climate (Mon-toya et al., 2011). Paleoclimatic time series in the North Atlantic suggest that a transition of the SPG from a pre-dominantly weak to a strong state has occurred during the so-called 8.2 ka event at the beginning of the present inter-glacial (Born and Levermann, 2010) when a meltwater out-burst from North American proglacial lakes weakened the Atlantic overturning circulation and led to widespread cool-ing over Europe. Furthermore, the SPG likely delayed the last glaciation over Scandinavia by controlling the Atlantic inflow into the Nordic Seas (Born et al., 2010, 2011).
After a brief description of the model and the experi-ments, we present the threshold behaviour for the SPG un-der stationary preindustrial boundary conditions exhibiting
10 15 20 25 30
20 25 30 35
Equillibrium freshwater forcing [mSv]
Gyre strength [Sv]
−200 −100 0 100 200
20 30 40
weak
state
strong
state
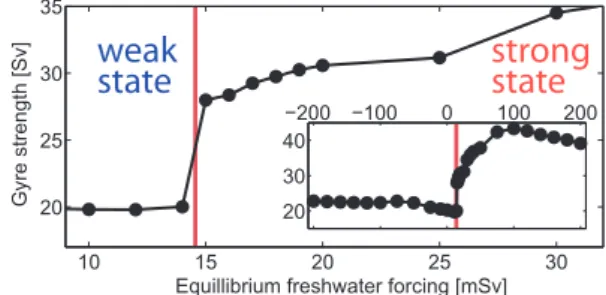
Fig. 1.Equilibrium threshold behaviour of Atlantic SPG volume
transport in response to constant surface freshwater flux. The SPG exhibits a threshold behaviour at 15 mSv freshwater forcing strength where it intensifies by more than 40 %. The inlay shows its response in the entire forcing interval of±200 mSv.
two distinct regimes. We then outline the feedback mecha-nism that potentially leads to the threshold behaviour through amplification in our model. We propose that this self-amplification plays a crucial role in multi-decadal gyre vari-ability, as illustrated by the SPG response to time-dependent variations in surface freshwater flux and wind-stress as a function of the ocean state’s distance from the threshold.
2 Model and experiments
The coupled climate model CLIMBER-3α applied in this study comprises interactive atmosphere, sea ice and ocean components (Montoya et al., 2005). The oceanic general circulation model is based on the GFDL MOM-3 code (Pacanowski and Griffies, 1999), with 24 variably spaced vertical levels, a coarse horizontal resolution of 3.75◦, a background vertical diffusivity of κh= 0.3×10⁻⁴m2s−1
and an eddy-induced tracer advection with a thickness dif-fusion coefficient of κgm= 250 m2s−1. If not denoted
dif-ferently, wind stress is prescribed to climatology (Trenberth et al., 1989). We apply an improved version of the model used in Levermann and Born (2007) that exhibits a more re-alistic strength of the meridional overturning circulation.
The gyre circulation does not extend to the Labrador Sea due to the coarseness of our model. This leads to too fresh surface conditions in this region and too saline conditions at the outflow region of the Labrador Current east and south-east of Newfoundland. The East Greenland Current is fresher and broader than observed. This leads to the eastward shift of the region of subpolar deep convection to the central Irminger basin. The area of deep convection in the Green-land Basin compares well with observations of mixed layer depth (De Boyer Mont´egut et al., 2004).
The statistical-dynamical atmosphere model (Petoukhov et al., 2000) does not produce internal variability. We explore this shortcoming using three sets of experiments:
equilibrium (at least 1000 yr of integration) with fresh-water forcing in the interval ±200 mSv and steps of 5 mSv and refine the steps near the threshold. The fresh-water flux is applied within the Nordic Seas (63.75– 78.75◦N and 11.25◦W–10◦E).
2. Sinusoidal freshwater forcing in addition to the con-stant freshwater forcing freshwater of (1). Amplitudes are varied between 5 and 30 mSv (1 mSv = 103m3s−1) and periods are 25 to 200 yr. The freshwater forcing is applied in the same geographical region as (1).
3. Time-varying surface wind stress reanalysis forcing in addition to (1). We add surface wind stress anomalies from the National Centers for Atmospheric Prediction (NCEP) and National Center for Atmospheric Research (NCAR) reanalysis (Kalnay et al., 1996) to the clima-tology (Trenberth et al., 1989). Wind stress anomalies were computed as the annual mean minus the aver-age over the full period from 1948 to 2009. In order to avoid drifts and discontinuities, the anomalies time series from 1948–2009 are continued by their time-reversed time series. The resulting 122-yr-long time se-ries is cyclic and is used as a long-term representation of 1948–2009 variability. In order to let the simulation run into a dynamic equilibrium this forcing is repeated several times.
Note that no freshwater forcing is applied on the convection sites south of the Greenland–Scotland Ridge and thereby no direct influence on the SPG is induced. We will show here that the remote forcing, however, induces strong shifts in the SPG dynamics.
3 SPG threshold behaviour and mechanism of
transition
In response to a constant surface freshwater forcing, we iden-tify a threshold behaviour with two distinct regimes of circu-lation (Fig. 1). Within the explored forcing interval between ±200 mSv (inlay in Fig. 1) we find a sharp increase of 40 % (from 20 to 28 Sv) in SPG volume transport, measured as the maximum absolute value of the horizontal stream func-tion in the gyre region, at 15 mSv anomalous freshwater forc-ing. This value is well within the range of natural variability (Curry and Mauritzen, 2005) and may easily be exceeded un-der global warming (Dickson et al., 2007).
We find warmer and saltier conditions in the upper 1000 m waters at the southern GSR as the predominant early re-sponse to freshwater forcing in the Nordic Seas in our model. In contrast, the deep overflow density shows little changes. Hansen et al. (2004) argue that thermohaline forcing drives the Atlantic inflow to the Nordic Seas. The inflow balances the deep overflows and depends on the deep water production rate in the Nordic Seas. Reducing the deep water production
through freshwater forcing thus leads to diminished inflow. The applied freshwater forcing is too small to alter the den-sity in the North Atlantic significantly. Since the strength of the AMOC is largely determined by the density difference between the North and South Atlantic (Griesel and Maqueda, 2006; Schewe and Levermann, 2010), the AMOC does not change in response to the additional forcing and the overall deep water formation in the North Atlantic and Nordic Seas is approximately constant. Consequently, reduced deep water formation north of the GSR enhances downwelling south of the ridge within the SPG and more water recirculates in the subpolar basin. This is consistent with the signal of warmer and saltier waters at the southern GSR. We thus argue that the forcing signal does not trigger subpolar changes through the overflows but through its influence on the Atlantic inflow. The strong circulation regime is characterised by a cooler SPG centre and a warmer northern rim (Fig. 2a and b). Lohmann et al. (2009a) have shown that on inter-annual to decadal time scales a strong positive NAO forcing leads to a stronger SPG and the cooling of subpolar mode waters (their Fig. 7a) through high atmospheric heat loss. The same sig-nal is seen in the NCEP-NCAR driven simulations in H´at´un et al. (2005). This does not contradict our results because the response on the longer than decadal scale is dominated by the increased transport of warm NAC waters into the sub-polar mode water region (Lohmann et al., 2009a, Fig. 7b), resembling the pattern we show in Fig. 2a.
Surface salinities are higher along the path of waters ad-vected from the North Atlantic Current (NAC) at the north-ern part of the gyre (Fig. 2c and d) with positive anomalies extending into the SPG centre. The density increase over the whole upper 1000 m in the centre (Fig. 2e and f) is, however, dominated by lower temperatures (compare to Fig. 2a and b). The cooling, freshening and density increase at the south-ern part of the SPG reflects the southeastward shift of the NAC due to the intensification and associated spatial expan-sion of the SPG (Fig. 2h). This expanexpan-sion is in line with ob-servations and model studies (Bersch et al., 2007; H¨akkinen and Rhines, 2009; H¨akkinen et al., 2011a). However, the southward extension (H´at´un et al., 2005; Bersch et al., 2007) associated with a south–north aligned SPG during weak state differs from the behaviour in our model. The southward shift of the NAC during strong gyre circulation may thus be model specific.
A prominent feature of the strong circulation is a south-ward expansion of the winter convection at the SPG centre (Fig. 2, green rectangles). The heat flux to the atmosphere increases over the northern SPG region (Fig. 2g) and ensures that the additional heat that is advected with the warmer NAC waters is released to the atmosphere in such a way that there is a net cooling in the centre of the SPG. The strong negative heat flux anomaly at the southern SPG rim (Fig. 2g) is due to a southward shift of the NAC.
weak circulation strong circulation
gyre center
a
c
e
b
d
f
g
h
additional convection
40 °N 50 °N 60 °N 70 °N 70 °N
60 °N
50 °N
40 °N
40 °W 20 °W 0 °W 70 °N
60 °N
50 °N
40 °N
70 °N
60 °N
50 °N
40 °N 70 °N
60 °N
50 °N
40 °N
200
400
600
800
1000
200
400
600
800
1000 200
400
600
800
1000
70 °N
60 °N
50 °N
40 °N
40 °W 20 °W 0 °W Longitudes
La
titudes
La
titudes
La
titudes
La
titudes met
ers
met
ers
°C
psu
kg/m
3
kg/m
3
W/m
2
°C
psu
met
ers
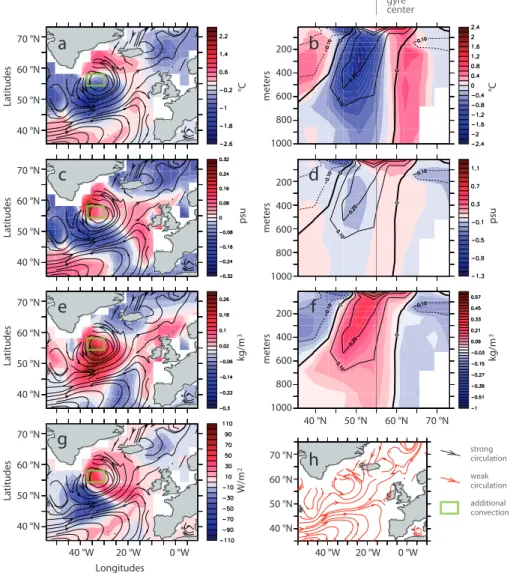
Fig. 2.Difference between the strong (15 mSv forcing) and weak (control) SPG circulation. Panels(a, b)show temperature,(c, d)salinity,
(e, f)density and(g)heatflux. Panels(a, c, e)show averages over the upper 1000 m, black flowlines in panels(a, c, e, g)show upper 1000 m
strong state velocities. Panel(h)shows weak upper 1000 m velocities as flowlines in red. Panels(b, d, f)show zonal averages between 37.5◦ and 18.75◦W with density anomalies as contours and the approximate gyre centre as a grey line.
stronger gyre is associated with an enhanced density differ-ence between its denser centre and the relatively light outer rim of the gyre. This finding has been discussed in detail by Levermann and Born (2007). Since we find a threshold be-haviour in equilibrium simulations, the non-linear transition between the weak and the strong gyre state has to be linked to positive feedbacks within the system.
Feedback mechanisms that drive SPG dynamics through the density difference between the centre and rim have been identified in earlier studies. Levermann and Born (2007) state that enhanced salinity import from the tropics to the gyre centre when gyre circulation is strong drives further densification of the centre. This is consistent with H´at´un et al. (2005) who find increased salt-inflow in the Nordic Seas for periods of a weak SPG in a high-resolution model. The anomalous advection of salt and subsequent stronger
convection in the Irminger basin has been identified as a pos-sible source of multi-decadal AMOC fluctuations (Msadek and Frankignoul, 2009). Born et al. (2013) identified four CMIP3 AOGCMs where this salinity-advection feedback drives SPG dynamics through enhanced convection.
import of saline NAC waters
subpolar convection
SPG strength
temperature at SPG center
+
+
-+
Fig. 3.The feedback loop that leads to the self-amplification of the
SPG transport as described in the text. The stronger SPG imports more warm and saline water from the North Atlantic Current; thus increasing the surface salinity in the subpolar region, which fos-ters winter convection and thereby leads to lower temperatures at the SPG centre. Thus increasing the centre-rim density contrast and thus geostrophic SPG transport.
in the mid-1990s and a slowing down and westward contrac-tion (Bersch et al., 2007; H¨akkinen and Rhines, 2004, 2009; H¨akkinen et al., 2011a) of the SPG which is speculated to be induced by internal dynamics (Lohmann et al., 2009b).
We diagnose the AMOC to be 6.5 % weaker in the strong circulation regime than in the control simulation of our model. The AMOC weakening during the increase of SPG transport is consistent with the observational data and model results (Zhang, 2008; Manabe and Stouffer, 1999), also on high resolution eddy-permitting scale (Zhang et al., 2011).
4 Role of threshold for SPG variability
In order to investigate the role of the threshold behaviour for SPG variability, we introduced temporal variations in surface freshwater and wind stress forcing (Fig. 4). In the standard simulation, i.e. without a constant off-set in freshwater forc-ing and thereby far away from the threshold, the application of the observed wind stress anomalies results in relatively weak SPG variability of less than 2 Sv. Similarly low ability is obtained for sinusoidal surface freshwater flux vari-ations with 20 mSv amplitude and a period of 100 yr.
The SPG response drastically increases when the system is brought closer to the threshold by application of a con-stant freshwater flux off-set. In this case both forcings induce a high SPG variability of 10 Sv for wind-stress and 15 Sv for sinusoidal freshwater forcing, respectively. Similar val-ues were obtained from satellite sea surface height observa-tions (H¨akkinen and Rhines, 2004, 2009) and model results (B¨oning et al., 2006) yielding 10 Sv transport variability or 25 % of the long-term average.
Spatial patterns of variability for temperature, salinity and density mimic the anomaly patterns we discussed in Sect. 3. Thus, the increase of variability originates from the feedback driven dynamical regime in our model. The high correlation
Wind stress forcing Freshwater forcing
SPG (Sv)
(
)
(
)
(
)
(
)
(
)
(
)
SPG (Sv)
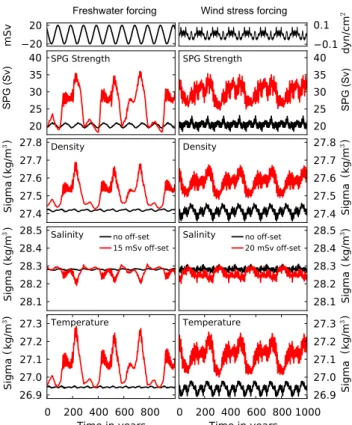
Fig. 4.Time series of SPG strength showing enhanced
variabil-ity near the dynamical threshold due to the baroclinic feedback. Left panels show the response to sinusoidal freshwater forcing with 20 mSv amplitude and a period of 100 yr, right panels to NCEP-NCAR surface wind stress anomaly. Red curves are with constant freshwater off-set of 20 mSv and black curves are without off-set. Narrow upper two panels show the time-varying forcing. The large panels show from top to bottom SPG strength, density variations, density variations due to salinity alone and density variations due to temperature alone. Averages are taken between 37.5◦W–18.75◦W and 45◦N–60◦N in the upper 1000 m. In both the cases of fresh-water and wind forcing the SPG variability is significantly weaker than observed when the system is far from the threshold (black curves). In the vicinity of the dynamical threshold of Fig. 1, the SPG variability is drastically increased. The main density signal is produced by temperature variations. Major salinity changes are re-stricted to the surface layers, but play a key role in the process of self-amplification (see Fig. 3).
of centre temperature, centre density and SPG strength in Fig. 4 supports this finding. Salinity plays an important role in modulating convection but does not drive density changes directly, it is anticorrelated with density in the upper 1000 m average.
5 mSv 10 mSv 15 mSv 20 mSv 25 mSv 30 mSv
0 5 10 15
SPG Amplitude [Sv] 20
25 30 35
SPG Average [Sv]
0 5 10 15
SPG Amplitude [Sv] 20
25 30 35
SPG Average [Sv]
−10 0 10 20
4 6 8
SPG Amplitude [Sv]
Freshwater Offset [mSv] −10 0 10 20
18 20 22 24 26 28
SPG Average [Sv]
Freshwater Offset [mSv]
Freshwater forcing
Average T=50 yrs
Wind stress forcing
Variance T=50 yrs
T=100 yrs T=100 yrs
Average Variance
Fig. 5.Upper and middle panels: mean SPG strength and its
vari-ability for different constant off-set in surface freshwater flux. Dif-ferent lines correspond to the forcing amplitudes as denoted in the legend. Lower panels: Wind induced variability of the SPG for dif-ferent constant freshwater off-sets. The dashed vertical line marks the position of the equilibrium threshold at 15 mSv (compare to Fig. 1). The amplitude of SPG variations increases when approach-ing the threshold for both time-varyapproach-ing freshwater and wind stress forcing. This is best seen for the 100 yr period freshwater forcing, but still present on the shorter time scales (50 yr period and wind stress forcing). Even close to the threshold the system’s response to NCEP wind stress variability is significantly smaller than its re-sponse to centennial scale freshwater variations. The lower panels have a different y-scale.
increase at an off-set similar to the threshold for constant freshwater forcing of 15 mSv. The variability decreases when we move away from the threshold towards higher offsets. The increase of mean and variability are not tightly linked. Vari-ability is high for runs near the threshold because the SPG meanders between the two equilibrium states. Mean strength monotonically increases with higher offsets, analogous to the equilibrium simulations. This particular feature illustrates the dynamic core of the variability. Though the transition of the time-dependent behaviour reflects the equilibrium threshold of Fig. 1, it is not equivalent to the equilibrium response but reflects a dynamical behaviour as expressed in the vari-ance. The dynamical transition occurs over a large interval of forcing amplitudes and is largely independent of this forcing amplitude.
The model’s response to external forcing increases with the period of the freshwater forcing from 8 Sv (50 yr period)
0 2 4 6 8 10
−10 0 10 20
20 25 30 35
Freshwater Offset [mSv] 0
5 10 15 20 25
−10 0 10 20
20 25 30 35
Freshwater Offset [mSv]
5 mSv 10 mSv 15 mSv 20 mSv 25 mSv 30 mSv
Average T=25 yrs Variance
T=25 yrs
T=200 yrs T=200 yrs
Freshwater forcing
SPG Amplitude [Sv] SPG Average [Sv]
SPG Amplitude [Sv] SPG Average [Sv]
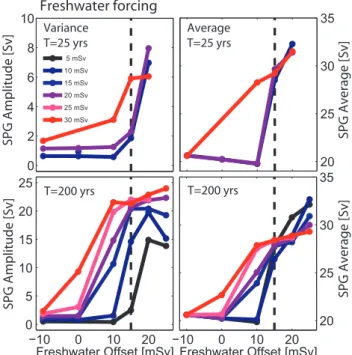
Fig. 6.Mean SPG strength and its variability for varying
perturba-tion amplitude corresponding to Fig. 5, but for periods of 25 and 200 yr. Different lines correspond to different forcing amplitudes as denoted in the legend.
to more than 23 Sv (200 yr period) forcing (Figs. 5 and 6). Forcings with periods shorter than 25 yr do not yield the same variability increase. We thus argue that the signal transport on advective, inter-decadal time scales dominates the dynamics in this study.
For reanalysis surface wind stress forcing (Fig. 5, lower panels) we observe a similar behaviour. SPG variability is relatively constant at a low level as long as the SPG is too far from the threshold. At the threshold of 15 mSv of constant freshwater off-set the amplitude of the time-varying response increases and stays strong beyond the threshold.
80° N 40° N
40° S 0°
80° S
0.4 0.2
-0.2 -0.4 0
40 20
-20 -40 0 100° W 0° 100° E
50° W 30° W 10° W 10° E 80° N
70° N
50° N 60° N
40° N sea sur
fac
e heigh
t in cm
sea le
v
el pr
essur
e in hP
a
a
b
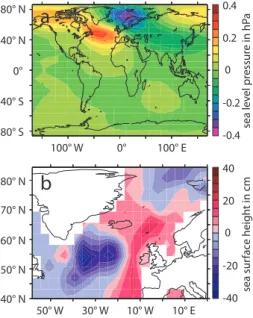
Fig. 7.Sea level pressure(a)and sea surface height(b)difference
of strong minus weak SPG state with 100 yr period sinusoidal fresh-water forcing of 20 mSv amplitude.
5 Conclusion and discussion
Here we present simulations with a coarse-resolution climate model to better understand the mechanisms of SPG variabil-ity. In equilibrium, the SPG exhibits a threshold behaviour with respect to surface freshwater flux which results from a positive baroclinic feedback within the subpolar region. It is important to note that the freshwater is not applied on the SPG but north of the Greenland–Scotland Ridge. The SPG response is thereby induced by circulation changes through the baroclinic feedback. This non-linear behaviour enhances SPG variability drastically for variations in surface freshwa-ter forcing with a magnitude comparable to observed changes in precipitation in the region.
Wind-stress forcing from reanalysis data only produces gyre transport variability similar to observations if the system is brought close to the threshold. The observed high variabil-ity of SPG transport (H¨akkinen et al., 2011b) may thus indi-cate a near-threshold gyre circulation. A near-threshold gyre circulation might collapse into a permanent weak SPG circu-lation as found in model simucircu-lations under global warming scenarios (Yin et al., 2009).
The presented mechanism of variability provides an alter-native approach to these derived from fully coupled simula-tions to explain North Atlantic multidecadal variability. See Grossmann and Klotzbach (2009) for a review. The export of sea ice to the subpolar North Atlantic has been found to induce AMOC variability through its influence on subpolar convection, see for example Holland et al. (2001). Oka et al. (2012) suggest a thermal threshold originating from the inter-play of Nordic Seas sea ice cover, convection and the AMOC
strength. Timmermann et al. (1998) identified a delayed neg-ative feedback between North Atlantic surface water temper-atures, the North Atlantic Oscillation and convection to foster variability through a coupled air-sea mode.
While it is clear that our results are not directly applicable to presently observed variability on interannual time scales, they suggest a potential role of the associated baroclinic feed-back on multi-decadal time scales. In fact, the abrupt weak-ening of the SPG during the 1990s has been associated with the decay of the density difference between inner and exterior gyre through thermohaline forcing (H¨akkinen and Rhines, 2004).
In our simulations the SPG does not respond to forcing shorter than 25 yr, pronounced variability is found for peri-ods of 50 yr and longer. The signal transport on advective, inter-decadal time scales thus dominates. Time delayed ad-vective adjustment has been proposed to drive NA variability (Lee and Wang, 2010) and Zhang et al. (2011) showed that the baroclinic adjustment on advective time scales can domi-nate also in high resolution eddy-permitting models. The in-creasing amplitude with the length of the forcing period fur-ther supports the dominance of long adjustment time scales. A general problem of coarse resolution models is the dilu-tion of temperature and salinity signals due to the large grid boxes. We thus hypothesize that the time scales in our model might be larger than they would be at higher resolution where the adjustment through planetary waves may come into play. In that case strong variability of a shorter period than 50 yr might be possible and mechanisms of variability on a sub-decadal scale may come into play (Lee and Wang, 2010).
The average net surface freshwater flux over the Nordic Seas in our control simulation is 47.4 mSv, comparing well to the 54 mSv estimated by Dickson et al. (2007). Still, we cannot rule out that the 1000 yr average state of the ocean has deficiencies and the distance to the SPG threshold exceeds the value presented here.
Model studies and observations found a threshold be-haviour for the subpolar convection and the SPG circula-tion (Legrande et al., 2006; Wu and Wood, 2008; Thornal-ley et al., 2009; Born et al., 2011). This indicates the robust-ness of our results though artefacts due to the low resolution or deficiencies in the density structure cannot be ruled out. Analyses of higher resolution models with and without at-mospheric variability are necessary to confirm our results.
Acknowledgements. This research was supported by the German Environmental Foundation (DBU) and the German National Academic Foundation. A. B. is supported by the European Com-mission under the Marie Curie Intra-European Fellowship ECLIPS (PIEF-GA-2011-300544) and the “National Centre for Excellence in Research: Climate” of the Swiss National Science Foundation.
References
Bersch, M., Yashayaev, I., and Koltermann, K. P.: Recent changes of the thermohaline circulation in the subpolar North Atlantic, Ocean Dynam., 57, 223–235, 2007.
Blindheim, J., Borovkov, V., Hansen, B., Malmberg, S.-A., Turrell, W. R., and Osterhus, S.: Upper layer cooling and freshening in the Norwegian Sea in relation to atmospheric forcing, Deep-Sea Res. Pt. I, 47, 655–680, 2000.
B¨oning, C. W., Scheinert, M., Dengg, J., Biastoch, A., and Funk, A.: Decadal variability of subpolar gyre transport and its rever-beration in the North Atlantic overturning, Geophys. Res. Lett., 33, L21S01, doi:10.1029/2006GL026906, 2006.
Born, A. and Levermann, A.: The 8 k event: abrupt tran-sition of the subpolar gyre towards a modern North At-lantic circulation, Geochem. Geophy. Geosy., 11, Q06011, doi:10.1029/2009GC003024, 2010.
Born, A. and Mignot, J.: Dynamics of decadal variability in the At-lantic subpolar gyre: a stochastically forced oscillator, Climate Dynamics, pp. 591–+, 2011.
Born, A., Nisancioglu, K., and Braconnot, P.: Sea ice induced changes in ocean circulation during the Eemian, Clim. Dynam., 35, 1361–1371, 2010.
Born, A., Nisancioglu, K., and Risebrobakken, B.: Late Eemian warming in the Nordic Seas as seen in proxy data and climate models, Paleoceanography, 26, PA2207, doi:10.1029/2010PA002027, 2011.
Born, A., Stocker, T. F., Levermann, A., and Raible, C. C.: Is the Atlantic subpolar gyre bistable in comprehensive coupled cli-mate models?, Clim. Dynam., 39, 1–15, doi:10.1007/s00382-012-1525-7, 2013.
Curry, R. G. and Mauritzen, C.: Dilution of the Northern North At-lantic Ocean in Recent Decades, Science, 308, 1772–1774, 2005. Curry, R. G., McCartney, M. S., and Joyce, T. M.: Oceanic trans-port of subpolar climate signals to mid-depth subtropical waters, Nature, 391, 575–577, 1998.
De Boyer Mont´egut, C., Madec, G., Fischer, A. S., Lazar, A., and Iudicone, D.: Mixed layer depth over the global ocean: An ex-amination of profile data and a profile-based climatology, J. Geo-phys. Res., 109, 1–20, 2004.
Dickson, B., Yashayaev, I., Meincke, J., Turrell, B., Dye, S., and Holfort, J. T.: Rapid freshening of the deep North Altantic Ocean over the past four decades, Nature, 416, 832–837, 2002. Dickson, R., Rudels, B., Dye, S., Karcher, M., Meincke, J., and
Yashayaev, I.: Current estimates of freshwater flux through Arctic and subarctic seas, Prog. Oceanogr., 73, 210–230, doi:10.1016/j.pocean.2006.12.003, 2007.
Dima, M. and Lohmann, G.: Hysteresis Behavior of the Atlantic Ocean Circulation identified in Observational Data, J. Climate, 24, 397–403, 2011.
Eden, C. and Willebrand, J.: Mechanism of Interannual to Decadal Variability of the North Atlantic Circulation, J. Climate, 14, 2266–2280, 2001.
Greatbatch, R. J., Fanning, A. F., Goulding, A. D., and Levitus, S.: A diagnosis of interpentadal circulation changes in the North At-lantic, J. Geophys. Res., 96, 22009–22023, 1991.
Griesel, A. and Maqueda, M. A. M.: The relation of meridional pressure gradients to North Atlantic deep water volume trans-port in an ocean general circulation model, Clim. Dynam., 26, 781–799, doi:10.1007/s00382-006-0122-z, 2006.
Grossmann, I. and Klotzbach, P. J.: A review of North Atlantic modes of natural variability and their driving mechanisms, J. Geophys. Res., 114, 1–14, doi:10.1029/2009JD012728, 2009. H¨akkinen, S. and Rhines, P. B.: Decline of Subpolar North Atlantic
Circulation During the 1990s, Science, 304, 555–559, 2004. H¨akkinen, S. and Rhines, P. B.: Shifting surface currents in the
northern North Atlantic Ocean, J. Geophys. Res., 114, C04005, doi:10.1029/2008JC004883, 2009.
H¨akkinen, S., Rhines, P., and Worthen, D.: Warm and saline events embedded in the meridional circulation of the northern North Atlantic, Journal of Geophysical Research (Oceans), 116, 3006, doi:10.1029/2010JC006275, 2011a.
H¨akkinen, S., Rhines, P., and Worthen, D.: Atmospheric Blocking and Atlantic Multidecadal Ocean Variability, Science, 334, 655– 659, doi:10.1126/science.1205683, 2011b.
Hansen, B., Østerhus, S., Quadfasel, D., and Turrell, W.: Already the Day After Tomorrow ?, Science, 305, 953–954, 2004. H´at´un, H., Sandø, A. B., Drange, H., Hansen, B., and Valdimarsson,
H.: Influence of the Atlantic Subpolar Gyre on the Thermohaline Circulation, Science, 309, 1841–1844, 2005.
H´at´un, H., Payne, M., Beaugrand, G., Reid, P., Sandø, A., Drange, H., Hansen, B., Jacobsen, J., and Bloch, D.: Large bio-geographical shifts in the north-eastern Atlantic Ocean: From the subpolar gyre, via plankton, to blue whiting and pilot whales, Prog. Oceanogr., 80, 149–162, 2009.
Holland, M. M., Bitz, C. M., Eby, M., and Weaver, A. J.: The Role of Ice–Ocean Interactions in the Variability of the North Atlantic Thermohaline Circulation, J. Climate, 14, 656–675, doi:10.1175/1520-0442(2001)014<0656:TROIOI>2.0.CO;2, 2001.
Holliday, N., Hughes, S., Bacon, S., Beszczynska-M¨oller, A., Hansen, B., Lav´ın, A., Loeng, H., Mork, K., Østerhus, S., Sher-win, T., and Walczowski, W.: Reversal of the 1960s to 1990s freshening trend in the northeast North Atlantic and Nordic Seas, Geophys. Res. Lett., 35, L03614, doi:10.1029/2007GL032675, 2008.
Hurrell, J. W.: Decadal trends in North Atlantic Oscillation: Re-gional Temperatures and Precipitation, Science, 269, 676–679, doi:10.1126/science.269.5224.676, 1995.
Jongma, J., Prange, M., Renssen, H., and Schulz, M.: Amplification of Holocene multicentennial climate forcing by mode transitions in North Atlantic overturning circulation, Geophys. Res. Lett., 34, L15706, doi:10.1029/2007GL030642, 2007.
Kalnay, E., Kanamitsu, M., Kistler, R., Collins, W., Deaven, D., Gandin, L., Iredell, M., Saha, S., White, G., Woollen, J., Zhu, Y., Chelliah, M., Ebisuzaki, W., Higgins, W., Janowiak, J., Mo, K. C., Ropelewski, C., Wang, J., Leetmaa, A., Reynolds, R., Jenne, R., and Joseph, D.: The NCEP/NCAR 40-Year Reanalysis Project, B. Am. Meteorol. Soc., 77, 437–471, 1996.
Kuhlbrodt, T., Griesel, A., Montoya, M., Levermann, A., Hofmann, M., and Rahmstorf, S.: On the driving processes of the Atlantic meridional overturning circulation, Rev. Geophys., 45, RG2001, doi:10.1029/2004RG000166, 2007.
Landerer, F. W., Jungclaus, J. H., and Marotzke, J.: Regional Dy-namic and Steric Sea Level Change in Response to the IPCC-A1B Scenario, J. Phys. Oceanogr., 37, 296–312, 2007.
LeGrande, A. and Schmidt, G.: Ensemble, water isotope-enabled, coupled general circulation modeling insights into the 8.2 ka event, Paleoceanography, 23, PA3207, doi:10.1029/2007GL031732, 2008.
Legrande, A., Schmidt, G., Shindell, D., Field, C., Miller, R., Koch, D., Faluvegi, G., and Hoffmann, G.: Consistent simulations of multiple proxy responses to an abrupt climate change event, P. Natl. Acad. Sci., 103, 837–842, 2006.
Levermann, A. and Born, A.: Bistability of the subpolar gyre in a coarse resolution climate model, Geophys. Res. Lett., 34, L24605, doi:10.1029/2009GL039166, 2007.
Lohmann, K., Drange, H., and Bentsen, M.: Response of the North Atlantic subpolar gyre to persistent North Atlantic oscillation like forcing, Clim. Dynam., 32, 273–285, doi:10.1007/s00382-008-0467-6, 2009a.
Lohmann, K., Drange, H., and Bentsen, M.: A possible mechanism for the strong weakening of the North Atlantic subpolar gyre in the mid-1990s, 36, L15602, doi:10.1029/2007GL031732, 2009b. Manabe, S. and Stouffer, R.: The rˆole of thermohaline circulation in
climate, Tellus A, 51, 91–109, 1999.
Montoya, M., Griesel, A., Levermann, A., Mignot, J., Hofmann, M., Ganopolski, A., and Rahmstorf, S.: The Earth System Model of Intermediate Complexity CLIMBER-3α, Part I: description and performance for present day conditions, Clim. Dynam., 25, 237– 263, 2005.
Montoya, M., Born, A., and Levermann, A.: Reversed North At-lantic gyre dynamics in present and glacial climates, Clim. Dy-nam., 36, 1107–1118, doi:10.1007/s00382-009-0729-y, 2011. Msadek, R. and Frankignoul, C.: Atlantic multidecadal oceanic
variability and its influence on the atmosphere in a climate model, Clim. Dynam., 33, 45–62, doi:10.1007/s00382-008-0452-0, 2009.
Oka, A., Hasumi, H., and Abe-Ouchi, A.: The thermal threshold of the Atlantic meridional overturning circulation and its control by wind stress forcing during glacial climate, Geophys. Res. Lett., 39, 1–6, doi:10.1029/2012GL051421, 2012.
Pacanowski, R. C. and Griffies, S. M.: The MOM-3 manual, Tech. Rep. 4, NOAA/Geophyical Fluid Dynamics Laboratory, Prince-ton, NJ, USA, 1999.
Penduff, T., Barnier, B., and de Verdi`ere, A. C.: Self-adapting open boundaries for a sigma coordinate model of the eastern North Atlantic, J. Geophys. Res., 105, 211–279, 2000.
Petoukhov, V., Ganopolski, A., Brovkin, V., Claussen, M., Eliseev, A., Kubatzki, C., and Rahmstorf, S.: CLIMBER-2: a climate sys-tem model of intermediate complexity, Part I: model description and performance for present climate, Clim. Dynam., 16, 1–19, 2000.
Rahmstorf, S.: Ocean circulation and climate during the past 120,000 years, Nature, 419, 207–214, 2002.
Reverdin, G.: North atlantic subpolar gyre surface vari-ability (1895–2009), J. Climate, 23, 4571–4584, doi:0.1175/2010JCLI3493.1, 2010.
Rodwell, M., Rowell, D., and Folland, C.: Oceanic forcing of the wintertime North Atlantic Oscillation and European climate, Na-ture, 398, 320–323, doi:10.1038/18648, 1999.
Schewe, J. and Levermann, A.: The role of meridional density dif-ferences for a wind-driven overturning circulation, Clim. Dy-nam., 34, 547–556, 2010.
Thornalley, D., Elderfield, H., and McCave, I.: Holocene oscilla-tions in temperature and salinity of the surface subpolar North Atlantic, Nature, 457, 711–714, doi:10.1038/nature07717, 2009. Timmermann, A., Latif, M., Voss, R., and Groetzner, A.: Northern hemispheric interdecadal variability: a coupled air-sea mode, J. Climate, 11, 1906–1931, 1998.
Treguier, A. M., Theetten, S., Chassignet, E. P., Penduff, T., Smith, R., Talley, L., Beismann, J. O., and B¨oning, C.: The North At-lantic Subpolar Gyre in Four High-Resolution Models, J. Cli-mate, 35, 757–774, 2005.
Trenberth, K., Olson, J., and Large, W.: A Global Ocean Wind Stress Climatology based on ECMWF Analyses, Tech. Rep. NCAR/TN-338+STR, National Center for Atmo-spheric Research, Boulder, Colorado, USA, 1989.
Weijer, W.: Response of the Atlantic overturning circulation to South Atlantic sources of buoyancy, Global Planet. Change, 34, 293–311, 2002.
Wu, P. and Wood, R.: Convection induced long term freshening of the subpolar North Atlantic Ocean, Clim. Dynam., 31, 941–956, 2008.
Yashayaev, I.: Hydrographic changes in the Labrador Sea, 1960-2005, Prog. Oceanogr., 73, 242–276, 2007.
Yin, J., Schlesinger, M. E., and Stouffer, R. J.: Model projections of rapid sea-level rise on the northeast coast of the United States, Nat. Geosci., 2, 262–266, 2009.
Yin, J., Griffies, S., and Stouffer, R.: Spatial Variability of Sea Level Rise in Twenty-First Century Projections, J. Climate, 23, 4585– 4607, 2010.
Yoshimori, M., Raible, C., Stocker, T., and Renold, M.: Simulated decadal oscillations of the Atlantic meridional overturning circu-lation in a cold climate state, Clim. Dynam., 34, 101–121, 2010. Zhang, R.: Coherent surface-subsurface fingerprint of the Atlantic meridional overturning circulation, Geophys. Res. Lett., 35, L20705, doi:10.1029/2008GL035463, 2008.