Influence of Genetic Combinations on HDL-C Levels in a Southern
Brazilian Population
Fabiana Michelsen de Andrade
1, Marilu Fiegenbaum
2,3, Silvana de Almeida
3, Mara Helena Hutz
4Universidade Feevale1; Centro Universitário Metodista IPA2; Universidade Federal de Ciências da Saúde de Porto Alegre3; Universidade Federal do Rio Grande do Sul4, Porto Alegre, RS - Brazil
Mailing address: Fabiana Michelsen de Andrade •
Universidade Feevale - 239/2755, PROPI s. 201 F - Vila Nova - 93352-000 - Novo Hamburgo, RS - Brazil
E-mail: [email protected], [email protected] Manuscript received August 21, 2009; revised manuscript received March 03, 2010; accepted April 12, 2010.
Abstract
Background: Low HDL-C levels are important predictors of coronary disease, the first cause of death worldwide. Many factors affect HDL-C levels, such as polymorphisms of genes encoding for key proteins of the reverse cholesterol transport pathway.
Objective: To investigate the influence of seven polymorphisms of the CETP, APOA1, ABCA1 and SCARB1 genes on HDL-C levels in a southern Brazilian population.
Methods: The polymorphisms were investigated in a sample of 500 individuals of European descent, but HDL-C levels from only 360 individuals were adjusted for cofactors using multiple linear regressions in the association study. The sample was divided in tertiles according to adjusted HDL-C levels, and allele and haplotype frequencies were compared between the 1st and 3rd tertiles of adjusted HDL-C levels.
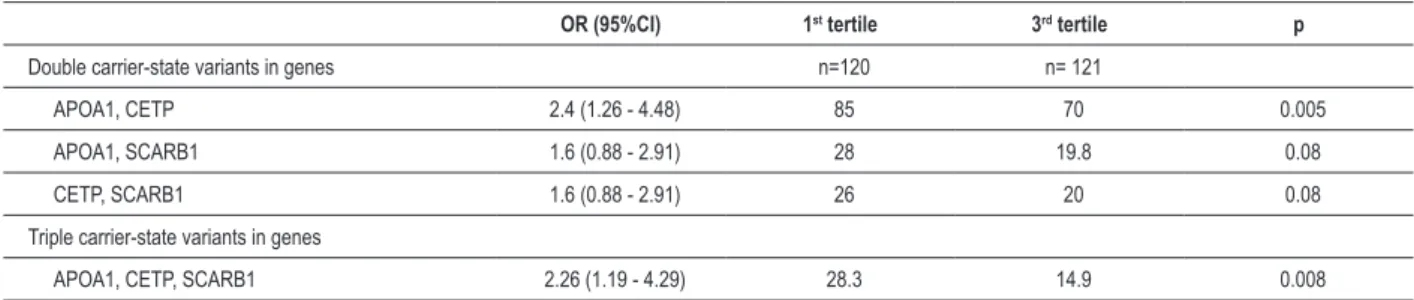
Results: When combinations of risk alleles were tested, the frequency of allele combinations in three genes (haplotype 1 of APOA1 gene, variant 2S of SCARB1 gene, and allele B1 of CETP gene) was significantly higher in the lower tertile of adjusted HDL-C (28.3%) than in the upper tertile (14.9%; p=0.008), which indicated that the presence of these variants increased 2.26 times the chances of having HDL-C levels below 39.8 mg/dl.
Conclusion: These markers, when studied separately, are expected to have a small influence on the characteristic under analysis, but greater influence was detected when the markers were studied in combination. In a population of southern Brazilians, our data showed a significant influence of variant combinations of APOA1, SCARB1 and CETP genes on HDL-c levels. (Arq Bras Cardiol 2010; 95(4): 430-435)
Key words: Cholesterol, HDL/genetics; population/genetics; polymorphism, genetic; south region/Brazil.
in lipid profiles. However, it remains unclear how these polymorphisms affect lipid profiles and whether this influence is found in different populations; this has not been studied in any South American population to this date. This study investigated the influence of seven polymorphisms of the CETP, APOA1, ABCA1 and SCARB1 genes on HDL-C levels in a southern Brazilian population.
Methods
Subjects
The population sample consisted of 500 individuals of European descent, as previously described2. The volunteers
included in this sample were enrolled at two clinical centers of the Universidade Federal do Rio Grande do Sul among individuals referred from several city health centers for routine blood tests. A questionnaire was used to collect data on drug intake and lifestyle variables, such as smoking, physical activity, alcohol consumption, oral contraceptive use, menopause, and anthropometric measurements. Smoking status was classified as non-smoker or current smoker; ex-smokers were excluded.
Introduction
Epidemiologic studies have provided strong evidence that low concentrations of HDL cholesterol (HDL-C) are associated with increased risk of coronary artery disease (CAD)1. Therefore, the causes of low HDL-C levels have been
All individuals gave their informed consent before inclusion in the study. Exclusion criteria were: pregnancy; secondary hyperlipidemia due to kidney, liver or thyroid disease; and diabetes or fasting blood glucose levels higher than 7 mmol/ l3. Women on hormone replacement therapy and individuals
taking lipid-lowering medications, beta-blockers or anti-inflammatory drugs were also excluded.
Participants were examined in the morning after a 12-hour fast. Weight was measured in subjects without shoes and with light clothing. Body height was measured without shoes, with heels placed together and the back to the wall. Body mass index (BMI) was calculated as weight/height2 (kg/m2).
Waist circumference was measured at the smallest horizontal circumference between the 12th rib and the iliac crest.
Laboratory analyses
Blood samples were collected after a 12-hour fast. Total cholesterol, HDL cholesterol and triglycerides were measured at each Clinical Center using standard enzymatic methods4.
LDL cholesterol levels were calculated using Friedwald’s formula5. Glucose levels were also measured to ensure that no
individuals with diabetes were included in the study. A salting-out procedure was used to extract DNA from blood samples6.
DNA was amplified using PCR and oligonucleotide primers under the conditions previously described for CETP7, APOA18,
ABCA19, and SCARB110. The amplification products were
subsequently digested with the following restriction enzymes under conditions recommended by the manufacturer: Taq
I (CETP - TaqIB), Msp I (APOA1 - g-75a and c+83t), Xag I (ABCA1 - Arg219Lys), Alu I (SCARB1 - Gly2Ser), ApaI (SCARB1 - c780t) and Hae III (SCARB1 - c1050t). Genotypes were determined after electrophoresis on agarose gels containing ethidium bromide, and a 100 bp ladder was used to score the band sizes.
Statistical analyses
Allele frequencies were estimated by gene counting. A c2 test for goodness of fit was used to check whether allele
frequencies agreed with those expected according to Hardy-Weinberg equilibrium. Maximum-likelihood haplotype frequencies and linkage disequilibrium were estimated using the Arlequin 2000 software package11. SCARB1 and
APOA1 gene haplotypes were determined using the method described by Long12.
Only 360 subjects were analyzed in the association study between SNPs and HDL-C levels because the full sets of data for the other individuals were not available. Multiple linear regressions were performed to adjust HDL-C levels using the backward stepwise method. Covariates entered in the first model were gender, age, waist, smoking, alcohol consumption, BMI, triglyceride levels and menopause, as well as all possible interaction terms. In the final model used for HDL-C adjustment, significant covariates that remained in the model were gender, age, BMI, triglyceride levels, triglyceride levels x age, post-menopausal status and triglyceride levels x menopause for women. Triglyceride levels were log-transformed to remove skewness. The sample was divided according to HDL-C tertiles, and heterogeneity between groups in contingency tables was tested using
the c2 or the Fisher exact test. Logistic regressions were
performed to obtain the odds ratio for each genetic variant or combination of variants. All analyses were made with the Statistical Package for the Social Sciences (SPSS) 11.0 for Windows.
Results
Table 1 shows the allele and genotype frequencies for the
CETP, ABCA1 and SCARB1 genes, as well as the haplotype frequencies for the APOA1 gene. The haplotype frequencies of the SCARB1 gene are not shown because they did not influence HDL-C levels in any posterior analysis. All genotype frequencies are in Hardy-Weinberg equilibrium (data not shown). Strong linkage disequilibrium between the two variants of the APOA1 gene was detected (D´= -0.84, c2=10.04, p<0.001), and haplotype 1 (-75g/+83c) was the
most common. For the SCARB1 gene, allele 780t was the most frequently found with 1050c, which indicated a significant disequilibrium (D´= - 0.44, c2=5.97, p=0.015). Gly2Ser
was not linked to any of the other two variants investigated in this gene.
The prevalence of each haplotype of the APOA1 gene and the allele frequencies of the other variants under study were compared between the 1st and 3rd HDL-C tertiles adjusted for
non-genetic variables (Table 2), and the clinical characteristics according to these groups are shown in Table 3. Although the difference was not statistically significant, haplotype 1 of the
APOA1 gene, the TaqIB*1 allele of the CETP gene, and the 2Ser
allele of the SCARB1 gene were more frequent in the 1st tertile
(p=0.18, p=0.16 and p=0.29). When allele and haplotype frequencies were again compared between the first and the fourth HDL-C quartiles, the same trends were found, except for the Gly2Ser SNP of the SCARB1 gene, that had a smaller p value (p=0.14).
Based on these results, risk alleles for low HDL-C levels were selected from the statistical comparisons that yielded values of p lower than 0.25. These variants, labeled “risk variants”, are shown in Table 4, which also shows how the carriers of these variants were analyzed later: whether as homozygous, or as heterozygous and homozygous carriers.
The frequency of individuals with genetic risk combinations for low HDL-C levels was compared between the 1st and 3rd
Table 2 - Allele frequencies according to HDL-C tertiles*
1st tertile
(< 39.8 mg/dl)
3rd tertile
(> 47.1 mg/dl) p
n = 120 n = 121
CETP TaqIB*2 (-) 37.8 44.2 0.16
APOA1*haplotype 1 76.5 71.1 0.18†
ABCA1*219Lys 37.1 33.9 0.51
SCARB1*2Ser 15.4 12 0.29‡
SCARB1*780t 10 7.9 0.43
SRB1*1050t 37.7 38 1
* HDL levels were adjusted for gender, age, BMI, triglyceride levels, triglyceride levels x age, postmenopausal status and triglyceride levels x menopause for women; †comparison of haplotype 1 vs. other haplotypes. ‡ when differences between quartiles were tested, p value of this SNP was 0.14.
Table 3 - Clinical and laboratory characteristics of study participants according to HDL tertiles
1st tertile
(< 39.8 mmol/l)
3rd tertile
(> 47.1 mmol/l) p
n = 120 n = 121
TC (mg/dl) 190.8 ± 39.8 204.1 ± 41.6 0.01
HDL-C (mg/dl) 34.8 ± 5.7 56.4 ± 9.4 <0.001
LDL-C (mg/dl) 129.9 ± 36.4 124.0 ± 38.5 0.18
Triglycerides (mg/dl) 130.6 ± 61.7 118.4 ± 68.2 0.04
BMI (kg/m2) 25.9 ± 4.8 26.1 ± 5.3 0.78
Age (years) 42.5 ± 14.4 41.0 ± 16.3 0.45
Waist circumference
(cm) 92.0 ± 12.7 89.5 ± 13.8 0.14
Gender (% men) 72.5% 38% <0.001
Menopausea 15.2% 24% 0.44
Physical inactivity 62.5% 60% 0.79
Smokingb 34.2% 29.8% 0.49
Alcohol consumptionc 24.2% 22.3% 0.76
Wine consumptionc 9.2% 5.8% 0.34
a women on hormone replacement therapy were excluded; b ex-smokers were excluded; c alcohol or wine consumption was deined as at least one glass per week.
Table 4 - Risk variants for each gene and carrier state
Gene Polymorphism Risk variants Carrier state
APOA1 -g75a / +c83t Haplotype 1 Homozygotes 11
SCARB1 Gly2Ser Ser SerSer + GlySer
CETP TaqIB B1 B1B1 + B1B2
Table 1 - Allele, haplotype and genotype frequencies in the total sample
Genotype, allele, haplotype
GenBank number
Total sample, n = 500
n %
CETP-TaqIB rs 708272
B1B1 89 17.9
B1B2 241 48.4
B2B2 168 33.7
B2 35.7
ABCA1 - Arg219Lys rs 2230806
Arg Arg 219 43.8
Arg Lys 236 47.2
Lys Lys 45 9
Lys 32.6
APOA1 -g75a rs 670
gg 296 59.3
ga 176 35.3
aa 27 5.4
a 23.0
APOA1 +c83t rs5069
cc 444 89.0
ct 53 10.6
tt 2 0.4
t 5.7
APOA1 -g75a / +c83t rs 670 / rs5069
11 253 50.8
12 164 32.9
13 39 7.8
22 27 5.4
23 13 2.6
33 2 0.4
1) -75g / +83 c 71.2
2) -75a / +83 c 23.2
3) -75g / +83 t 5.6
SCARB1 - Gly2Ser rs 4238001
Gly Gly 376 75.2
Gly Ser 116 23.2
Ser Ser 8 1.6
Ser 13.2
SCARB1 - c780t rs 7967975
cc 420 84
ct 75 15
tt 5 1
T 17
SCARB1 - c1050t rs 5888
cc 180 37.2
ct 233 48.1
tt 71 14.7
t 29.3
Discussion
Table 5 - Frequency of double and triple carrier-state variants of polymorphisms according to HDL-C tertiles
OR (95%CI) 1st tertile 3rd tertile p
Double carrier-state variants in genes n=120 n= 121
APOA1, CETP 2.4 (1.26 - 4.48) 85 70 0.005
APOA1, SCARB1 1.6 (0.88 - 2.91) 28 19.8 0.08
CETP, SCARB1 1.6 (0.88 - 2.91) 26 20 0.08
Triple carrier-state variants in genes
APOA1, CETP, SCARB1 2.26 (1.19 - 4.29) 28.3 14.9 0.008
For the CETP gene, the prevalence of 35.7% for the rare allele is slightly lower than that detected in populations of exclusive European descent, which was about 40%13-17. In the
ABCA1 gene, the values found for the Arg219Lys SNP were within the range of variation found in other populations of European descent: from 25% for Germans to 38.5% for North Americans9,18-21. Similar results were found for the APOA1
gene when compared with values from other populations of European descent22. Our data on the SCARB1 gene are
comparable with those reported in the few studies published to this date, but the 17% allele frequency found in our study for intron 5 SNP and the 29.3% for the exon 8 variant are slightly different from the frequencies found by Richard et al23
for North Americans (9% and 49%) and by Acton et al10 for a
Spanish population (10.5% and 43.8%). Our analysis of the exon 1 variant showed that the frequency of our rare allele was slightly lower than that found in a Spanish population10. These
differences may reflect differences in the ethnic composition of the populations under comparison.
The pattern of linkage disequilibrium between the variants of the APOA1 gene was similar to those found in the literature24. In our population, no linkage disequilibrium
was found between exon 1 SNP of the SCARB1 gene and the other SNPs under study according to findings reported for other populations10,25,26. However, the pattern of linkage
disequilibrium between the intron 5 and exon 8 SNPs differ depending on the population under study: in Spanish10 and
North American25 populations, the intron 5 rare variant was
linked to the exon 8 common variant, which was the same that was found in our population. However, in an Austrian sample and in a different population sample in the United States, the two common alleles were linked23,26.
When evaluated separately, our data did not show any significant influence of the polymorphisms under study on HDL-C levels (Table 4). Three of the variants under study had allele frequencies that were very similar in the comparison between the 1st and 3rd tertiles. Two of them are SCARB1 gene
polymorphisms, found at intron 5 and exon 8, and the scarce data about them in the literature have not demonstrated their influence on HDL-C levels10,25-28 nor indicated any associations
with sex and use of hormones23,28,29. Moreover, no influence
of the Arg219Lys variant on the ABCA1 gene was found in several studies with different populations20,21,30.
We selected polymorphisms of the genes CETP, APOA1 and SCARB1 for a combined evaluation. Although some authors detected isolated effects of these genes on HDL-C
levels, several other studies found that the influence of these genes is too weak to be detected when they are evaluated separately13,26,31,32.
These differences in the magnitude of a genetic influence may reflect differences between the genetic composition of each population, as well as environmental differences between them. The evaluation of combined gene effects on HDL-C levels is rare in the literature, which makes comparison of data difficult. The evaluation of two or three risk variants revealed a significant influence of variants of the APOA1, CETP and SCARB1 genes on HDL-C levels. This finding is in agreement with studies of APOA1 and CETP genes in other populations8,33-37. However, for the Gly2Ser
SNP of the SCARB1 gene, the few studies conducted so far associated the presence of the 2Gly allele with a decrease in HDL-C levels. In our population, the combination of the 2Ser allele and variants of APOA1 and CETP genes was more frequent in the participants with lower HDL-C levels (Table 5). Two other authors25,27 did not detect any significant
influence of this allele on HDL-C levels. Therefore, the role of this polymorphism should be further investigated, and we cannot rule out the possibility that it acts as a marker of another variant not yet studied, although it is an exchange of amino acids. The confirmation of this hypothesis would explain the differences between our data and findings reported by Acton et al10.
The physiologic roles of these three proteins are closely associated: CETP is a key enzyme in HDL metabolism38,
whereas SR-BI and apoAI act as receptor and ligand of HDL-C39,40. Therefore, the interaction detected may be
understood when analyzed in association with HDL-C metabolism and absorption path.
This study detected genetic influences on HDL-C levels, but it had some limitations. Major problems were the small sample size for the association study and the fact that data were missing for 140 patients. Therefore, less evident genetic influences, which can only be detected when a larger sample size is used, might not have been detected. Moreover, a prospective study of the influence of allelic combinations should be conducted to confirm the clinical impact of these genes on the lipid profile of our population.
therefore, analyses of interactions between genes should be conducted, even if their separate effects cannot be detected, because that may be the only way to evaluate their actual genetic role in each population.
Acknowledgements
We thank Maria Perpetua de Oliveira Pinto for technical assistance, and Marcel Arsand and Fabiano Roldão for help in sample collection. Financial support was provided by Conselho Nacional de Desenvolvimento Científico e Tecnológico (CNPq, Brazil), Programa de Apoio a Nucleos de Excelência (PRONEX, Brazil) and Fundação de Amparo à Pesquisa do Estado do Rio Grande do Sul (FAPERGS, Brazil).
Potential Conflict of Interest
No potential conflict of interest relevant to this article was reported.
Sources of Funding
This study was funded by CNPq, CAPES, PRONEX e FAPERGS.
Study Association
This article is part of the thesis of doctoral submitted by Fabiana Michelsen de Andrade, from Universidade Federal do Rio Grande do Sul.
References
1. Assman G, Schulte H. Relation of high-density lipoprotein cholesterol and triglycerides to incidence of atherosclerotic coronary artery disease (the PROCAM experience): Prospective Cardiovascular Munster study. Am J Cardiol. 1992; 70 (7): 733-7.
2. de Andrade FM, Silveira FR, Arsand M, Antunes ALS, Torres MR, Zago AJ, et al. Association between -250G/A polymorphism of the hepatic lipase gene promoter and coronary artery disease and HDL-C levels in a Southern Brazilian population. Clin Genet. 2004; 65 (5): 390-5.
3. American Diabetes Association. Report of the expert committee on the diagnosis and classification of diabetes mellitus. Diabetes Care. 1997; 20 (7): 1183-97.
4. Pesce AJ, Kaplan LA. Methods in clinical chemistry. Saint Louis: The C. V. Mosby Co; 1987.
5. Friedwald WT, Levy RI, Fredrickson DS. Estimation of the concentration of low density lipoprotein cholesterol in plasma without use of the preparative ultracentrifuge. Clin Chem. 1972; 18 (6): 499-502.
6. Lahiri DK, Nurnberger JI. A rapid non-enzymatic method for the preparation of HMW DNA from blood for RFLP studies. Nucleic Acid Res. 1991; 19 (19): 5444.
7. Fumeron F, Betoulle D, Luc G, Behague I, Ricard S, Poirier O, et al. Alcohol intake modulates the effect of a polymorphism the cholesterol transfer protein gene on plasma high density lipoprotein and the risk of myocardial infarction. J Clin Invest. 1995; 96 (3): 1664-71.
8. Wang XL, Badenhop R, Humphrey KE, Wilcken DEL. New MspI polymorphism at +83 bp of the human apolipoprotein AI gene: association with increased circulating high density lipoprotein cholesterol levels. Gen Epidemiol. 1996; 13 (1): 1-10.
9. Clee SM, Zwinderman AH, Engert JC, Zwarts KY, Molhuizen HO, Roomp K, et al. Common genetic variation in ABCA1 is associated with altered lipoprotein levels and a modified risk for coronary artery disease. Circulation. 2001; 103 (9): 1198-205.
10. Acton S, Osgood D, Donoghue M, Corella D, Pocovi M, Cenarro A, et al. Association of polymorphisms at the SR-BI gene locus with plasma lipid levels and body mass index in a white population. Arterioscler Thromb Vasc Biol. 1999; 19 (7): 1734-43.
11. Schneider S, Roessli D, Excoffier L. Arlequin ver. 2.000: a software for population genetics data analysis. Geneva:University of Geneva;2000.
12. Long JC. Multiple locus haplotype analysis, version 2.0. Software and documentation distributed by the author: section on population genetics and linkage, laboratory of neurogenetics, NIAAA.Bethesda: National Institutes of Health ;1999.
13. Thompson JF, Durham LK, Lira ME, Shear C, Milos PM. CETP polymorphisms associated with HDL cholesterol may differ from those associated with
cardiovascular disease. Atherosclerosis. 2005; 181 (1): 45-53.
14. Klos KLE, Sing CF, Boerwinkle E, Hamon SC, Rea TJ, Clark A, et al. Consistent effects of genes involved in reverse cholesterol transport on plasma lipid and apolipoprotein levels in CARDIA participants. Arterioscler Thromb Vasc Biol. 2006; 26 (8): 1828-36.
15. Nettleton JA, Steffen LM, Ballantyne CM, Boerwinkle E, Folsom AR. Associations between HDL-cholesterol and polymorphisms in hepatic lipase and lipoprotein lipase genes are modified by dietary fat intake in African American and White adults. Atherosclerosis. 2007; 194 (2): e131-40.
16. Sorlí JV, Corella D, Francés F, Ramírez JB, González JI, Guillén M, et al. The effect of the APOE polymorphism on HDL-C concentrations depends on the cholesterol ester transfer protein gene variation in a Southern European population. Clin Chim Acta. 2006; 366 (1-2): 196-203.
17. McCaskie PA, Beilby JP, Chapman CM, Hung J, McQuillan BM, Thompson PL, et al. Cholesteryl ester transfer protein gene haplotypes, plasma high-density lipoprotein levels and the risk of coronary heart disease. Hum Genet. 2007; 121 (3-4): 401-11.
18. Porchay I, Péan F, Bellili N, Royer B, Cogneau J, Chesnier M-C, et al. (for the D.E.S.I.R. Study Group): ABCA1 Single nucleotide polymorphisms on high-density lipoprotein-cholesterol and overweight: the D.E.S.I.R. Study. Obesity . 2006; 14 (11): 1874-9.
19. Benton JL, Ding J, Tsai MY, Shea S, Rotter JI, Burke GL, et al. Associations between two common polymorphisms in the ABCA1 gene and subclinical atherosclerosis: Multi-Ethnic Study of Atherosclerosis (MESA). Atherosclerosis. 2007; 193 (2): 352-60.
20. Mantaring M, Rhyne J, Ho Hong S, Miller M. Genotypic variation in ATP-binding cassette transporter-1 (ABCA1) as contributors to the high and low high-density lipoprotein-cholesterol (HDL-C) phenotype. Transl Res. 2007; 149 (4): 205-10.
21. Pasdar A, Yadegarfar G, Cumming A, Whalley L, St Clair D, MacLeod MJ. The effect of ABCA1 gene polymorphisms on ischaemic stroke risk and relationship with lipid profile. BMC Med Genet. 2007; 8: 30.
22. Pulkkinen A, Viitanen L, Kareinen A, Lehto S, Laakso M. MspI polymorphism at +83 bp in intron 1 of the human apolipoprotein A1 gene is associated with elevated levels of HDL cholesterol and apolipoprotein A1 in nondiabetic subjects but not in type 2 diabetic patients with coronary heart disease. Diabetes Care. 2000; 23 (6): 791-5.
23. Richard E, von Muhlen D, Barrett-Connor E, Alcaraz J, Davis R, McCarthy JJ. Modification of the effects of estrogen therapy on HDL cholesterol levels by polymorphisms of the HDL-C receptor, SR-BI: the Rancho Bernardo Study. Atherosclerosis. 2005; 180 (2): 255-62.
lipoprotein-lipid levels in African Blacks. Genet Epidemiol. 1999; 16 (2): 205-22.
25. Osgood D, Corella D, Demissie S, Cupples LA, Wilson PWF, Meigs JB, et al. Genetic variation at the scavenger receptor class B type I gene locus determines plasma lipoprotein concentrations and particle size and interacts with type 2 diabetes: the Framingham Study. J Clin Endocrinol Metab. 2003; 88 (6): 2869-79.
26. Ritsch A, Sonderegger G, Sandhofer A, Stanzl U, Tancevski I, Eller P, et al. Scavenger receptor class B type I polymorphisms and peripheral arterial disease. Metabolism. 2007; 56 (8): 1135-41.
27. Morabia A, Ross BM, Costanza MC, Cayanis E, Flaherty MS, Alvin GB, et al. Population-based study of SR-BI genetic variation and lipid profile. Atherosclerosis. 2004; 175 (1): 159-68.
28. Bauerfeind A, Knoblauch H, Costanza MC, Luganskaja T, Toliat MR, Nürnberg P, et al. Concordant association of lipid gene variation with a combined HDL/ LDL-cholesterol phenotype in two European populations. Hum Hered. 2006; 61 (3): 123-31.
29. Roberts CG, Shen H, Mitchell BD, Damcott CM, Shuldiner AR, Rodriguez A. Variants in scavenger receptor class B type I gene are associated with HDL cholesterol levels in younger women. Hum Hered. 2007; 64 (2):107-13.
30. Frikke-Schmidt R, Nordestgaard BG, Jensen GB, Steffensen R, Tybjærg-Hansen A. Genetic variation in ABCA1 predicts ischemic heart disease in the general population. Arterioscler Thromb Vasc Biol. 2008; 28 (1): 180-6.
31. Ma YQ, Thomas GN, Tomlinson B. Association of two apolipoprotein A-I gene MspI polymorphisms with lipid and blood pressure levels. Int J Cardiol. 2005; 102 (2): 309-14.
32. Chien KL, Chen MF, Hsu HC, Su TC, Chang WT, Lee CM, et al. Genetic association study of APOA1/C3/A4/A5 gene cluster and haplotypes on triglyceride and HDL cholesterol in a community-based population. Clin
Chim Acta. 2008; 388 (1-2): 78-83.
33. Boedkholdt SM, Thompson JF. Natural genetic variation as a tool in understanding the role of CETP in lipid levels and disease. J Lipid Res. 2003; 44 (6): 1080-93.
34. Freeman DJ, Samani NJ, Wilson V, McMahon AD, Braund PS, Cheng S, et al. A polymorphism of the cholesteryl ester transfer protein gene predicts cardiovascular events in non-smokers in the West of Scotland Coronary Prevention Study. Eur Heart J. 2003; 24 (20): 1833-42.
35. Park KW, Choi JH, Kim HK, Oh S, Chae IH, Kim HS, et al. The association of cholesteryl ester transfer protein polymorphism with high-density lipoprotein cholesterol and coronary artery disease in Koreans. Clin Genet. 2003; 63 (1): 31-8.
36. Ma YQ, Thomas GN, Ng MCY, Critchley JAJH, Cockram CS, Chan JCN, et al. Association of two apolipoprotein A-I gene MspI polymorphisms with high density lipoprotein (HDL)-cholesterol levels and indices of obesity in selected healthy Chinese subjects and in patients with early-onset type diabetes. Clin Endocrinol. 2003; 59 (4): 442-9.
37. Zou Y, Hu D, Yang X, Jia X, Wang L, Cui L, et al. Relationships among apolipoprotein A1 gene polymorphisms lipid levels and coronary atherosclerosis disease. Clin Med J (Engl). 2003; 116 (5): 665-8.
38. Bruce C, Chouinard RA Jr, Tall AR. Plasma lipid transfer proteins, high-density lipoproteins, and reverse cholesterol transport. Annu Rev Nutr. 1998; 18: 297-330.
39. Brouillette CG, Anantharamaiah GM, Engler JA, Borhani DW. Structural models of human apolipoprotein A-I: a critical analysis and review. Biochim Biophys Acta. 2001; 1531 (1-2): 4-46.