Master Thesis
M.Sc. International Business, Maastricht University Master in Management, Universidade Nova Lisboa Name: David Verkerk
Student Number: I6060128 & MST15001410 Email: [email protected]
Supervisor: Dr. Paul Smeets & Dr. Martijn Boons Maastricht, 6 January 2014
Corporate Social Responsible Behaviour in the
David Verkerk ǀ 06.01.2014 3
Abstract
The financial crisis of 2007-2008 incited many criticisms of financial institutions, especially their policies and ethics. In response, corporate social responsibility (CSR) has increased in European and American financial industries. This increase is stimulated by both consumer demand and regulatory pressure. However, there are major differences in CSR between
European and American markets, differences which indicate important market trends but are
little studied. This study examines the differences in CSR behaviour between the financial
industries of those two regions, and investigates what relationship, if any, exists between CSR
behaviour and financial performance.
This research analyses different CSR rating methodologies. An analysis of CSR rating
methodologies and studies reveals a significant difference in CSR behaviour between European
and American markets. The European financial industry shows a faster increase in CSR
behaviour in comparison to their counterparts in the United States of America (US), enlarging
the difference in CSR behaviour between the two. The results demonstrate a transformation
from a positive toward a negative correlation between CSR behaviour and financial
performance for the years 2009-2012, inclusive.
The CSR measurement framework described by Scholtens (2008) is found to have significant
correlations with other CSR rating agencies, thereby restraining its added value. Ultimately,
these results affirm the importance of measuring CSR behaviour to better understand
differences in the influence of CSR in the financial industry and wider differences between
David Verkerk ǀ 06.01.2014 4
Table of Contents
List of Tables ... 8List of Abbreviations ... 8
Introduction ... 9
Background ... 9
Research Objective ... 10
Thesis Outline ... 11
Literature Review ... 12
Introduction ... 12
Responsible Banking ... 13
Measuring CSR Behaviour in the Financial Industry ... 14
The Influence of CSR Ratings ... 15
Consumer Behaviour ... 16
The Differences between Europe and the US ... 17
Financial Performance ... 18
Drivers for Responsible Banking ... 19
2.8.1 Regulatory Pressure. ... 19
2.8.2 Branding through the Use of Corporate Social Responsibility ... 19
2.8.3 Financial Performance through Responsible Banking ... 20
2.8.4 Market Value ... 21
David Verkerk ǀ 06.01.2014 5
Introduction ... 23
Sample Description ... 23
Research Design ... 23
Data Collection ... 24
CSR Measurement Indicators ... 24
Financial Correlation Analysis ... 25
Financial Performance Analysis ... 26
CSR Certificates and Initiatives ... 26
Framework of CSR Measurement ... 27
Adjustments of Conceptual Framework ... 28
External CSR Rating ... 28
Data Analysis ... 30
Introduction ... 30
CSR Measurements ... 30
CSR in the US and European Market ... 31
In-depth CSR Behaviour analysis ... 33
Size and CSR behaviour ... 34
Exclusion of Outliers ... 34
CSR Behaviour and Financial Performance ... 35
CSR Certificates and Initiatives ... 37
CSR Behaviour ... 38
David Verkerk ǀ 06.01.2014 6
Introduction ... 39
Validity of Scholtens (2008) Framework ... 39
The Transatlantic Separation ... 39
The Financial Impact of CSR Behaviour ... 41
Conclusion ... 44
Theoretical Contributions ... 44
6.1.1 Transparent CSR measurement methodologies ... 44
6.1.2 The Transatlantic Debate ... 44
6.1.3 The CSR – Financial Performance Debate ... 45
Managerial Contributions ... 46
Limitations and Future Research ... 46
Summary ... 47
List of References ... 49
Appendix ... 54
Appendix A. Table of Variable Explanation, Alphabetical ... 54
Appendix B. Revised Framework of Scholtens (2008) ... 56
Appendix C. List of Financial Institutions Included in the Sample Size ... 57
Appendix D. Region Analysis ... 58
Appendix E. In Depth Region Analysis ... 61
Appendix F. Analysis of Normality ... 66
Appendix G. Correlation Total Assets – CSR Behaviour ... 67
David Verkerk ǀ 06.01.2014 7
Appendix I. Change in Standard Deviation... 69
Appendix J. Partial Correlation analysis ROE/Net Margin t-1 - CSR Behaviour t ... 70
Appendix K. Table of Total Score per Financial Institution ... 71
David Verkerk ǀ 06.01.2014 8
List of Tables
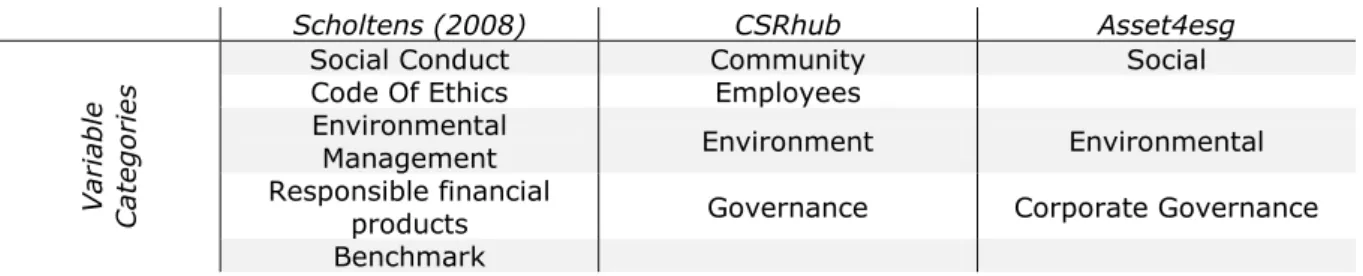
Table 1. Variable Categories for the various Rating frameworks. ... 29Table 2. Correlation analysis between the various CSR frameworks. ... 31
Table 3. Test for Normality for the various Rating Frameworks by Region. ... 32
Table 4. Significant test for the various CSR frameworks by region. ... 32
Table 5. Mean calculation for the various CSR frameworks by region. ... 32
Table 6. Correlation analysis Total Assets-CSR behaviour (appendix G). ... 34
Table 7. Test of Normality for financial indicators. ... 35
Table 8. Financial institutions excluded from the analysis. ... 35
Table 9. Partial correlation analysis CSR behaviour - ROE/net margin 2009. ... 36
Table 10. Partial correlation analysis CSR behaviour - ROE/net margin 2010. ... 36
Table 11. Partial correlation analysis CSR behaviour - ROE/net margin 2011. ... 36
Table 12. Partial correlation analysis CSR behaviour - ROE/net margin 2012. ... 36
Table 13. Partial correlation analysis Code of Ethics - financial performance. ... 37
List of Abbreviations
CSR Corporate Social Responsibility
GRI Global Reporting Initiative
ROA Return on Assets
David Verkerk ǀ 06.01.2014 9
Introduction
Background
In an ever more competitive environment, financial institutions must positively distinguish themselves to attract consumers. Financial institutions can differentiate themselves from competitors by adopting a more sustainable approach. That action responds to customer demands, creates more value, and increases financial performance (Ogrizek, 2002; Scholtens, 2008; Weber, 2005). The financial industry has reacted relatively slow to the growing demand for sustainable products (Jeucken, 2002). Yet doing so could significantly benefit society due to the financial industry’s wide influence (Jeucken, 2002; Thompson & Cowton, 2004; Weber, Diaz, & Schwegler, 2012). Further, corporate social responsibility (CSR) behaviour potentially benefits the financial institutions themselves. The self-benefit of CSR is a research topic with mixed conclusions (Aebi, Sabato, & Schmid, 2012; Bolton, 2012; Cuesta-González, Muñoz-Torres, & Fernández-Izquierdo, 2006; Simpson & Kohers, 2002). Research on various industries suggests pronounced division in CSR behaviour between the US and Europe, wherein the latter region has a much stronger trend towards sustainability (Gjølberg, 2009; Maignan & Ralston, 2002; Matten & Moon, 2008; Sotorrío & Sánchez, 2008; Tschopp, 2005). Yet, whether the same trend exists for financial industries has been little researched.
David Verkerk ǀ 06.01.2014 10 mixed results in existing research about the relationship between CSR behaviour and financial performance may reflect the different CSR rating methodologies used. Therefore, the relationship between CSR behaviour and financial performance can be determined only after analysing the different CSR rating methodologies and establishing their effectiveness.
Research Objective
The US and European financial markets are considered to be some of the most developed in the world (Voronkova, 2004). After the financial crisis, drastic changes in policy and practice were demanded and greater responsibility in business conduct was strongly encouraged (Herzig & Moon, 2011). Both European and American markets received consumer and regulatory pressure toward these reforms (Haigh & Jones, 2006). The precise effect of these drivers remains to be investigated. The main questions are as follows: did both markets receive the same amounts of pressure to generate more CSR, and how did markets differ in the CSR behaviour they produced?
The potential and evident differences in CSR behaviour between the American and European
markets are widely accepted. But, the precise differences in perceptions of CSR and CSR
behaviours are still debated. Further investigation will provide better explanation of the drivers
of CSR and give a more accurate understanding of the differences between American and
European market behaviour.
One of key intentions in this study is to determine the necessity of adopting an existing
transparent CSR measurement framework specifically for the financial industry.
The second part of this study explores the relationship between CSR behaviour and financial
performance. I provide a longitudinal analysis using various CSR measurement methodologies
coupled with recent financial performance of the two markets in question. This study excludes
David Verkerk ǀ 06.01.2014 11
measurement methodology by executing a longitudinal study of various CSR measure
methodologies (Ahmed, Islam, & Hasan, 2012; Bolton, 2012; Soana, 2011; Stanwick &
Stanwick, 1998).
To provide an overview, this study examines the following investigative questions.
Is there a need for transparent CSR rating methodologies that are specific to the financial
industry, such as designed by Scholtens (2008)?
Did the financial industries in the US and Europe have different CSR behaviours after the
financial crisis, and what were those differences?
Does a longitudinal, multi-measurement study reveal a relationship between CSR behaviour
and financial performance?
Thesis Outline
David Verkerk ǀ 06.01.2014 12
Literature Review
Introduction
The focus of this research lies in the role of CSR behaviour within the international financial industry operating on European and US markets. The financial sector is fundamental to modern society, and is constantly scrutinised. Yet, it responded relatively slowly to the increasing social attention to sustainability (Jeucken, 2002). The trend towards a more sustainable approach in the financial industry has been extensively researched, particularly about how sustainability could both benefit the financial industry (Carnevale, Mazzuca, & Venturini, 2012; Matute‐ Vallejo, 2011; Scholtens, 2006; Statman, 2007) and society at large (Jeucken, 2002; Thompson & Cowton, 2004; Weber et al., 2012). Further research has focussed on the impact of CSR behaviour on the fiscal performance of financial institutions. The potential financial and social advantages of CSR are prompting further research with more definitive results ( Aebi et al., 2012; Ahmed et al., 2012; Bolton, 2012; Cuesta-González et al., 2006; Simpson & Kohers, 2002; Soana, 2011). A positive relationship between CSR behaviour and financial performance will stimulate further adoption of CSR practices within the financial industry.
David Verkerk ǀ 06.01.2014 13
Responsible Banking
The work of Hart (2010), and emphasis on CSR beyond greening, is a useful starting point for
understanding current trends in CSR. As Hart stresses, organisations ideally not only reduce their non-sustainable behaviour but also begin practices that benefit society, effectively making amends for past harms. Higher levels of CSR behaviour in the financial industry is the first step in achieving all ‘three pillars of sustainability’: economic, social, and environmental (Hart, 2010). The CSR movement has forced firms not only to be accountable to their legitimate stakeholders but to society generally (Ogrizek, 2002). Kramer and Porter (2011) redefine this trend through the concept of shared value, in which CSR moves away from philanthropic behaviour and the reduction of the corporate footprint towards social responsibility integrated into products and services (Porter & Kramer, 2011). This new conception of CSR behaviour creates a positive, and less harmful, impact on society. Authors such as Jeucken (2002) stress the importance of the financial industry in achieving a wholly sustainable society. To reach this goal the financial industry must recognise their intermediary role and consider their investments and credit provision accordingly. Financial institutions have the power to guide capital toward sustainable products and services rather than non-sustainable products. They can promote sustainable and responsible behaviour through varying degrees of accepted practice and policy. For example, homeowners could receive more advantageous mortgage loans if they achieve CO2 neutral living conditions. Aside from such consumer incentives, financial institutions can
David Verkerk ǀ 06.01.2014 14 themes as human rights, climate change, and corporate ethics (Gelder, Herder, & Verhoef, 2013). Another example is yourethicalmoney.org, an online rating agency operating in the UK. This online rating agency examines similar factors and provides consumers better insight into the ethical practices of financial institutions operating in the UK market.
Measuring CSR Behaviour in the Financial Industry
Measuring the influence of CSR behaviour and responsible banking on the performance of financial organisations requires a clear definition and a transparent method of measurement. The most cited definition of sustainable development is, ‘The development that meets the needs of the present without compromising the ability of future generations to meet their own needs’ (Romijn & Caniëls, 2011, p. 618; United Nations, 1987). The financial industry faces special challenges in measuring CSR behaviour. The two main difficulties are a lack of transparent, detailed information, and the absence of a methodology to measure the full impact of CSR behaviour (Abbott & Monsen, 1979). These difficulties with measuring CSR behaviour stem from the financial industry’s intermediate role and its multiple influences on other industries. However, it is possible to gather information about the level of CSR behaviour through independent rating agencies, such as KLD Research & Analytics, Inrate Database, EIRIS, and Asset4esg (Bolton, 2012; Márquez & Fombrun, 2005; Soana, 2011; Weber et al., 2012) or through independent online agencies such as CSRhub.com. It is also possible to determine whether financial institutions venture in certain CSR activities by looking at certificates, such as the ISO, the OECD, or the Community Reinvestment Act in the US (Márquez & Fombrun, 2005; Morhardt et al., 2002; Simpson & Kohers, 2002).
David Verkerk ǀ 06.01.2014 15 Soana, 2011). This limitation may be overcome by content analysis of the institution’s annual and sustainability reports. However, these reports are often self-published and may under or over report the firm’s CSR activities to produce a more positive image for stakeholders (Abbott & Monsen, 1979; Cuesta-González et al., 2006). To create a more transparent method, Scholtens (2008) developed a new framework combining various methods. The framework combines sustainability reports with various organisations overseeing CSR behaviour. The framework’s strength is that any individual use it to measure CSR behaviour within a financial institution. That characteristic contributes to a higher level of transparency in the assessment of CSR behaviour. This framework also assesses the existence of sustainable products and services. Through this assessment the shared value behaviour of an organisation can be evaluated (Porter & Kramer, 2011). Nevertheless, the framework of Scholtens (2008) is still limited in the exactitude of its measurements of CSR behaviour.
The Global Reporting Initiative (GRI) was established with the purpose remediating the limited transparency in sustainability reporting. Although this initiative does not measure the level of CSR behaviour within an organisation and has debatable scoring methods, it sets outs guidelines for developing a more transparent environment and tests institutions’ reports (Dingwerth, 2010; Morhardt et al., 2002; Willis, 2003). GRI is currently the best initiative for developing higher levels of transparency within the corporate world (Dingwerth, 2010).
The Influence of CSR Ratings
David Verkerk ǀ 06.01.2014 16 in recent years, yet very few focus on the financial industry (Márquez & Fombrun, 2005). These ratings also work through a non-transparent, proprietary method hindering the testability and comparability of various agencies (Rahman & Post, 2011). Rating agencies give little insight to their methods and, therefore, are susceptible to skewing levels and kinds of CSR behaviour within rated companies (Scalet & Kelly, 2009). The framework of Scholtens (2008) is developed through a different method, which relies on neither proprietary nor non-publically available information (Scholtens, 2008). Accordingly, that rating framework can be used by those who do not have access to costly proprietary information.
Hypothesis 1: There are significant differences between the ranking developed by Scholtens
(2008) and other independent CSR rating agencies.
Consumer Behaviour
David Verkerk ǀ 06.01.2014 17
The Differences between Europe and the US
Matten and Moon (2004) proposed to make a distinction between ‘implicit’ and ‘explicit’ CSR. In this theory implicit CSR is more embedded in broader norms and regulations that are regulated through formal and informal institutions. Explicit CSR refers to ‘corporate policies to assume responsibility for the interest in society’ (Matten & Moon, 2004, p. 9). These two types of CSR have important differences in presentation and initiative, even when the level of CSR behaviour is equal. Matten and Moon (2008) suggest that explicit CSR is more common in the US and implicit CSR more in Europe. This variation reflects differences in politics, economics, education, labour, and culture in those regions, and also differences in the organisation, coordination, and control of financial systems of the two markets (Maignan & Ferrell, 2000; Matten & Moon, 2008) which supports the stakeholder theory (Freeman, 1999). These relationships were tested by comparing the CSR practices between the US, Canada, and various European countries (Gjølberg, 2009). That research used a methodology focussing solely on explicit CSR practices, which resulted in the lowest score for the US. These results could have been an effect of the variables used in the data collection or calculation model. Nonetheless, the results are contrary the relationships conjectured by Matten and Moon (2004).Yet, the factors that Matten and Moon (2008) attributed differences in CSR systems may cause differences between financial markets.
David Verkerk ǀ 06.01.2014 18 (2005) suggests a similar trend, in which the CSR movement is much stronger in Europe than in the US. Europe is also seen to be adopting more reporting and accounting standards for CSR practices (Tschopp, 2005).
Hypothesis 2: Financial institutions operating in the European market will show a higher level
of CSR behaviour in comparison to their counterparts on the US market.
Financial Performance
David Verkerk ǀ 06.01.2014 19
Drivers for Responsible Banking
Understanding the rise of socially responsible banking requires an understanding of the various drivers for this phenomenon. There are four main drivers for financial institutions to adopt CSR practices: regulatory pressure (Haigh & Jones, 2006), financial performance (Scholtens, 2006), branding (Ogrizek, 2002) and market value (Carnevale et al., 2012).
2.8.1 Regulatory Pressure.
Haigh and Jones (2006) consider the influence of government policies on the adoption of CSR behaviour within firms. Governments show interest in CSR practices within companies for several reasons. Specifically, they help to reach (inter-)national environmental targets, they encourage a sustainability culture, they facilitate co-regulation frameworks, and they involve both the public and private sectors in the fostering CSR (Steurer, 2010). There are notable differences, stemming from culture and politics, between American and European regulatory policies concerning CSR as (Matten & Moon, 2004). These differences in government regulations and efforts have precipitated differing CSR practices (Doh & Guay, 2006).
2.8.2 Branding through the Use of Corporate Social Responsibility
David Verkerk ǀ 06.01.2014 20 sustainability developments in financial services primarily respond to consumer demand for increased levels of CSR behaviour from traditionally ‘non-sustainable’ commercial banks (Weber, 2005). A growing number of consumers believe that the most successful firms in the future will be those that balance short-term financial performance with long-term sustainable practices (Ogrizek, 2002). Accordingly, banks now try to show these practices and outlooks. Maignan and Ralston (2002) demonstrate a difference between the way European and US commercial banks behave toward this demand for CSR behaviour. European banks venture into product offering and thereby create shared value, while US commercial banks show higher levels of philanthropic behaviour.
Hypothesis 3: Financial institutions operating on the European market will show higher levels
of Shared Value behaviour in comparison to their counterparts in the US
Hypothesis 4: Financial institutions operating on the US market will show higher levels of
Social Conduct behaviour in comparison to their counterparts in Europe.
2.8.3 Financial Performance through Responsible Banking
David Verkerk ǀ 06.01.2014 21 measuring the level of CSR behaviour and variations in the studied regions. Yet, financial advantage is possibly the most important driver of CSR in the financial industry. CSR behaviour can also be reflected in the investment portfolio of financial institutions, which may also influence financial performance (Jeucken, 2002). Adopting CSR increases the financial institution’s active observation of its own CSR practices. This could lead to a lower percentage of loan loss by the financial institutions or to a higher percentage of return due to the growing market for sustainable products and services (Jeucken, 2002; San-Jose, Retolaza, & Gutierrez-Goiria, 2011; Statman, 2007). Firm size and growth also influence the level of CSR behaviour, as higher levels of CSR behaviour occur when a firm’s size is increasing (Sotorrío & Sánchez, 2008; Udayasankar, 2007).
Hypothesis 5: Financial institutions with higher levels of total asset will show a higher level of
CSR behaviour.
Hypothesis 6: Financial institutions showing higher levels of CSR behaviour will show a higher
ROE.
Hypothesis 7: Financial institutions showing higher levels of CSR behaviour will show a higher
net margin.
2.8.4 Market Value
David Verkerk ǀ 06.01.2014 22 Bolton (2012) displayed a positive relationship between CSR and an organisation’s value in the US banking sector. These varying results could be explained by regional differences in consumer reception of or demand for CSR practices. . The market value is heavily dependent on investors and their perception of CSR as a core aspect of an organisation (Weber, 2005). Ultimately, CSR positively influences the public image of financial institutions and , consequently, increases market value (Carnevale et al., 2012).
Hypothesis 8: Financial institutions using CSR certificates and initiatives will show a higher
David Verkerk ǀ 06.01.2014 23
Methodology
Introduction
The explanation of this study’s methodology begins by detailing its design (see appendix A), followed by an overview of the research setting. Scholten’s theoretical framework is then explained and adjustments for improve are proposed (see appendix B). In particular, the addition of specific variables to the data analysis process provides a more unified CSR measurement tool. These theoretical methods are followed by a description of the data collection procedure and data analysis process.
Sample Description
Total assets for the year 2012 were evaluated in order to obtain an equal sample from both American and European markets. A top 50 list of the largest financial institutions operating on these markets was made using this method. There is, however, an evident difference in total asset size between the top 50 financial institutions operating on the European market and the US market. Financial institutions operating on the European market show higher total assets typically as compared to their counterparts on the US market.
Both publicly as privately owned financial institutions were included in the sample size (appendix C). Financial institutions were not screened on CSR practices or any other predetermined variable.
Research Design
David Verkerk ǀ 06.01.2014 24 scope of this study, financial statements were included in the research. Data collected using CSRhub and Asset4esg provided a more longitudinal vision of CSR behaviour. Thomson One Banker was used as a source of independent financial information. The scope of the research covered a time span from 2008 to 2012, inclusive. Scholtens (2008) framework relies on publicly accessible data, including the website of the various banks included in the sample; however, the framework only provides an assessment for the year 2012.
Data Collection
Financial institutions included in the sample were evaluated through their websites, annual reports, and, when available, sustainability reports, which allowed comprehensive representation of CSR behaviour. Extra variables, such as global compact, were assessed through individual websites. Supplementary CSR data was collected through the use of the rating agencies Asset4esg and CSRhub.com. Financial data was gathered using Thomson One Banker and through an evaluation of the annual reports of financial institutions included in the sample.
CSR Measurement Indicators
David Verkerk ǀ 06.01.2014 25 The second level of testing was conducted with the intention to measure the potential difference between the US and European markets concerning their CSR behaviour in the financial industry. Data available for 2008 to 2012 was measured to show differences and analysed for trends in both markets. A primary analysis assessed the distribution of CSR behaviour within the two regions, after which a Mann-Whitney U Test and a two-sample Kolmogorov-Smirnov test was performed. These tests showed potential differences between the two regions. A further analysis isolated the exact factors for which the two regions have potential differences. This analysis was executed using the same methods. The variable categories, CSRhub community variable category, Asset4esg social variable category, and total to responsible financial were
assessed for shared value creation. By assessing the score of these variable categories, which
include CSRhub community and governance, Asset4esg social conduct, and total to social
conduct, the social conduct behaviour could be analysed.
Financial Correlation Analysis
After this primary CSR behaviour analysis, a secondary analysis focussed on the relationship between CSR behaviour and financial performance. The financial measures were gathered using Thomson One Banker and converted to dollars, where required. If financial data was not available or incomplete, financial reports of the financial institution were reviewed. The financial data gathered for all the financial analysis consisted of ROE, net margin, and total assets. All three variables are taken over a time period of five years, spanning the years 2008 till 2012.
David Verkerk ǀ 06.01.2014 26 was determined through the use of the variable total assets. This was a two-tailed test because the direction of the effect was not investigated.
A secondary partial correlation test was performed, in which the variables region and total assets are transferred into control variables. In this test the correlation level between CSR behaviour and financial performance was investigated, while taking the control variables into account.
Financial Performance Analysis
A partial correlation test measured the potential correlation between CSR behaviour and financial performance, represented by ROE and net margin. This method is similar to that performed by Waddock and Graves (1997) and Soana (2011). The partial correlation test began by using the CSR score of the year 2008 and its effect on the financial performance of the following year. The final analysis used the CSR score of the year 2011 and its effect on the corresponding financial performance of the year 2012.
𝑅𝑂𝐸(𝑖|𝑡) = 𝛼 (𝑖) + 𝑎 ∗ 𝐶𝑆𝑅(𝑖|−𝑡) + b ∗ 𝑇𝑜𝑡𝑎𝑙 𝐴𝑠𝑠𝑒𝑡𝑠 (𝑖|−𝑡) + c ∗ 𝑅𝑒𝑔𝑖𝑜𝑛 + 𝑒(𝑖)
𝑛𝑒𝑡 𝑚𝑎𝑟𝑔𝑖𝑛(𝑖|𝑡) = 𝛼 (𝑖) + 𝑎 ∗ 𝐶𝑆𝑅(𝑖|−𝑡) + b ∗ 𝑇𝑜𝑡𝑎𝑙 𝐴𝑠𝑠𝑒𝑡𝑠 (𝑖|−𝑡) + c ∗ 𝑅𝑒𝑔𝑖𝑜𝑛 + 𝑒(𝑖)
In this test the control variables ‘Total Assets’ determined the size of the financial institution and ‘Region’ determined the market in which the financial institution operated, being either US or Europe.
CSR Certificates and Initiatives
David Verkerk ǀ 06.01.2014 27 To examine this relationship of certifications and initiatives with financial performance, a similar research method was used as in testing the correlation of CSR behaviour with financial performance. In this new test CSR behaviour was specified on the variable category developed through Scholtens (2008) revised model ‘Total Code of Ethics’, which embraces the participation level in CSR certificates and initiatives.
𝑅𝑂𝐸(𝑖|𝑡) = 𝛼 (𝑖) + 𝑎 ∗ 𝑇𝑜𝑡𝑎𝑙 𝐶𝑜𝑑𝑒 𝑜𝑓 𝐸𝑡ℎ𝑖𝑐𝑠(𝑖|−𝑡) + b ∗ 𝑇𝑜𝑡𝑎𝑙 𝐴𝑠𝑠𝑒𝑡𝑠 (𝑖|−𝑡) + c ∗ 𝑅𝑒𝑔𝑖𝑜𝑛 + 𝑒(𝑖)
𝑁𝑒𝑡 𝑀𝑎𝑟𝑔𝑖𝑛(𝑖|𝑡) = 𝛼 (𝑖) + 𝑎 ∗ 𝑇𝑜𝑡𝑎𝑙 𝐶𝑜𝑑𝑒 𝑜𝑓 𝐸𝑡ℎ𝑖𝑐𝑠(𝑖|−𝑡) + b ∗ 𝑇𝑜𝑡𝑎𝑙 𝐴𝑠𝑠𝑒𝑡𝑠 (𝑖|−𝑡) + c ∗ 𝑅𝑒𝑔𝑖𝑜𝑛 + 𝑒(𝑖)
Framework of CSR Measurement
The framework created by Scholtens (2008) was adapted with the purpose of assessing the level of CSR behaviour within every financial institution through a more transparent methodology. Scholtens argues that the framework does not rely on proprietary and costly information. Therefore, it overcomes the problem of using traditional CSR rating agencies by relying on a mix of rankings, certificates, and bank websites and reports. The framework is specifically developed for the financial industry through the inclusion of specific variables. The framework is divided into five independent groups measuring different aspects of CSR behaviour of financial institutions.
Code of ethics, sustainability reporting and environmental management Environmental management
Responsible financial products
Social conduct of the financial institutions Benchmarks measuring CSR behaviour
David Verkerk ǀ 06.01.2014 28
Adjustments of Conceptual Framework
The framework of Scholtens (2008) is a more transparent method of measuring CSR behaviour within the international financial industry, but it still has limitations. The main limitation is impreciseness when investigating the CSR behaviour level, which occurs due to imperfections in the framework design. In order to overcome this limitation and impart more nuances to the measuring code, specific levels of conduct were introduced to the framework. These additional variables are CERES, Global Reporting Initiative (GRI), additional sustainability audits, corruption statements, animal welfare statement, and human rights statement. These added variables were developed through the use of the Fair Bank Guide (Gelder et al., 2013). The newly developed GRI assessment tool evaluates the level of transparency of the sustainability reports, an initiative which is rapidly growing in popularity. A more comprehensive image was created through this and other variables related to the quality of sustainability reports and the transparency of financial institutions (Morhardt et al., 2002).
External CSR Rating
To extend the scope of the research further, various external CSR ranking agencies were included in the assessment to create a multi-level analysis of the potential differences in CSR behaviour between financial institutions operating on the European and US markets. CSRhub.com scores the CSR behaviour of various industries and companies based on community, employees, environment, and governance. CSRhub is freely accessible for use in primary analysis, making it a tool for potential consumers assessing financial institutions and their CSR behaviour.
David Verkerk ǀ 06.01.2014 29 company against their CSR behaviour. This measurement was only constructed for the last reported year 2012. Both CSR ranking agencies were used in this study to extract information for the period 2008-2012, a time span during which the majority of the sample was included within the CSR rating analysis provided by these agencies.
Scholtens (2008) CSRhub Asset4esg
V
ari
abl
e
C
at
e
g
o
ri
e
s
Social Conduct Community Social
Code Of Ethics Employees
Environmental
Management Environment Environmental
Responsible financial
products Governance Corporate Governance
Benchmark
David Verkerk ǀ 06.01.2014 30
Data Analysis
Introduction
This section presents the structure and results of the conducted data analysis. The first analysis examines the relationship between Scholtens (2008) revised framework and CSR behaviour in the US market and European market using Asset4esg and CSRhub.com. The second analysis explores the financial performance of the selected top 50 financial institutions and a potential relationship with their CSR behaviour. All analyses use SPSS statistics 21.
CSR Measurements
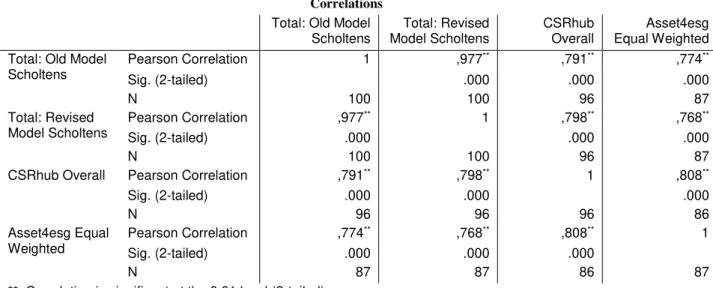
The primary analysis was conducted using a Pearson correlation test to measure the potential differences in rating between Scholtens (2008) framework and the revised framework as compared to the CSR frameworks developed by CSRhub and Asset4esg. The test is solely conducted for the year 2012 because of the limited applicability of the framework developed by Scholtens (2008). This limitation in time span results from the framework’s transparency, which requires recently available information.
David Verkerk ǀ 06.01.2014 31
Correlations
Total: Old Model
Scholtens
Total: Revised Model Scholtens
CSRhub Overall
Asset4esg Equal Weighted Total: Old Model
Scholtens
Pearson Correlation 1 ,977** ,791** ,774**
Sig. (2-tailed) .000 .000 .000
N 100 100 96 87
Total: Revised Model Scholtens
Pearson Correlation ,977** 1 ,798** ,768**
Sig. (2-tailed) .000 .000 .000
N 100 100 96 87
CSRhub Overall Pearson Correlation ,791** ,798** 1 ,808**
Sig. (2-tailed) .000 .000 .000
N 96 96 96 86
Asset4esg Equal Weighted
Pearson Correlation ,774** ,768** ,808** 1
Sig. (2-tailed) .000 .000 .000
N 87 87 86 87
**. Correlation is significant at the 0.01 level (2-tailed).
Table 2. Correlation analysis between the various CSR frameworks.
CSR in the US and European Market
Since there is no significant evidence for hypothesis 1, it is possible to include all four CSR measurement frameworks in the following analysis. However, as a result of the high Pearson correlation result between ‘Total: Old Model Scholtens’ and ‘Total: Revised Model Scholtens’, only ‘Total: Revised Model Scholtens’ is included in the following tests. This new revised model includes more variables, including the GRI. Since the Asset4esg only operates with an equal weighted variable for the year 2012 the analysis includes the variable environment. Before computing the means for the CSR rating frameworks and their relationship to region, a statistical exploration tests the level of normal distribution of the CSR ratings. Since the data set is smaller than 2000, a Shapiro-Wilk test is performed.
David Verkerk ǀ 06.01.2014 32
Tests of Normality
region Kolmogorov-Smirnova Shapiro-Wilk
Statistic df Sig. Statistic df Sig.
Total US .156 47 .006 .896 47 .001
Europe .141 39 .048 .958 39 .150
CSRhub Overall
US .100 47 ,200* .966 47 .184
Europe .167 39 .008 .945 39 .054
Asset4esg Equal Weighted
US .240 47 .000 .847 47 .000
Europe .257 39 .000 .660 39 .000
*. This is a lower bound of the true significance. a. Lilliefors Significance Correction
Table 3. Test for Normality for the various Rating Frameworks by Region.
Test Statistics
Total CSRhub Overall Asset4esg
Equal Weighted
Mann-Whitney U 491.500 566.000 512.500
Wilcoxon W 1766.500 1791.000 1640.500
Z -5.234 -4.298 -3.647
Asymp. Sig. (2-tailed) .000 .000 .000
a. Grouping Variable: region
Test Statisticsa
Total CSRhub
Overall Asset4esg Equal Weighted Most Extreme Differences
Absolute .540 .459 .388
Positive .540 .459 .388
Negative 0.000 -.020 0.000
Kolmogorov-Smirnov Z 2.700 2.248 1.805
Asymp. Sig. (2-tailed) .000 .000 .003
a. Grouping Variable: region
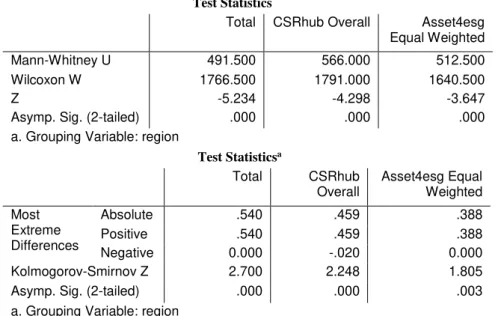
Table 4. Significant test for the various CSR frameworks by region.
The next stage in the analysis is to calculate the mean rank to determine which market displays a higher level of CSR behaviour. A Mann-Whitney U test is conducted by calculating a mean rank. The outcome shows a significantly higher mean rank in all three CSR rankings for the European market. This outcome indicates that for the year 2012 the financial institutions operating on the US market show a lower level of CSR behaviour (Table 5), supporting hypothesis 2.
Mean/Ranks
region N Mean Mean
Rank Std. Deviation Std. Error Mean Sum of Ranks Total: Revised Model Scholtens
US 50 142,600 35.33 969,917 137,167 1766.5
Europe 50 253,800 65.67 704,183 ,99586 3283.5
CSRhub Overall US 49 521,633 36.55 695,625 ,99375 1791
Europe 47 581,489 60.96 471,343 ,68753 2865
Asset4esg Equal Weighted
US 47 637,447 34.9 2,991,326 436,330 1640.5
Europe 40 840,250 54.69 1,772,075 280,190 2187.5
David Verkerk ǀ 06.01.2014 33 An additional analysis is conducted to investigate if this significant difference is evident for the whole 2008-2012 period. This test uses the measurement variables CSRhub total and Asset4esg environment. With the exception of the CSRhub total 2008 test, the measurements shows a significantly higher CSR level for financial institutions operating on the European market as compared to their counterparts in the US (appendix D).
In-depth CSR Behaviour analysis
David Verkerk ǀ 06.01.2014 34 category, Asset4esg social variable category and the total: responsible financial products variable category. Hypothesis 4 is, however, not supported since all three rating methods show no significantly higher scores for any variable category for the US related to social conduct.
Size and CSR behaviour
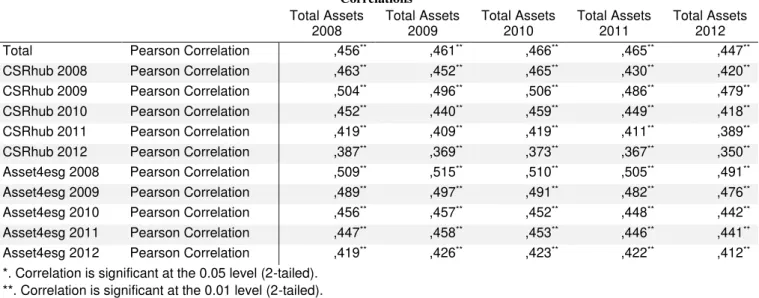
Company size, like region, could be an important influence on CSR behaviour. A primary statistical exploration is performed to test the distribution of total assets on their normality. A non-normal distribution is evident, similar to the CSR–region analysis (appendix F). A Pearson correlation test then shows a significant correlation between company size, characterised by total assets, and CSR score (Table 6).
Correlations
Total Assets 2008
Total Assets 2009
Total Assets 2010
Total Assets 2011
Total Assets 2012
Total Pearson Correlation ,456** ,461** ,466** ,465** ,447**
CSRhub 2008 Pearson Correlation ,463** ,452** ,465** ,430** ,420**
CSRhub 2009 Pearson Correlation ,504** ,496** ,506** ,486** ,479**
CSRhub 2010 Pearson Correlation ,452** ,440** ,459** ,449** ,418**
CSRhub 2011 Pearson Correlation ,419** ,409** ,419** ,411** ,389**
CSRhub 2012 Pearson Correlation ,387** ,369** ,373** ,367** ,350**
Asset4esg 2008 Pearson Correlation ,509** ,515** ,510** ,505** ,491**
Asset4esg 2009 Pearson Correlation ,489** ,497** ,491** ,482** ,476**
Asset4esg 2010 Pearson Correlation ,456** ,457** ,452** ,448** ,442**
Asset4esg 2011 Pearson Correlation ,447** ,458** ,453** ,446** ,441**
Asset4esg 2012 Pearson Correlation ,419** ,426** ,423** ,422** ,412**
*. Correlation is significant at the 0.05 level (2-tailed). **. Correlation is significant at the 0.01 level (2-tailed).
Table 6. Correlation analysis Total Assets-CSR behaviour (appendix G).
All years included in the test show correlations at levels lower than 0.01 significance. All samples included in the test show a positive Pearson correlation. These results support hypothesis 5: financial institutions with a higher level of total assets have a higher CSR score.
Exclusion of Outliers
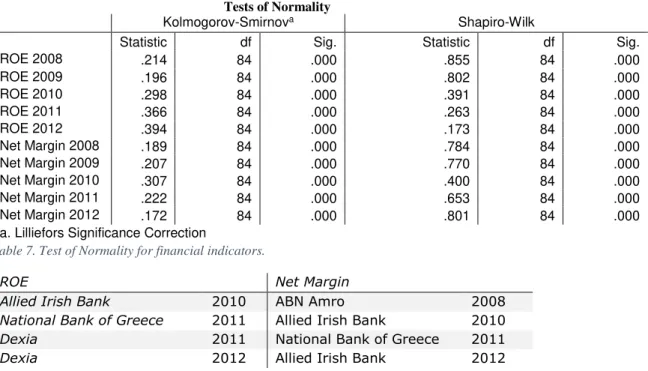
David Verkerk ǀ 06.01.2014 35 method for excluding these outliers. A clear non-normal distribution is evident for all financial performance indicators for the 2008-2012 period (Table 7).
Extreme results in certain years are possible due to the current economic climate and the susceptibility of the financial industry. Therefore, the design deletes the outliers that exceed four times the standard deviation. The sample is contaminated by a number of extreme values, which could potentially influence the outcome of the analysis (appendix H).The banks in Table 8 are excluded from the sample for specific years.
Tests of Normality
Kolmogorov-Smirnova Shapiro-Wilk
Statistic df Sig. Statistic df Sig.
ROE 2008 .214 84 .000 .855 84 .000
ROE 2009 .196 84 .000 .802 84 .000
ROE 2010 .298 84 .000 .391 84 .000
ROE 2011 .366 84 .000 .263 84 .000
ROE 2012 .394 84 .000 .173 84 .000
Net Margin 2008 .189 84 .000 .784 84 .000
Net Margin 2009 .207 84 .000 .770 84 .000
Net Margin 2010 .307 84 .000 .400 84 .000
Net Margin 2011 .222 84 .000 .653 84 .000
Net Margin 2012 .172 84 .000 .801 84 .000
a. Lilliefors Significance Correction
Table 7. Test of Normality for financial indicators.
ROE Net Margin
Allied Irish Bank 2010 ABN Amro 2008
National Bank of Greece 2011 Allied Irish Bank 2010
Dexia 2011 National Bank of Greece 2011
Dexia 2012 Allied Irish Bank 2012
Table 8. Financial institutions excluded from the analysis.
With these outliers deleted, the standard deviation shows a significant reduction (appendix I).
CSR Behaviour and Financial Performance
These initial financial analyses lead to a final partial correlation test to measure the correlation between CSR behaviour and financial performance, using region and company size as control variables. The primary analysis evaluates the relationship between CSR in year t-1 and the
correlation with the following year t. Eight testing moments are included in the analysis using
David Verkerk ǀ 06.01.2014 36 rating agencies (Table 10). For the profitability years, 2009 to 2011, the results show a positive correlation (Table 9, Table 11). For the year 2012, the results display a negative, non-significant correlation (Table 12). Therefore, hypothesis 6 is not supported because there is not consistent significant evidence that there is either a positive or negative correlation between CSR behaviour and ROE.
Correlations
Control Variables CSRhub 2008 Asset4esg 2008
Total Assets 2008 & region
ROE 2009 Correlation .240 .337
Significance (2-tailed) .052 0,006**
df 64 64
Net Margin 2009
Correlation .188 .311
Significance (2-tailed) .132 0,011*
df 64 64
Table 9. Partial correlation analysis CSR behaviour - ROE/net margin 2009.
Correlations
Control Variables CSRhub 2009 Asset4esg 2009
Total Assets 2009 & region
ROE 2010 Correlation .241 .362
Significance (2-tailed) 0,040* 0,002**
df 71 71
Net Margin 2010
Correlation .140 .309
Significance (2-tailed) .238 0,008**
df 71 71
Table 10. Partial correlation analysis CSR behaviour - ROE/net margin 2010.
Correlations
Control Variables CSRhub 2010 Asset4esg 2010
Total Assets 2010 & region
ROE 2011 Correlation .124 .064
Significance (2-tailed) .275 .578
df 77 77
Net Margin 2011
Correlation .082 .045
Significance (2-tailed) .473 .695
df 77 77
Table 11. Partial correlation analysis CSR behaviour - ROE/net margin 2011.
Correlations
Control Variables CSRhub 2011 Asset4esg 2011
Total Assets 2011 & region
ROE 2012 Correlation -.091 -.006
Significance (2-tailed) .423 .957
df 77 77
Net Margin 2012
Correlation -.204 -.128
Significance (2-tailed) .071 .261
df 77 77
Table 12. Partial correlation analysis CSR behaviour - ROE/net margin 2012.
David Verkerk ǀ 06.01.2014 37 not possible to support hypothesis 7. An additional analysis investigates the potential positive correlation between financial performances in t-1 on the CSR score in t (appendix J). Again,
there are similar results to the relationship between CSR t-1 on financial performance in year t.
Although a few years display a significant positive correlation, such a relationship is not evident for the whole sample; therefore, the additional hypothesis is not supported.
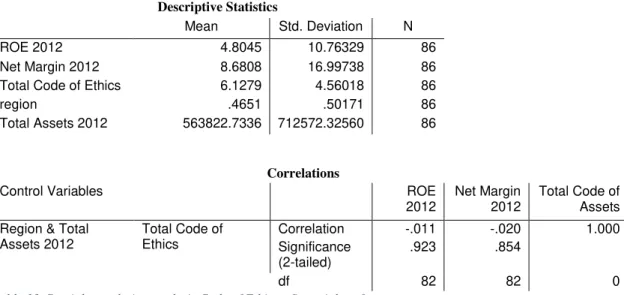
CSR Certificates and Initiatives
Financial institutions limit themselves in their investment choices by adopting certain CSR certificates and initiatives. However, these financial institutions can present their CSR certificates and initiatives to potential customers, leading to a possible increase in revenue and profitability.
Descriptive Statistics
Mean Std. Deviation N
ROE 2012 4.8045 10.76329 86
Net Margin 2012 8.6808 16.99738 86
Total Code of Ethics 6.1279 4.56018 86
region .4651 .50171 86
Total Assets 2012 563822.7336 712572.32560 86
Correlations
Control Variables ROE
2012
Net Margin 2012
Total Code of Assets Region & Total
Assets 2012
Total Code of Ethics
Correlation -.011 -.020 1.000
Significance (2-tailed)
.923 .854
df 82 82 0
Table 13. Partial correlation analysis Code of Ethics - financial performance.
David Verkerk ǀ 06.01.2014 38
CSR Behaviour
David Verkerk ǀ 06.01.2014 39
Discussion
Introduction
The central objective of this research is to investigate the CSR behaviour of financial institutions operating on US and European markets, and the potential positive relationship of CSR behaviour on financial performance in this industry. The primary analyses of CSR practices and region reveal a significant difference between the European and US markets. The second analyses on the topic of CSR behaviour and profitability demonstrates mixed results, which do not provide a clear outcome. The results bring to question the necessity for a transparent CSR measurement framework specific to the financial industry as designed by Scholtens (2008). This section summarises and interprets the findings, with a particular discussion of the validity of these results. The methods of CSR measurements are re-evaluated.
Validity of Scholtens (2008) Framework
This study first analysed the difference in outcome between the various CSR measurement practices. Scholtens (2008) developed a framework specifically for the financial industry, which framework promised more transparency in collecting measurements. The correlation with the CSRhub (0.791) and Asset4esg (0.774), however, calls to question the necessity of such a framework. The CSRhub is freely accessible and provides the same information in a less time intensive manner. The arguments of Scholtens (2008), such as the necessity of a more transparent method that avoids costly and proprietary information, are logical; yet, the need and added value of such a framework is not clear.
The Transatlantic Separation
David Verkerk ǀ 06.01.2014 40 American and European markets. This study displays a strong distinction between the CSR behaviour in Europe and the US, in which the increase in CSR behaviour is more rapid in the European financial industry. In 2008 the US was still the leader in various CSR variable categories; by 2012 it had lost its leading position, and a significant difference existed between the two regions (Table 5, appendix D, appendix E). Various measurements, such as emission levels, investment policies, and governance structures, were initialised through regulatory pressure (Haigh & Jones, 2006; Roberts, 1992). The same trend is evidenced by tallying the number of CSR banks in Europe and America (Snyder & Zeijden, 2013). CSR efforts in Europe go far beyond the demand of governments and appear to be responses to consumer demand contributing to the stakeholder analyse performed by Roberts (1992).
David Verkerk ǀ 06.01.2014 41 Hartman, Rubin, & Dhanda, 2007). An exception is made for European financial institutions that also operate on the US market.
The scores of CSR behaviour using various rating methods reveals the US financial industry to score lowest in all categories. The higher scores in the US financial industry are generally achieved by financial institutions that also operate on the European market (JP Morgan & Chase, Citigroup), have an foreign parent company (HSBC, Bank of the West, Citizens, RBS and Santander), or that have a Canadian origin (Bank of Montreal, Toronto-Dominion Bank)(Appendix K).
It is most likely that the rapid shift towards a more sustainable business approach in Europe and the slower trend evident on the US market is a combination of regulatory pressure and consumer demand (Kesidou & Demirel, 2012; Popp, Hafner, & Johnstone, 2011). In this trend every region has to make its own decision on its approach toward sustainability, whether that is financial sustainability or environmental sustainability.
The Financial Impact of CSR Behaviour
David Verkerk ǀ 06.01.2014 42 correlation between company size and reputational risk score. In these cases, a higher score indicates a higher reputational risk when collaborating with these financial institutions, and thus a lower CSR behaviour score (appendix L). When comparing the various CSR calculation methods, the potential for bias becomes evident. Large companies are more likely to be linked to negative publicity that harms their CSR image, while they also possess the resources to participate or buy CSR certificates and initiatives, which can increase their CSR rating. Consequently, CSR studies should always include various CSR rating frameworks to avoid these biases.
David Verkerk ǀ 06.01.2014 43 in this research use a yes/no evaluation. The Bank of America, for instance, excludes investments in the coal sector because of its commitment to sustainable energy. Yet, that bank invests in atomic bombs (Snyder & Zeijden, 2013). The same phenomenon is evident for PNB Paribas, which does not invest in products containing PCBs or asbestos but does invest in atomic weapons (Snyder & Zeijden, 2013). Evaluating CSR behaviour may need more complexity.
David Verkerk ǀ 06.01.2014 44
Conclusion
Theoretical Contributions
Theoretical contributions of this study can be divided into three parts, with the first being an evaluation of the CSR measurement framework of Scholtens (2008). The second part focusses on the field of CSR behaviour in the US and European financial industries. The final part discusses the theoretical contributions made to discussions about the potential relationship between CSR behaviour and financial performance.
6.1.1 Transparent CSR measurement methodologies
The first hypothesis of this study investigates differences in scores created by the CSR measurement framework designed by Scholtens (2008), a revised model of this framework, and two independent CSR rating agencies. The results gave a strong significant correlation between the four methods of measuring CSR behaviour. Therefore, the framework developed by Scholtens (2008) and the revised model gave no added value over the existing CSR rating agencies. The validity of Scholtens (2008) framework is confirmed since it indeed measures the CSR behaviour of financial industries. Yet, there is no convincing reason to adopt this framework, as it is limited to a single time analysis and displays the same results as the CSRhub and Asset4esg. Rather, using existing, low-cost CSR rating agencies will give comparable results with a more in-depth analysis. Scholtens’ call for a more transparent method does not lead to differences in results of the CSR behaviour score. His proposition for a non-proprietary, transparent method of measuring CSR behaviour could be used for future CSR measurement constructs.
6.1.2 The Transatlantic Debate
David Verkerk ǀ 06.01.2014 45 Ralston, 2002; Sotorrío & Sánchez, 2008; Tschopp, 2005). This research applies CSR measurements to specifically the financial industry. Although previous studies have included the financial industry in their samples, this study exclusively focusses on the financial industry. Due to the intermediary role of financial industry in modern society, it significantly influences the way society approaches CSR. As Jeucken (2002) already stated in his work, the financial industry plays a fundamental role for society to reach a sustainable environment. The difference in CSR behaviour within the financial industry provides an explanation for differences in CSR behaviour in other industries operating in the same market and could been seen as evidence for the stakeholder theory (Freeman, 1999; Roberts, 1992) and work by Matten and Moon (2008) investigating the difference between implicit and explicit CSR behaviour.
A significant difference in CSR behaviour was shown in various studies, including this research; however, this difference in CSR behaviour was not specified for financial segments. More extensive analysis of these differences would give a better understanding of CSR behaviour in the two investigated markets. CSR has different meanings in different regions (Sotorrío & Sánchez, 2008; Steurer, 2010; Tschopp, 2005), which could be better understood by investigating the specific CSR behaviours.
6.1.3 The CSR – Financial Performance Debate
David Verkerk ǀ 06.01.2014 46 performance was found. This finding is not reported in any previous academic work. This finding gives tentative support for the theory of Friedman (1970) as the use of CSR certificates and initiatives leads to lower financial performance. That relationship might be due to the higher costs and limitations related to CSR behaviour.
Managerial Contributions
The growing accessibility of CSR measurement methodologies limits the necessity for a more
transparent CSR measurement methodology. The accessibility of the CSRhub and Asset4esg
removes the necessity for a framework such as developed by Scholtens (2008). The results
indicate a significant difference between the European and US financial industries in CSR,
which conclusion gives a better guideline for managers who would like to adjust their internal
strategy towards a more CSR based model. Ribstein’s (2005) theory of the use of CSR
behaviour for strategy purposes is the directive for this behaviour. Managers can find support
in this research whether their aims be toward opting a more CSR behaviour based strategy or
pursuing a less CSR behaviour based strategy. The research displays mixed results concerning
the relationship between CSR behaviour and financial performance thereby giving no definitive
solution on the CSR-profitability debate.
Limitations and Future Research
This study contributes to several academic and managerial discussions in the field of CSR behaviour in the financial industry. The scope of this research is, however, hampered by several limitations, which offer opportunities for future research.
David Verkerk ǀ 06.01.2014 47 assessment can be made on the completion of the framework by conducting further research while using the same framework in relationship with potential additives.
A second limitation is the sample size of 100 financial institutions. With the intention of creating a better understanding of the relationship between CSR behaviour and financial performance, the research scale should be increased by using a greater number of financial institutions. A supplementary addition to the scope of the research would be to expand the research setting to include Asia, which has experienced rapid growth in the financial industry over the last decade.
A third limitation is how CSR behaviour is measured. Due to limitations in the model, it is impossible to measure the exact level of CSR behaviour. Financial institutions offering 20 sustainable products receive the same score as financial institutions offering one sustainable product. This limitation should be avoided in the future through the development of more complex CSR measurement frameworks.
The fourth and final limitation is the accessibility of financial information. The research was hindered by the limited accessibility to financial information of private financial institutions. By reconstructing the same research in a setting that has better access to financial information the results will be more accurate and convincing. This would be the most valuable recommendation for future research in regards to transparency in CSR behaviour and financial performance. This complex and interesting field of research should be further developed to gain better understanding of the potential relationship between CSR behaviour and financial performance.
Summary
David Verkerk ǀ 06.01.2014 48 performance. To this end, a convenience sample consisting of the 100 largest financial institutions operating on the US and European markets was used.
A primary analysis of the difference between various CSR measuring methodologies displayed high levels of correlation. This finding brings to question the need of a transparent CSR measuring framework specific for the financial industry. Further analyses indicated a significant difference between the US and European markets. These findings agreed with the literature on this topic, which included various theories about the reason of this difference. The research intension was to explore specific differences between the two markets. To that end, both the time period 2008-2012 and different variable categories were used to assess the CSR score by several CSR rating methodologies. The analysis displayed a significant difference between the two markets in almost all variable categories, with the exception of corporate governance. All analyses displayed a higher score in CSR behaviour for the financial institutions operating on the European market in the year 2012, rising from a lower score in 2008.
David Verkerk ǀ 06.01.2014 49
List of References
Abbott, W. & Monsen, R. (1979). On the measurement of corporate social responsibility: self-reported disclosures as a method of measuring corporate social involvement. Academy of Management Journal, 22(3), 501–515.
Aebi, V. Sabato, G., & Schmid, M. (2012). Risk management, corporate governance, and bank performance in the financial crisis. Journal of Banking & Finance, (2010), 1–38.
Ahmed, S. U., Islam, Z. & Hasan, I. (2012). Corporate social responsibility and financial performance linkage. Journal of Organizational Management, 1(1), 14–21.
Alexander, G. & Buchholz, R. (1978). Corporate social responsibility and stock market performance. Academy of Management Journal, 21(3), 479–486.
Barigozzi, F. & Tedeschi, P. (2011). Credit Markets with Ethical Banks and Motivated Borrowers. Working Paper Quaderni.
Bolton, B. (2012). Corporate Social Responsibility and Bank Performance.
Carnevale, C., Mazzuca, M. & Venturini, S. (2012). Corporate social reporting in European banks: the effects on a firm’s market value. Corporate Social Responsibility and Environmental Management, 177(May 2011), 159–177.
Cowton, C. & Thompson, P. (2001). Financing the social economy: a case study of Triodos Bank. International journal of nonprofit and Voluntary Sector Marketing, 6(2), 145–155.
Cuesta-González, M., Muñoz-Torres, M. J. & Fernández-Izquierdo, M. Á. (2006). Analysis of Social Performance in the Spanish Financial Industry Through Public Data. A Proposal.
Journal of Business Ethics, 69(3), 289–304.
Dash, R. N. (2008). Sustainable Banking : The Story of Triodos Bank, 26–29.
Dingwerth, K. (2010). Tamed Transparency : How Information Disclosure under the Global Reporting Initiative Fails to Empower Tamed Transparency : How Information Disclosure under the Global Reporting Initiative Fails to Empower. Global Environmental Politics, 10(3), 74–96.
Doh, J. & Guay, T. (2006). Corporate Social Responsibility, Public Policy, and NGO Activism in Europe and the United States: An Institutional‐Stakeholder Perspective. Journal of Management Studies, 43(1).
Freeman, R. E. (1999). RESPONSE: DIVERGENT STAKEHOLDER THEORY. The Academy of Management Review, 24(2), 233–236.
David Verkerk ǀ 06.01.2014 50 Fry, J. & Shaw, D. (1973). Customer loyalty to banks: a longitudinal study. The Journal of
Business, 46(4), 517–525.
Gelder, J. W. van, Herder, A. & Verhoef, K. (2013). Eerlijke Bankwijzer 13e update (p. 234).
Gill, D., Dickinson, S. & Scharl, A. (2008). Communicating sustainability: a web content analysis of North American, Asian and European firms. Journal of Communication …, 12(3), 243–262.
Gjølberg, M. (2009). Measuring the immeasurable? Scandinavian Journal of Management, 25(1), 10–22.
Griffin, J. & Mahon, J. (1997). The corporate social performance and corporate financial performance debate. Business and Society, 36(1).
Haigh, M. & Jones, M. (2006). The drivers of corporate social responsibility: a critical review, (i), 1–9.
Hallowell, R. (1996). The relationships of customer satisfaction, customer loyalty, and profitability: an empirical study. International Journal of Service Industry Management, 7(4), 27–42.
Hart, S. (2010). Capitalism at the Crossroads: Next generation Business strategies for a Post-Crisis world (Third Edit., p. 322). Wharton School Publishing.
Hartman, L. P., Rubin, R. S. & Dhanda, K. K. (2007). The Communication of Corporate Social Responsibility: United States and European Union Multinational Corporations. Journal of Business Ethics, 74(4), 373–389.
Herzig, C. & Moon, J. (2011). Corporate Social Responsibility, the Financial Sector and Economic Recession. Financial Services Research Forum.
Homburg, C., Koschate, N. & Hoyer, W. (2005). Do satisfied customers really pay more? A study of the relationship between customer satisfaction and willingness to pay. Journal of Marketing, 69(April), 84–96.
Jeucken, M. (2002). Banking and sustainability: slow starters are gaining pace. Ethical Corporation Magazine, 4(4), 497–505.
Kesidou, E. & Demirel, P. (2012). On the drivers of eco-innovations: Empirical evidence from the UK. Research Policy, 41(5), 862–870. doi:10.1016/j.respol.2012.01.005
Maignan, I. & Ferrell, O. (2000). Measuring corporate citizenship in two countries: The case of the United States and France. Journal of Business Ethics, 23, 283–297.
Maignan, I. & Ralston, D. (2002). Corporate social responsibility in Europe and the US: Insights from businesses self-presentations. Journal of International Business …, 33(3),