Official Journal of the Brazilian Psychiatric Association Volume 34 • Number 4 • December/2012
Psychiatry
Revista Brasileira de Psiquiatria
Abstract
Objective: Major Depressive Disorder (MDD) is a debilitating condition with a marked social impact. The impact of MDD and Treatment-Resistant Depression (TRD+) within the Brazilian health system is largely unknown. The goal of this study was to compare resource utilization and costs of care for treatment-resistant MDD relative to non-treatment-resistant depression (TRD-).
Methods: We retrospectively analyzed the records of 212 patients who had been diagnosed with
MDD according to the ICD-10 criteria. Speciic criteria were used to identify patients with TRD+.
Resource utilization was estimated, and the consumption of medication was annualized. We obtained information on medical visits, procedures, hospitalizations, emergency department visits and medication use related or not to MDD. Results: The sample consisted of 90 TRD+ and 122
TRD- patients. TRD+ patients used signiicantly more resources from the psychiatric service, but
not from non-psychiatric clinics, compared to TRD- patients. Furthermore, TRD+ patients were
signiicantly more likely to require hospitalizations. Overall, TRD+ patients imposed signiicantly
higher (81.5%) annual costs compared to TRD- patients (R$ 5,520.85; US$ 3,075.34 vs. R$ 3,042.14;
US$ 1,694.60). These indings demonstrate the burden of MDD, and especially of TRD+ patients, to the tertiary public health system. Our study should raise awareness of the impact of TRD+
and should be considered by policy makers when implementing public mental health initiatives.
Treatment-resistant depression increases
health costs and resource utilization
Beatrice Alinka Lepine,
1Ricardo Alberto Moreno,
2Rodolfo Nunes Campos,
3Bernard François Couttolenc
11Faculdade de Saúde Pública, Universidade de São Paulo, Brazil
2Director, Mood Disorders Unit (GRUDA), Department of Psychiatry, Faculdade de Medicina, Universidade de São Paulo, Brazil 3Researcher, Mood Disorders Unit (GRUDA), Department of Psychiatry, Faculdade de Medicina, Universidade de São Paulo, Brazil
Received on February 2, 2011; accepted on May 11, 2012
DESCRIPTORS:
Depression;
Treatment Resistance; Resource Utilization; Treatment Costs; Hospital Costs.
ORIGINAL ARTICLE
Corresponding author: Ricardo A Moreno. Mood Disorder Unit (GRUDA). Department of Psychiatry, Faculdade de Medicina,
Universidade de São Paulo, Brazil. Rua Dr. Ovidio Pires de Campos 785. PO Box 3671, 05403-010 SP – Brazil. Phone: (+55 11) 30696648. Fax: (+55 11) 30697894.
E-mail: [email protected]
Depressão resistente ao tratamento aumenta os custos e utilização de recursos
Resumo
Objetivo: O Transtorno Depressivo Maior (TDM) é uma condição debilitante com um forte impacto social. O impacto do TDM e Depressão Resistente ao Tratamento (DRT+) no sistema de saúde brasileiro é praticamente desconhecido. Nosso objetivo é comparar a utilização de recursos e custos dos cuidados para o tratamento de DRT+ em relação ao TDM não resistente (DRT-). Métodos: Foram analisados retrospectivamente os prontuários de 212 pacientes diagnosticados com TDM
segundo a CID-10. Critérios especíicos foram utilizados para identiicar pacientes com DRT+. A utilização dos recursos foi estimada e consumo de medicamentos foram anualizados. Foram obtidas informações sobre consultas, procedimentos, internações, atendimentos no serviço de emergência e uso de medicação relacionada ou não ao TDM. Resultados: A amostra foi composta
de 90 pacientes DRT+ e 122 DRT-. Pacientes DRT+ utilizaram signiicativamente mais recursos do serviço de psiquiatria, mas não em clínicas não psiquiátricas, em relação a DRT-. Eles eram signiicativamente mais propensos a exigir internações. Pacientes DRT+ apresentaram um custo direto anual signiicativamente maior (81,5%) do que pacientes com depressão não resistente
(R$ 5.520,85; US$ 3.075,34 contra R$ 3.042,14, US$ 1.694,60). Estes resultados demonstram o
impacto do TDM, principalmente da DRT+ ao sistema de saúde público terciário. Nosso estudo deve aumentar a sensibilização para o impacto da DRT + e deve ser considerado pelos formuladores de políticas públicas na implementação de iniciativas de saúde mental.
DESCRITORES:
Depressão; Resistência ao tratamento;
Utilização de recursos;
Custos de tratamento; Custos hospitalares.
Introduction
Major depressive disorder (MDD) is a chronic condition with
a point-prevalence of approximately 4%1 and a 1-year
preva-lence ranging from 7%-10%.1-4 Approximately 17% of North
Americans and Europeans have had at least one depressive episode in their lifetime.2,3,5 MDD is a highly debilitating
con-dition, imposing a considerable economic burden upon suf-ferers and upon society.6 The economic burden of depression
has been estimated in several studies worldwide. In fact, MDD is associated with higher costs than diseases such as asthma, osteoporosis, arterial hypertension and schizophrenia. The treatment-related costs (direct costs) of MDD to the United
States in 1990 were approximately US$ 12.4 billion, whereas
the costs due to the loss of productivity (indirect costs) were US$ 31.3 billion.8 In addition, costs increased from US$ 77.4 billion in 2000 to US$ 83.1 billion in 2010 (inlation-adjusted
US dollars).9
A systematic review of cost-of–illness studies for
depression published worldwide indicated direct costs ranging from US$ 1,000 to US$ 2,500 per patient/year in 2003 inflation-adjusted US dollars; costs associated with morbidity ranging from US$ 2,000 to US$ 3,700; and finally, costs associated with mortality in the range of US$ 200 to US$ 400.10 In 2004, the total annual cost
of depression in Europe was estimated to be around € 118 billion, or € 253 per capita. Indirect costs were estimated at € 76 billion. Accordingly, depression is the most costly neuropsychiatric disorder in Europe,
account-ing for approximately 1% of the total European GDP (Gross National Product).11
Over half of the patients with a major depressive disorder episode eventually experience a second episode; 80% to 90%
of those who had at least two episodes will have subsequent
recurrences.12 Despite available pharmacological and
non-pharmacological treatments, as many as 30% of patients with
MDD do not respond to their irst antidepressant therapy.12,13,14
Indeed only 20 to 40% of the treated MDD patients achieve full remission.15 More conservative estimates report that 10 to
20% of the patients with MDD become resistant to multiples forms of therapy.17,18 Patients with treatment-resistant
de-pression (referred herein as TRD+) have a higher number of medical visits, increased rates of hospitalization, and higher use of psychotropic medications compared to patients with non-treatment resistant MDD (TRD-).12,19,20,21 It is suggested
that resistance to treatment is the main factor determin-ing the economic burden of depression, rather than MDD severity.22
Epidemiological data on the prevalence of MDD and TRD+ are scarce in Brazil, and economic data are almost
nonexistent. The Brazilian multicentric study of psychiatric
morbidity estimated that the 1-month prevalence of depres-sive disorders ranged from 1.9% to 10.2% in different Brazilian regions.23 A second study found a 1-month prevalence of 4.5%,
1-year prevalence of 7.1%, and lifetime prevalence of 16.8%.24 The Longitudinal Investigation of Depression Outcomes (LIDO)
study estimated the resource utilization costs of primary
care subjects with depression in six international sites, in -cluding in Porto Alegre, Brazil.25
Method
Data source and sample
This retrospective 5-year study examined the medical
records of patients seen from July 1997 to June 2002 at the Psychiatric Institute of the Clinics Hospital, School of Medicine, University of Sao Paulo, Brazil.
Our sample consisted of patients aged 18 years or older with
MDD according to the ICD-10 (F32.0, F32.1, F32.2, F32.3, F32.8, F32.9, F33.0, F33.1, F33.2, F33.3, F33.4, or F33.8, F33.9). To be included in this analysis, patients had to be followed for at least 6 months in the hospital, as recommended by the World
Health Organization (WHO).26 Patients were excluded from
the study if they had comorbid psychosis and/or if they were enrolled in a clinical trial during the study period.
The charts of eligible patients were reviewed, and demo-graphic data, clinical characteristics, and resource utilization
in the past ive years were collected. Demographics included
age, gender, marital status, occupational status and education level. Clinical characteristics included psychiatric and medi-cal comorbidities and the duration of depression treatment. Missing demographic data were supplemented with informa-tion from the hospital statistics department database.
Deinition of treatment resistance
In this study, TRD+ was deined using the algorithm proposed
by Corey-Lisle et al.19 Accordingly, patients in this study were
required to have at least one of the following between July 1997 and June 2002:
1. MDD treated with electroconvulsive therapy (ECT) or
requiring the use of monoamine oxidase inhibitors (MAOI), or;
2. Patients who met both the criteria for the TRD scale and
TRD matrix, as follows:
a. TRD scale (TRD+ when score ≥ 5):
• Augmentation with a mood stabilizer (score of 1) and/or with an antipsychotic (score of 1); scores ranging from 0 to 2.
• Number of switches among antidepressants over
a 5 year period, relative to the switching pattern of all MDD patients in the sample. Patients in the bottom quartile were scored as 0, with increas-ing scores until the top quartile (score of 3). • Number of antidepressant up-titrations over the
5 years relative to those of the whole MDD sam-ple (by quartiles, scores ranging from 0 to 3). b. TRD matrix:
• Three or more drug switches, or at least 2 switches and 2 antidepressant up-titrations across the 5 years of data collection.
MDD patients not meeting the criteria for TRD+ were considered non-resistant to treatment (TRD-).
Resource utilization and health care costs
Resource utilization and health care costs were estimated by measuring all of the health care products and services used
by individuals with TRD+ and TRD- over a ive-year period
as per the hospital medical records. Because patients in the sample had varied follow-up times (from 6 months to 5 years), the amount of resources utilized by each patient was divided by their respective follow-up time. For each variable, we calculated the medium monthly consumption/use, which was then annualized. We obtained data on hospitalizations, emergency department visits, outpatient costs for medical visits and procedures in the psychiatric units as well as in other clinics of the hospital, and the costs of all prescribed medication (regardless of whether they were provided by the public healthcare system or purchased by patients), and therapeutic procedures. Costs were calculated in Brazilian Reais (R$) and US Dollars (US$) as of March 2010. We used the market value for each resource. Market value was used instead of the public health system database
because the latter values are artiicially low and misleading
with respect to the true costs of procedures.
The cost of medical visits, procedures and laboratory or imaging tests were estimated by the Brazilian Medical
Association – AMB (1992). This list establishes the payment coeficient rates (ixed) that are applied to each procedure to give the inal value. The cost of each coeficient was periodically readjusted to account for inlation and to avoid distortions. At the time of the estimation, coeficients were
rated as R$ 0.29. When procedures were not found in this list, we estimated the costs using the list of the School of Medicine Foundation from 2010 or the 2003 values corrected
by the National Consumer Price Index (IPCA).
For medications, costs were calculated using the Brazilian Pharmaceutical Guide (March 2010) or the 2003 values
cor-rected by the National Consumer Price Index (IPCA).
Dental procedures were estimated using the Brazilian Dentistry Association list of procedures. Because nurse visits were not listed in the AMB list of procedures, they were val-ued as a proportion of the cost of a medical visit considering the hourly wage rates paid by the São Paulo State Secretary of
Health to physicians and nurses. Other professional visits and
activities not reimbursed by health plans were not included in the calculations. Disposable materials were also not included in our calculation, as medical records do not list them.
Sample size calculation and statistical analyses
Because one of our aims was to compare groups of TRD+ and TRD- MDD, we estimated the minimum sample size for TRD+ as 36 patients to detect cost differences of 0.5 standard
de-viations (SD) between both groups. Signiicance levels of 5%
and a power of 90% were considered. The most conservative estimate for TRD proportion (15%) was used17 to calculate
the total sample size of 240 patients.
We identiied 865 patients who were seen in June 2002
and treated for at least 6 months. Patients were selected by systematic sampling of medical charts with a random starting
point (irst name of patient list in alphabetical order) and
sampling interval = 4, generating 217 potential participants. Because our preliminary chart review indicated that a large proportion of subjects did not meet the eligibility criteria, we repeated the above described procedure. A total of 559 patients were selected, and 212 were considered eligible.
categorical variables, the parametric Student t-test for nor-mally distributed continuous variables or the non-parametric Mann-Whitney test for non-normally distributed continuous
variables. Normality was assessed with the
Kolmogorov-Smirnov test, and the homogeneity of variance was tested with Levene's test.
This study was approved by the Ethics Committees of the Clinics Hospital and the Faculdade de Saúde Pública - Universidade de São Paulo. All forms and databases were
de-identiied; patients were identiied in the database
by their initials and a sequential number to protect their
conidentiality.
Results
Sample characteristics
Our sample consisted of 212 patients with MDD; 90 (42.5%)
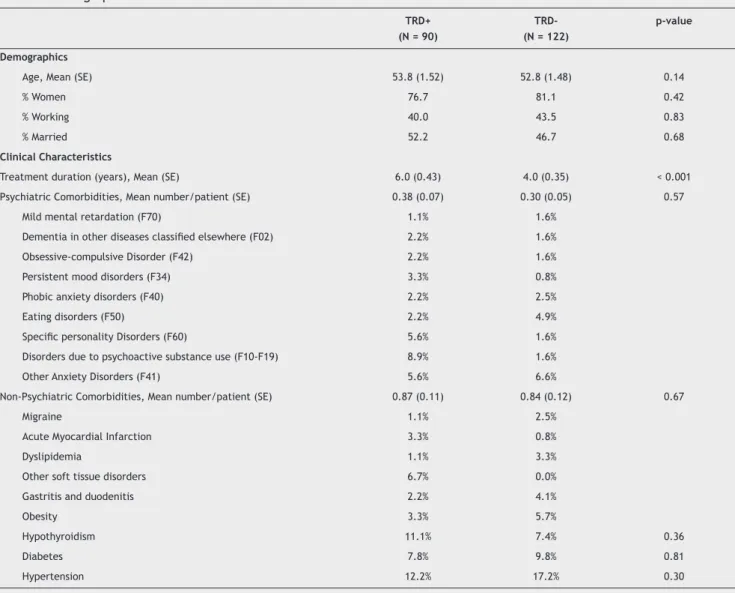
met the criteria for TRD-. Table 1 summarizes the demo-graphics and clinical characteristics per patient group. TRD+
and TRD- patients were not signiicantly different regarding
gender (p = 0.42), age (p = 0.14), race (p = 0.08), education (p = 0.94), marital status (p = 0.68) and employment
status (p = 0.83). Overall, most patients were women (79.2%),
older than 40 (79.2%), with at least some high school educa-tion (58.5%), married (50.5%), and working at the time of the study (42.0%).
The mean treatment time for TRD+ patients was 6
years, which was signiicantly longer when compared with
TRD- patients (4 years, p < 0.001). Psychiatric comorbidity
was similar between groups (0.38 vs. 0.30, NS). In fact,
depression was the only psychiatric diagnosis in nearly 70% of the patients, regardless of MDD status. The most frequent non-psychiatric comorbidities were hypertension (15.1%), diabetes (9.4%) and hypothyroidism (7.6%), with no differ-ences between TRD+ and TRD- patients.
Resource utilization
Table 2 lists the resource utilization by patients with TRD+ and TRD-. In the psychiatric clinic, the mean number of annual psychiatric outpatient visits was not
Table 1 Demographic and clinical characteristics
TRD+ (N = 90)
TRD- (N = 122)
p-value
Demographics
Age, Mean (SE) 53.8 (1.52) 52.8 (1.48) 0.14
% Women 76.7 81.1 0.42
% Working 40.0 43.5 0.83
% Married 52.2 46.7 0.68
Clinical Characteristics
Treatment duration (years), Mean (SE) 6.0 (0.43) 4.0 (0.35) < 0.001
Psychiatric Comorbidities, Mean number/patient (SE) 0.38 (0.07) 0.30 (0.05) 0.57
Mild mental retardation (F70) 1.1% 1.6%
Dementia in other diseases classiied elsewhere (F02) 2.2% 1.6%
Obsessive-compulsive Disorder (F42) 2.2% 1.6%
Persistent mood disorders (F34) 3.3% 0.8%
Phobic anxiety disorders (F40) 2.2% 2.5%
Eating disorders (F50) 2.2% 4.9%
Speciic personality Disorders (F60) 5.6% 1.6%
Disorders due to psychoactive substance use (F10-F19) 8.9% 1.6%
Other Anxiety Disorders (F41) 5.6% 6.6%
Non-Psychiatric Comorbidities, Mean number/patient (SE) 0.87 (0.11) 0.84 (0.12) 0.67
Migraine 1.1% 2.5%
Acute Myocardial Infarction 3.3% 0.8%
Dyslipidemia 1.1% 3.3%
Other soft tissue disorders 6.7% 0.0%
Gastritis and duodenitis 2.2% 4.1%
Obesity 3.3% 5.7%
Hypothyroidism 11.1% 7.4% 0.36
Diabetes 7.8% 9.8% 0.81
Hypertension 12.2% 17.2% 0.30
Table 2 Annual resource utilization
TRD+ TRD- p-value
Psychiatry, outpatient
Medical Visits
Mean (SE) 10.56 (0.53) 9.74 (0.44)
Median 9.50 8.70 0.12
Psychotherapy
Mean (SE) 0.05 (0.04) 0.28 (0.20)
Median 0.00 0.00 **
Diagnostic Tests
Mean (SE) 8.71(1.03) 7.02 (1.18)
Median 6.40 0.40 < 0.001
ECT
Mean (SE) 1.15 (0.47) -
Median 0 -
-Medications
Mean (SE) 1.73 (0.11) 1.49 (0.12) 0.01
Median
Other Clinics, outpatient
Medical Visits, Mean (SE) 0.30 (0.11) 0.35 (0.11) 0.84
Diagnostic Tests, Mean (SE) 0.70 (0.40) 0.79 (0.26) 0.26
Procedures, Mean - 0.00
-Medications, Mean (SE) 0.44 (0.07) 0.42 (0.09) 0.01
Emergency Department
Medical Visits, Mean (SE) 0.01 (0.001) 0.02 (0.001) **
Diagnostic Tests - 0.00
-Procedures - 0.00
-Medications - 0.00
-Inpatient Stay
Hospitalizations, Mean (SE) 0.09 (0.02) 0.05 (0.02) 0.009
Inpatient Days, Mean (SE) 3.53 (0.12) 1.72 (0.08) 0.22
Length of Stay* (days), Mean (SE) 37.6 (7.3) 51.4 (24.2) 0.32
Medical Visits, Mean (SE) 2.79 (0.09) 0.77 (0.03) 0.16
Other Visits, Mean (SE) 0.15 (0.06) 0.24 (0.19)
-Nurse Care, Mean (SE) 10.32 (3.10) 1.35 (0.71) 0.50
Diagnostic Tests, Mean (SE) 1.82 (0.05) 0.66 (0.03) **
Procedures, Mean (SE) 0.52 (0.03) 0.01 (0.001) **
Medications, Mean (SE) 0.52 (0.01) 0.22 (0.01) 0.01
** Not applicable due to small sample size; * Admitted patients only; TRD+: Treatment-Resistant Depression; TRD-: Not Treatment Resistant Depression;
SE: Standard Error.
signiicantly different between the two groups (TRD+ = 10.59,
TRD- = 9.74, p = 0.12). However, more laboratory tests (median 6.4 vs. 0.4, p < 0.0001) were requested for those with TRD+ compared to those with TRD-. Because procedures (e.g., electroconvulsive therapy and polysomnography) were only performed in the TRD+ group, group comparison was not possible. Electroconvulsive therapy was performed in 14 patients, for a total of 103.81 sessions per year.
Regarding the pharmacological treatment of depres-sion, over 90% of individuals with TRD- used from one to
ive different medications during the 5 years of assessment.
In those with TRD+, more than half of the patients used more than 10 medications during the same time period (p < 0001).
Regarding resource utilization in specialty clinics other
than psychiatry, no signiicant differences were found
and laboratory tests. Regarding non-psychiatric
medica-tion, the only drugs prescribed signiicantly more in the
TRD+ group were drugs to treat gastrointestinal tract disorders (Table 1).
The yearly hospitalization rate was higher in the TRD+ group compared to TRD- (9% vs. 5%, p = 0.009); the mean number of inpatient days per year was also higher in the TRD+ group (3.53 vs. 1.72, p = 0.009). Although not
statisti-cally signiicant, the mean number of hospitalization days
in a subsample of patients who were admitted to hospital was surprisingly shorter in the TRD+ group when compared to the TRD- patients (37.6 days vs. 51.4 days, respectively,
p = 0.32). Furthermore, we found no signiicant differences
in the number of tests and procedures, or with the medi-cation utilized during the inpatient stay, when comparing both groups.
Health care costs
Table 3 summarizes the health care costs for TRD+ and
TRD- subjects. TRD+ was signiicantly more expensive than
that of TRD- subjects in all settings but at the emergency department. Accordingly, the total individual costs of
an-nual treatment for TRD+ was 81.5% more expensive than
the TRD- group [R$ 5,520.85 (US$ 3,075.34) vs. R$ 3,042.14 (US$ 1,694.60, respectively).
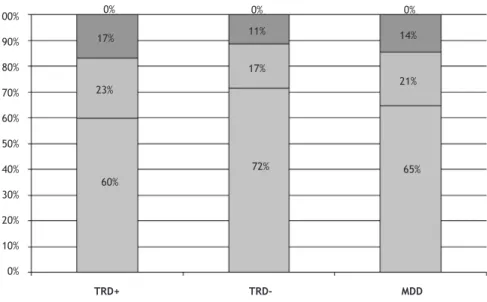
Overall, outpatient psychiatric care accounted for the
vast majority of costs in both groups (60% in TRD+ vs. 72% in TRD-), followed by inpatient care (23% in TRD+ vs. 17% in
TRD-) (Figure 1). Approximately 85% of the total costs for
treating MDD patients were derived from medication use (67% for TRD+ and 72% for TRD-) and inpatient per diem charges (15% for TRD+ and 13% for TRD-) (Figure 2).
Table 3 Mean annual cost of treatment for TRD+ and TRD-, overall and by care category (costs for March 2010)
TRD+ TRD- (R$) MDD (R$)
R$ US$ R$ US$ R$ US$
Psychiatric Clinic
Medical Visits 245.95 137.00 226.16 125.98 234.56 130.66
Other Visits 3.45 1.92 17.08 9.51 11.29 6.29
Nurse Care 0.39 0.22 0.09 0.05 0.22 0.12
Diagnostic Tests 174.78 97.36 133.44 74.33 150.99 84.11
Procedures 236.33 131.65 0.00 0.00 100.33 55.89
Medications 2,637.93 1,469.44 1,798.53 1,001.85 2,154.88 1,200.36
Subtotal 3,298.83 1,837.58 2,175.30 1,211.73 2,652.27 1,477.42
Other Clinics
Medical Visits 6.96 3.88 7.94 4.42 7.52 4.19
Diagnostic Tests 12.11 6.75 15.21 8.47 13.89 7.74
Procedures 0.00 0.00 0.07 0.04 0.04 0.02
Medications 910.64 507.26 321.99 179.36 571.89 318.57
Subtotal 929.71 517.89 345.21 192.30 593.34 330.51
Emergency Department
Medical Visits 0.29 0.16 0.41 0,23 0.36 0.20
Diagnostic Tests 0.00 0.00 0.38 0.21 0.22 0.12
Procedures 0.00 0.00 0.00 0.00 0.00 0.00
Medications 0.00 0.00 0.14 0.08 0.08 0.04
Subtotal 0.29 0.16 0.93 0.52 0.66 0.37
Hospitalizations
Days 849.26 473.07 406.50 226.44 594.47 331.14
Medical Visits 64.77 36.08 17.91 9.98 37.80 21.06
Other Visits 3.35 1.87 13.51 7.53 7.32 4.08
Nurse Care 90.59 50.46 11.85 6.60 45.28 25.22
Diagnostic Tests 38.01 21.17 12.60 7.02 23.39 13.03
Procedures 108.14 60.24 2.99 1.67 47.63 26.53
Medications 137.90 76.82 55.34 30.83 90.39 50.35
Subtotal 1,292.02 719.71 520.70 290.05 846.28 471.41
Figure 1 Health Care System distribution costs.
Figure 2 Cost analysis for TRD+ and TRD- groups.
100%
90%
80%
70%
60%
50%
40%
30%
20%
10%
0%
0%
17%
23%
60%
72% 17% 11%
0% 0%
14%
21%
65%
Psychiatry Outpatient Care Inpatient Care Other Outpatient Care Emergency Department
TRD+ TRD- MDD
Medical Visits Tests Procedures Medications Inpatient per diem
6%
6%
15%
72%
13%
TDR-TDR+
8% 5% 0% 67%
4%
Discussion
Results from this study are consistent with the literature in that TRD+ is a common condition and treatment for
TRD+ patients is associated with signiicantly higher costs
when compared to TRD- patients.19-22 Due to the nature of
the psychiatric institution in which these data were col-lected (i.e., a tertiary center), the high prevalence of TRD+
was expected. When analyzing our data, we observed that a signiicant proportion of subjects were being prescribed
suboptimal doses of medication. It has been reported that, for reasons that are not fully understood, patients seen in academic institutions often receive suboptimal medica-tion doses.15 Nonetheless, this fact is not seen exclusively
the list payment values of the Brazilian Medical Association
is clearly outdated and insuficient to even minimally cover
current hospital costs. In contrast, because medication is listed according to the market price, its cost is more likely
to relect the current market environment. The fact that
we were unable to account for the costs of non-medical staff or certain procedures (e.g., social worker care, staff meetings to discuss treatment, use of disposable material) may have contributed to an increase in the medication costs in this study.
Certain limitations should be considered in interpreting
these indings.
• This study relects healthcare utilization pattern within
a tertiary care hospital that is likely not representa-tive of public mental healthcare services in Brazil. Furthermore, being a teaching hospital, multiple medical residents were likely responsible for patient care over the time encompassed by this study. This fact is of critical importance because this turnover
may have led to insuficient knowledge about the pa -tient’s history; it may be that changes in medication are sometimes not totally necessary. It is possible, in this case, that this TRD+ group could include patients
with “pseudo-resistance”, a inding reported in other
teaching hospitals.15
• The sample size calculation estimated that 240 patients
were needed for the study. The inal sample consisted
of 212 patients. However, because we had a higher
pro-portion of TRD+ patients than initially expected (42.5%
versus 15%), we do not believe that this fact had a
sig-niicant impact on our results. However, the moderate
sample size did not allow us to detect differences with regard to some variables such as resource utilization in other clinics and the emergency department. • As all antidepressant switches and up-titrations were
counted in the TRD scale and the TRD matrix regard -less of the adequacy of antidepressant dosage and treatment duration, the proportion of TRD+ was likely overestimated.
• Due to its retrospective nature, we were unable to capture indirect costs in this study. The results of “cost of illness” studies in depression are variable, but indi-rect costs always account for the greater share of the total cost.8-11 It has also been reported that TRD+ pa-tients have signiicantly higher indirect costs than TRD-
patients.19-20 Although signiicantly higher, the costs of
TRD+ compared to TRD- were not as substantial in our study as has been reported elsewhere, where TRD+ was reported to cost up to 6-times more than TRD-.29,32,38
Conclusion
We assessed the costs of MDD in a tertiary reference hospital.
Our study should raise awareness of the impact of TRD+ and
should be considered by policy makers when implementing public mental health initiatives. Despite inherent
limita-tions, this study demonstrates that MDD, and speciically
TRD+, is associated with high treatment costs. Considering that indirect costs were not captured in this study, we urge future studies to account for these costs to further measure the economic impact of depression on the healthcare system. of antidepressant therapies receive the proper dose and
duration of treatment. This issue may have contributed to
the inlated TRD+ prevalence observed in this sample because
our study used an algorithm to categorize patients into the TRD+ or TRD- groups based on medication records rather than actual face-to-face psychiatric assessment. Groups were similar regarding sociodemographic characteristics, as well as psychiatric and non-psychiatric comorbidities. Clinical factors found to be associated with treatment resistance in
other studies, such as comorbid anxiety disorders,28 were not signiicantly different in both sub-groups, possibly due
to the small sample size.
Individuals with TRD+ utilize more resources and are substantially more costly to the health system compared to
individuals with TRD-. This result was expected because TRD+ is deined as a series of conditions related to failure in the
previous use of resources that results in an increased use of resources. Medication costs were responsible for 70% of the total costs in our sample, whereas the per diem
hospitaliza-tion cost was responsible for 15%. Other costs are smaller.
When comparing the two groups, we found no differences regarding the number of medical visits or laboratory tests
conducted in non-psychiatric clinics, nor did we ind any
differences in the treatment for disorders other than MDD.
These indings differ from other studies that reported that
an increased severity of depression translates into higher health-care utilization and costs for comorbid conditions18,28
and that the improvement in the symptoms of depression is associated with lower resource utilization for non-depression-related reasons.29-32
Indeed, in our data, the costs of comorbidities accounted
for only 14% of the total costs. Other studies reported that
up to 70% of the costs of managing depression were due to the treatment of comorbidities.34 This discrepancy may be explained by the fact that patients referred to the tertiary
care often have the treatment of their comorbidities taken care of at the primary or secondary level. Because these treatments occur outside of the teaching hospital setting, our study did not capture these costs.
The mean annual cost for the symptoms of depression was R$ 4,092.55 (US$ 2,279.72), which is greater than the costs of other chronic disorders in Brazil (reference). The annual costs of osteoporosis (2001) were R$ 748.81 per patient.35
For schizophrenia (1998), they were R$ 1,256.00.36
Medication was the most signiicant driver of healthcare cost, accounting for 70% of the total cost. This igure is in
contrast with that observed in other studies that report that 6% to 29% is associated with drug costs.10,11 In other studies,
the most relevant cost drivers of direct costs are usually hospitalization (average 42% versus 21% in our study) or out-patient care.10,11,33 This lower hospitalization cost, compared
with the literature, is not due to lower hospitalization rates or shorter lengths of stay. In our study, the average number of annual inpatient days was similar to those found in US studies using claim databases for TRD+ and TRD- patients19,20
and higher than that observed in primary care patients with depression in Porto Alegre, Brazil.37 The length of stay of
hos-pitalized patients was similar (42.8 days in the MDD sample) when compared to the average length of stay in Brazilian psychiatric hospitals (40 days, source: MS/SAS/DECAS/
Acknowledgements
The authors wish to thank Flávia Ferreira Ramos from the Economic Center of the Institute of Psychiatry of the Universidade de São Paulo and economist Maria Ignez Garcia Aveiro for their great support in collecting and updating costs for this study.
Disclosures
Beatrice Alinka Lepine
Employment:Faculdade de Saúde Pública, Universidade de São Paulo, Brazil.
Ricardo Alberto Moreno
Employment:Director, Mood Disorders Unit (GRUDA), Department of
Psychiatry, Faculdade de Medicina, Universidade de São Paulo, Brazil.
Rodolfo Nunes Campos
Employment:Researcher, Mood Disorders Unit (GRUDA), Department of
Psychiatry, Faculdade de Medicina, Universidade de São Paulo, Brazil.
Bernard François Couttolenc
Employment:Faculdade de Saúde Pública, Universidade de São Paulo, Brazil.
* Modest
** Signiicant
*** Signiicant. Amounts given to the author's institution or to a colleague for
research in which the author has participation, not directly to the author.
This study was part of the post-graduation thesis of the irst author and was funded by Eli Lilly from Brazil. BAL was an Eli Lilly Brazil employee. RAM
has acted as a consultant to and conducted research sponsored by pharmaceu -tical companies with clinical research in the area of bipolar and depressive
disorders (Servier, Bristol Myers Squibb and Solvay Pharma, Abbott, Astra
Zeneca). RNC and BFC have no conlict of interest.
References
1. Angst J. Epidemiology of depression. Psychopharmacology (Berl) 1992;106(Suppl):S71-74.
2. Young AS, Klap R, Shoai R, Wells KB. Persistent depression and anxiety in the United States: prevalence and quality of care.
Psychiatr Serv. 2008;59:1391-8.
3. Vasiliadis HM, Lesage A, Adair C et al. Do Canada and the United States differ in prevalence of depression and utilization of services? Psychiatr Serv. 2007;58:63-71.
4. Compton WM, Conway KP, Stinson FS, Grant BF. Changes in the
prevalence of major depression and comorbid substance use disorders in the United States between 1991-1992 and 2001-2002. Am J Psychiatry. 2006;163:2141-7.
5. Kessler RC, McGonagle KA, Zhao S et al. Lifetime and 12-month
prevalence of DSM-III-R psychiatric disorders in the United
States. Results from the National Comorbidity Survey. Arch Gen
Psychiatry. 1994;51:8-19.
6. Strine TW, Mokdad AH, Balluz LS et al. Impact of depression
and anxiety on quality of life, health behaviors, and asthma
control among adults in the United States with asthma, 2006. J Asthma. 2008;45:123-33.
7. Berto P, D'Ilario D, Ruffo P et al. Depression: cost-of-illness studies in the international literature, a review. J Ment Health Policy Econ. 2000;3:3-10.
8. Greenberg PE, Stiglin LE, Finkelstein SN, Berndt ER. The
economic burden of depression in 1990. J Clin Psychiatry. 1993;54:405-18.
9. Greenberg PE, Kessler RC, Birnbaum HG et al. The economic
burden of depression in the United States: how did it change between 1990 and 2000? J Clin Psychiatry. 2003;64:1465-75. 10. Luppa M, Heinrich S, Angermeyer MC et al. Cost-of-illness
studies of depression: a systematic review. J Affect Disord. 2007;98(1-2):29-43.
11. Sobocki P, Jönsson B, Angst J, Rehnberg C. Cost of depression in Europe. J Ment Health Policy Econ. 2006;9(2):87-98.
12. Greden JF. The burden of disease for treatment-resistant depression. J Clin Psychiatry. 2001;62(Suppl 16):26-31. 13. Cadieux RJ. Practical management of treatment-resistant
depression. Am Fam Physician. 1998;58:2059-62.
14. Trivedi MH, Rush AJ, Wisniewski SR, Nierenberg AA, Warden D, Ritz L, Norquist G, Howland RH, Lebowitz B, McGrath PJ, Shores-Wilson K, Biggs MM, Balasubramani GK, Fava M; STAR*D Study
Team. Evaluation of outcomes with citalopram for depression using measurement-based care in STAR*D: implications for clinical practice. Am J Psychiatry. 2006;163(1):28-40.
15. Sackeim HA. The deinition and meaning of treatment-resistant
depression. J Clin Psychiatry. 2001;62(Suppl 16):10-17. 16. Amsterdam JD, Hornig-Rohan M. Treatment algorithms in
treatment-resistant depression. Psychiatr Clin North Am.
1996;19:371-86.
17. Souery D, Papakostas GI, Trivedi MH. Treatment-resistant depression. J Clin Psychiatry. 2006;67(Suppl 6):16-22. 18. Souery D, Amsterdam J, de Montigny C et al. Treatment resistant
depression: methodological overview and operational criteria.
Eur Neuropsychopharmacol. 1999;9:83-91.
19. Corey-Lisle PK, Birnbaum HG, Greenberg PE et al. Identiication
of a claims data "signature" and economic consequences for treatment-resistant depression. J Clin Psychiatry. 2002;63:717-26.
20. Ivanova JI, Birnbaum HG, Kidolezi Y, Subramanian G, Khan
SA, Stensland MD. Direct and indirect costs of employees with treatment-resistant and non-treatment-resistant major
depressive disorder. Curr Med Res Opin. 2010;26(10):2475-84.
21. Russell JM, Hawkins K, Ozminkowski RJ, Orsini L, Crown WH, Kennedy S et al. The cost consequences of treatment-resistant
depression. J Clin Psychiatry. 2004;65(3):341-7.
22. Fosdick L, Silberman A, Beckman M, Spivak B, Amital D. The economic impact of depression: resistance or severity? Eur
Neuropsychopharmacol. 2010;20(10):671-5.
23. Almeida-Filho N, Mari Jde J, Coutinho E, et al. Brazilian
multicentric study of psychiatric morbidity. Methodological features and prevalence estimates. Br J Psychiatry. 1997;171:524-9.
24. Andrade LHSG, Lolio CA, Gentil V, Laurenti R. Epidemiologia dos
transtornos mentais em um area deinida de captação da cidade
de São Paulo, Brasil. Rev Psiq Clin. 1999;26(Suppl 5):275-61. 25. Chisholm D, Diehr P, Knapp M, Patrick D, Treglia M, Simon G, LIDO
Group. Depression status, medical comorbidity and resource costs. Evidence from an international study of major depression
in primary care (LIDO). Br J Psychiatry. 2003;183,:121-31.
26. Moreno P, Saravanan Y, Levav I et al. Evaluation of the PAHO/ WHO training program on the detection and treatment of
depression for primary care nurses in Panama. Acta Psychiatr Scand. 2003;108:61-5.
27. Nemeroff CB. Augmentation strategies in patients with refractory depression. Depress Anxiety. 1996;4:169-81.
28. Souery D, Oswald P, Massat I, Bailer U, Bollen J, Demyttenaere K et al. Clinical factors associated with treatment resistance in
major depressive disorder: results from a European multicenter study. J. Clin. Psychiatry. 2007;68(7):1062-70
29. Crown WH, Finkelstein S, Berndt ER et al. The impact of treatment-resistant depression on health care utilization and costs. J Clin Psychiatry. 2002;63:963-71.
30. Mitchell PB. Managing depression in a community setting. Med J Aust. 1997;167:383-8.
31. Harman JS, Hall AG, Zhang J. Changes in health care use and
costs after a break in Medicaid coverage among persons with depression. Psychiatr Serv. 2007;58:49-54.
32. Simon GE, Khandker RK, Ichikawa L, Operskalski BH. Recovery
33. Kalsekar ID, Madhavan SM, Amonkar MM et al. The effect of
depression on health care utilization and costs in patients with type 2 diabetes. Manag Care Interface. 2006;19:39-46. 34. Croghan TW, Obenchain RL, Crown WE. What does treatment of
depression really cost? Health Aff (Millwood). 1998;17:198-208. 35. Kowalski SC, Sjenzfeld VL, Ferraz MB. Resource utilization and
costs in osteoporosis. Rev Assoc Med Bras. 2001;47:352-7. 36. De Carvalho RJL. Utilização de recursos e custos diretos da
esquizofrenia para o setor público do Estado de São Paulo. Universidade Federal Paulista, 2000.
37. Chisholm D, Amir M, Fleck MPA, Herrman H, Lomachenkov A, Lucas R, Patrick D. Longitudinal Investigation of Depression
Outcomes (The LIDO Study) in primary care in six countries:
comparative assessment of local health systems and resource utilization. Int. J. Methods Psychiatr Res. 2001;10:59-71. 38. Simon GE, VonKorff M, Barlow W. Health care costs of primary