ABSTRACT
The objective of this study was to determine the economic efficiency of resource utilization in broiler production farms using a non-parametric production function, data envelopment analysis (DEA). Data for the analysis were collected from a cross section of 44 farmers using a multi-stage sampling procedure. In DEA models the farmers that produce their level of output with the least amount of input serve as benchmarks against which the input use inefficiency of all other farmers can be measured. The total variable costs, net return and benefit cost ratio were calculated to be 3506.29 $ (1000 bird)-1, 1386.53 $ (1000 bird) -1 and 1.38, respectively. The average values of technical and scale efficiencies of farmers were found to be 0.92 and 0.93. The results also revealed that about 10% of the total input resources could be saved if the farmers follow the input package recommended by the DEA.
INTRODUCTION
The efficiency of farmers is an interesting topic to economists concerned with the problems in developing countries. Measuring the efficiency of agricultural production is an important issue in these countries. The measurement of efficiency has been a popular field of research since Farrell published a seminal paper in 1957 (Farrell, 1957). Since then, much research has focused on the economic efficiency of agricultural production, and the analysis has centered on the technical, pure technical and scale efficiency of farm production (Omid et al., 2011). Farrell developed the concept of technical efficiency based on the relationships between inputs and outputs. The concept of efficiency has been interpreted in various ways. Differences in economic efficiency among groups of farms may result from variations in technical efficiency (larger output with equal amounts of inputs) or price efficiency (higher profits).
Some researchers measured efficiency in broiler production using parametric methods. Jekayinfa et al. (2007) studied energy audit
of poultry processing plants in southwestern Nigeria. Atilgan & Hayati (2006) analyzed cultural energy on broilers reared in different capacity poultry houses of Turkey. Results of their studies showed that increasing capacity of housings decreases cultural energy input up to certain capacity and indicated that increasing housing capacity without interfering with performance could allow energy conservation in sustainable agriculture. Also a number of studies have been carried out on efficiency in crop and livestock farms (Latruffe et al., 2004) and
other livestock production such as poultry egg farms (Binuomote et al., 2008; Yusef & Malomo 2007; Ojo 2003), dairy farms (Bravo-Ureta
& Rieger, 1990), and fish farms (Morrison Paul et al. 2010; Ekunwe &
Emokaro 2009; Inoni 2007).
nAuthor(s)
Heidari MD1*
Omid M2
Akram A3
1 Ph.D Student in Mechanization of Agricultural Machinery Engineering Department, School of Agricultural Engineering and Technology, University of Tehran.
2 Professor, Department of Agricultural Machinery, Faculty of Agricultural Engineering and Technology, University of Tehran.
3 Associated Professor, Department of Agricultural Machinery, Faculty of Agricultural Engineering and Technology, University of Tehran.
nMail Adress
Mohammad Davoud Heidari
Department of Agricultural Machinery Engineering
Faculty of Agricultural Engineering and Technology
University of Tehran, Karaj, Iran. phone: +98-261-2801038
+98-261-2808138 +98-936-3828055
E-mail: [email protected]
nKeywords
Data envelopment analysis, economic, feed cost, poultry farms, technical efficiency.
Submitted: March/2011 Approved: November/2011
nAcknowledgements
total area of country) located in the center of Iran, between 29o48’and 33o30’ latitude and 54o45’ and 56o30’ longitude. Data were collected in 44 broiler farms using a face-to-face questionnaire during January–February, 2010. In order to determine the farm numbers, the Neyman method and stratified random sampling technique were applied (Yamane, 1967). The economics of poultry meat production depends on numerous factors, but the most important is general economic policy. Other factors include the choice of production technology, labor organization and productivity, and the extent of the exploitation of the productive factors. Variable costs (direct costs) in broiler farms included the pullet cost, feed costs, water, electricity, and health care costs (medication, disinfection and vaccinations), labor, etc.
For the economic analyses, net profit, gross return, net return, benefit to cost ratio and productivity were computed as (Heidari & Omid, 2011):
Total production value = Brolier (kg(1000 bird)-1) x Price commodiy ($(1000 bird)-1) (1)
Gross return = Total production value ($(1000 bird) -1) - Variable costs ($(1000 bird)-1) (2)
Net return = Total production value ($(1000 bird) -1) - Total production costs ($(1000 bird)-1) (3)
Total production value ($(1000 bird)-1) BC = (4) Total production cost ($(1000 bird)-1)
Broiler ($(1000 bird)-1)
Productivity = (5)
Total production cost ($(1000 bird)-1)
Correlation analysis
Correlation analysis is a family of statistical tests to determine mathematically whether there are trends or relationships between two or more sets of data from the same list of items or individuals (for example, labor cost and chick cost of farms). The tests provide a statistical yes or no as to whether a significant relationship or correlation exists between the variables (Childress, 1985).
DEA models
Data Envelopment Analysis (DEA) is becoming an increasingly popular management tool and is commonly used to evaluate the efficiency of a number of producers. This study presents an application of data
envelopment analysis (DEA) to differentiate efficient from inefficient farmers. DEA is a nonparametric method in operations research and economics for the estimation of production frontiers (Charnes et al., 1994). DEA is a simple approach to derive the relative efficiency of production units using linear programming. DEA was first introduced in the late seventies by Charnes et al. (1978). Specifically, they
developed an optimization model known as the CCR (after their initials), which exhibits constant returns to scale (CRS). Later, Banker et al. (1984) extended the
model to allow the existence of variant returns to scale (VRS), the CCR model became known as BCC model. Subsequently, more than a thousand scientific papers have elaborated upon and researchers applied DEA to almost every sector of economy.
DEA has been used in economic, energy and environmental modeling in recent studies. Begum
et al. (2010) calculated technical, allocative and
economic efficiencies of commercial poultry farms in Bangladesh using the DEA approach under CRS and VRS specifications. Zhou et al., (2008) presented
a literature survey on the application of DEA to energy and environmental (E&E) studies, beginning with an introduction to the most widely used DEA techniques, which was followed by a classification of 100 publications in this field. This survey of DEA in E&E studies could be useful to researchers entering this exciting field. Asmild et al. (2006) calculated
the efficiency of pig farms in Denmark by studying the economic and environmental potentials of these farms. The results of this study indicated considerable improvement potentials, especially on the environmental variables.
Recently, Omid et al. (2011) investigated the degree of efficiency of selected greenhouse producers in Iran and described the process of benchmarking energy inputs and output yield by applying DEA technique. Here the same methodology is adopted for selected broiler farms. The objectives were to specify economical indices for broiler production, to differentiate efficient from inefficient farmers, and to identify wasteful uses of input costs in broiler production in the Yazd province.
MATERIAL AND METHODS
Case study and data collection
A typical statistical approach is characterized as a central tendency approach and evaluates producers relative to an average producer. In contrast, DEA is an extreme point method and compares each producer with only the “best” producers. In this study, among variable costs, the selected inputs for the DEA models included costs of different source,s such as labor, feed, fuel and electricity (FE) and chick, and the output was production income. Based on the costs of the inputs and output and surveyed data various DEA models can be computed. Here the basic DEA models included the CCR and BCC models (Charnes et al., 1978; Banker et al., 1984). The CCR model is built on the assumption
of constant returns to scale (CRS) of activities, but the BCC model is built on the assumption of variable returns to scale (VRS) of activities. Efficiency in DEA is defined in three different forms: overall technical efficiency (TECCR), pure technical efficiency (TEBCC) and scale efficiency (SE).
Technical efficiency
Production efficiency can be defined in terms of the production function that relates the level of various inputs. Technical efficiency (TE) is a measure of a farm’s success in producing maximum output from a given set of input; in other words, TE refers to the physical relationship between inputs used in the production process. TE measures output relative to that of the efficient isoquant. Efficient farms produce on the production frontier or, alternatively stated, on the efficient isoquant. TE can be calculated by the ratio of sum of weighted outputs to sum of weighted inputs (Cooper et al., 2006):
å
å
=
=
=
✁ ✂ ✁ ✁ ✄ ☎ ✂ ☎ ☎ ✆ ✝ ✞ ✟ ✠ ✡ ✠ ✡q
(6)where ‘x’ and ‘y’ are inputs and outputs, ‘v’ and ‘u’ are input and output weights, respectively, ‘q’ is the number of inputs (q = 1,2,. . ., Q); ‘p’ is the number of outputs (p = 1,2,..,P); and ‘j’ represents jth DMU.
The CCR model was initially proposed by Charnes
et al., (1978). The CCR model is indicated in Eq. (7):
minq (7)
subject to:
where is a vector of lj elements representing the influence of each farmer in determining the technical efficiency of the DMU under study, and F is the technical efficiency (TECCR).
Pure technical efficiency and Scale efficiency
Pure technical efficiency is technical efficiency of BCC model. The BCC model was initially proposed by Banker et al. (1984). The input-oriented BCC
model evaluates the efficiency of DMUj by solving the following function:
minq (8)
subject to
The
å
= = ☛ ☞ ☞ ✌ ✌l
equation is a convexity constraint, which specifies the VRS framework (Mostafa, 2009). Without this convexity constraint, the BCC model will be a CCR model (7) describing a CRS situation.
Based on the CCR and BCC scores, scale efficiency defined by (Cooper et al., 2006):
TECCR
SE = (9)
TE
BCC
In other words, decomposition of Eq. (9) can be defined by:
TE
CCR = TEBCC xSE (10)
If the scale efficiency is less than 1, the DMU will be operating either at decreasing returns to scale (DRS) if a proportional increase of all input levels produces a less-than-proportional increase in output levels or increasing return to scale (IRS) at the converse case. This implies that resources may be transferred from DMUs operating at DRS to scale to those operating at IRS to increase average productivity at both sets of DMUs (Boussofiane et al., 1992).
By solving of CCR and BCC models, the weights of remaining inputs (labor cost, feed cost, fuel and electricity costs (FE) and chick cost) and output (income) would be calculated so that the minimum value of is calculated. In this study we used DEA-solver software to calculate CRS and VRS with radial distances to the efficient frontier and determine the amount of cost loss and cost savings of inefficient farmers.
RESULTS AND DISCUSSION
Budgetary analysis and correlation between inputs of broiler farms production
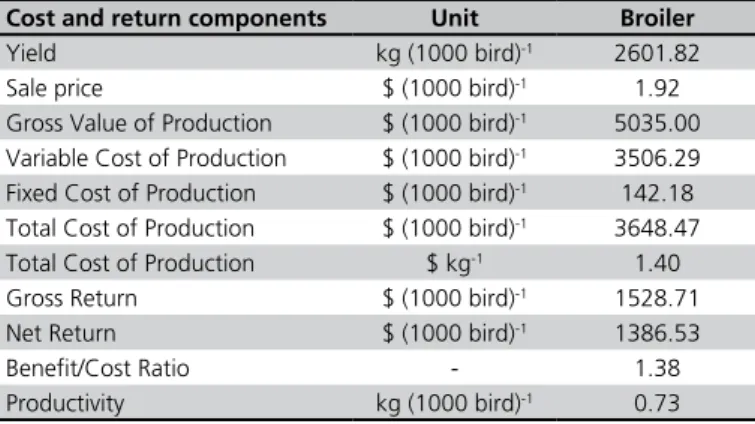
Average capacity of surveyed farms was 18142 birds. Maximum, minimum and average meat production was 3000, 2000 and 2601 kg (1000 bird)-1, respectively. The total cost of broiler production and the gross value of its production were calculated and shown in Table 1.
Table 1 - Budgetary analyses of broiler farms production.
Cost and return components Unit Broiler
Yield kg (1000 bird)-1 2601.82
Sale price $ (1000 bird)-1 1.92
Gross Value of Production $ (1000 bird)-1 5035.00
Variable Cost of Production $ (1000 bird)-1 3506.29
Fixed Cost of Production $ (1000 bird)-1 142.18
Total Cost of Production $ (1000 bird)-1 3648.47
Total Cost of Production $ kg-1 1.40
Gross Return $ (1000 bird)-1 1528.71
Net Return $ (1000 bird)-1 1386.53
Benefit/Cost Ratio - 1.38
Productivity kg (1000 bird)-1 0.73
The fixed and variable expenditures included in the cost of production were calculated separately as 142.18 and 3506.29 $ (1000 bird)-1, respectively. Fixed costs included only 3.9% of total costs. Feed costs are, as a rule, the highest expenditure of a broiler farm. Therefore, it is important to have a good idea of how much feed is consumed, in particular the amount of feed needed per kg of meat. That is called feed conversion ratio. Diesel had the small share of variable costs, while it had the highest energy consumption. This is because of low price of fuel and subsidizing policy in Iran. The total expenditure for broiler production was 3648.47 $ (1000 bird)-1 and with attention to the gross production value (5035 $ (1000 bird)-1), gross return were found to be 1528.71 $ (1000 bird)-1. With respect to results of Table 1, the benefit–cost ratio (BCR) from broiler production in the surveyed farms was calculated to be 1.38. Similar results for BCR can be seen in study of Heidari & Omid (2011) for greenhouse cucumber as 1.68. Depending on the farm size, broiler farming can be a main source of family income or can provide subsidiary income and profitable employment to farmers throughout the year. Table 2 shows the inputs used for developing DEA models according to farm size (small, medium and large).
Table 2 - Inputs and output of different size in broiler production.
Labor Feed FE Chick Income
Small Mean 154.38 2473.34 63.05 835.97 5754.59
SD 40.63 342.84 15.43 15.97 468.76
Medium Mean 134.91 2460.19 67.24 828.74 5759.88
SD 19.20 233.08 16.27 16.27 537.56
Large Mean 107.14 2493.82 61.24 825.46 5928.67
SD 19.49 300.86 17.09 11.32 439.33
correlation value found was between income and feed cost as 0.33, indicating that, as the value of income or feed cost increases, the value of the feed cost or income increases.
Table 3 - Correlation between input sources and output in broiler production.
Labor Feed FE Chick Income
Labor 1.00
Feed 0.05 1.00
FE 0.02 0.05 1.00
Chick 0.22 -0.10 -0.04 1.00
Income -0.14 0.33 0.32 -0.16 1.00
DEA results
In this study, we used CCR and BCC models to evaluate technical, pure technical and scale efficiencies (TE, PTE and SE, respectively) of broiler farms. The results of CCR and BCC models are shown in Table 4. Based on CCR results, this study shows that only 9 farmers were relatively efficient and the remaining 35 were inefficient, i.e. their efficiency scores were below 1. But from the results of BCC model, we found 14 farmers (out of total 44 farmers) were efficient, meaning they have an efficiency score of 1 (Table 4). Other farmers that have efficiency score less than one, are inefficient in input use. The average values of the PTE, TE and SE are summarized in Table 4. The average values (for all 44 farmers considered) of PTE, TE and SE were found to be 0.9189, 0.9856 and 0.9324, respectively. In a study of Chauhan et al. (2006), PTE, TE and SE for rice production were reported to be 0.9249, 0.7720 and 0.8302, respectively and in the study of Omid et al. (2011), 0.972, 0.879 and 0.900
for greenhouse cucumber, respectively.
The efficient farmers obviously follow good operating practices. However, among the efficient farmers, some farms (1, 11, 19, 20, 26, 34, 37, 41, 44) showed better operating practices than others. Therefore, discrimination is required to be made among the efficient farmers while seeking the best operating practices. These efficient farms can be selected by inefficient DMUs as best practice DMUs, making them a composite DMU instead of using a single DMU as a benchmark. The farm 25 appears twenty six times in the reference set of inefficient DMUs. This places farm 25 closest to the input and output levels of most of the inefficient DMUs, but uses fewer inputs. The last column of Table 4 indicated results of return to scale. The analysis shows that DMUs numbered 1, 11, 19, 20, 26, 33, 34, 37, 41, 44 that are efficient
under the CRS model are both technically and scale efficient (Table 4). The RTS indicated that all efficient farms (based on scale efficiency) were operating at CRS except DMU number 33 that was operating at DRS and for inefficient farms technological change is required for considerable changes in output.
Table 4 - Efficiency scores of farms based on CCR and BCC models.
DMU TECCR EBCC SE Frequency in referent set RTS
1 1.00 1.00 1.00 11 Constant
2 0.97 1.00 0.97 0 Increasing
3 0.90 0.98 0.92 0 Increasing
4 0.90 0.98 0.92 0 Increasing
5 0.83 0.97 0.86 0 Increasing
6 0.94 0.95 0.98 0 Increasing
7 0.94 0.99 0.95 0 Increasing
8 0.91 0.98 0.93 0 Increasing
9 0.97 0.99 0.98 0 Increasing
10 0.84 0.97 0.86 0 Increasing
11 1.00 1.00 1.00 18 Constant
12 0.89 0.95 0.93 0 Increasing
13 0.75 0.95 0.78 0 Increasing
14 0.96 0.99 0.97 0 Constant
15 0.88 0.97 0.91 0 Increasing
16 0.84 0.98 0.85 0 Increasing
17 0.94 0.99 0.95 0 Increasing
18 0.85 0.98 0.87 0 Increasing
19 1.00 1.00 1.00 7 Constant
20 1.00 1.00 1.00 11 Constant
21 0.87 0.98 0.89 0 Increasing
22 0.93 0.98 0.94 0 Increasing
23 0.83 0.99 0.84 0 Increasing
24 0.70 0.99 0.71 0 Increasing
25 0.88 0.97 0.91 0 Increasing
26 1.00 1.00 1.00 25 Constant
27 0.87 0.99 0.89 0 Increasing
28 0.85 0.97 0.87 0 Increasing
29 0.91 0.99 0.92 0 Increasing
30 0.83 0.99 0.84 0 Increasing
31 0.83 0.94 0.89 0 Increasing
32 0.97 0.98 0.99 0 Increasing
33 1.00 1.00 1.00 0 Decreasing
34 1.00 1.00 1.00 8 Constant
35 0.95 0.99 0.96 0 Increasing
36 0.90 1.00 0.90 0 Increasing
37 1.00 1.00 1.00 1 Constant
38 0.99 1.00 0.99 0 Decreasing
39 0.94 1.00 0.94 0 Increasing
40 0.99 1.00 0.99 0 Increasing
41 1.00 1.00 1.00 2 Constant
42 0.92 0.99 0.93 0 Increasing
43 0.99 1.00 0.99 0 Increasing
44 1.00 1.00 1.00 16 Constant
mean 0.92 0.99 0.93
STD 0.07 0.02 0.07
The PTE score of a farmer that is less than one indicates that, at present, he/she is using more input than required from the different sources (Chauhan et al., 2006). Therefore, it is desired to suggest realistic
inefficient farmer in order to avert wastage of input without reducing the output level. Table 5 gives, for each inefficient farmer, the PTE, the actual cost use ($ (1000 bird)-1) and the recommended projection cost use ($ (1000 bird)-1) for each input and the percent saving in total input use.
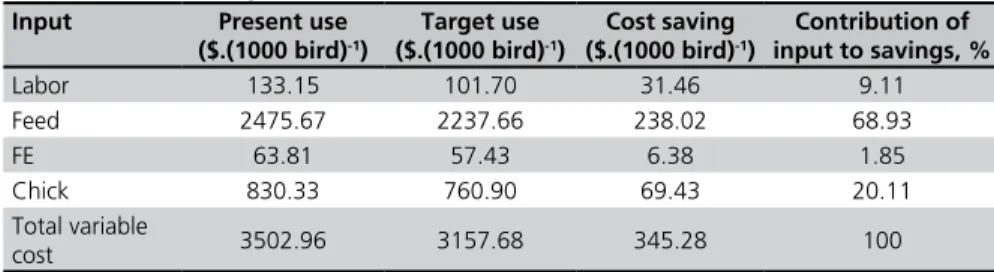
Table 6 summarizes the information available in Table 5. It gives the average cost spent and targeted ($ (1000 bird)-1), possible cost savings and percent contribution of each input source in the total cost savings. We note from Table 5 that the possible overall cost saving is 10%. Figure 1 shows the share
of the various sources in the total input savings. It is evident from Table 5 and Fig. 1 that the maximum contribution to the total cost savings is 69% from feed cost, followed by chick cost (20%) and labor cost (9%). Chauhan et al., (2006) reported a total input energy of 11.6% could be saved for rice production and the maximum contribution to the total energy savings was 33% from fertilizers. In the study of Omid et al., (2011) on an average, the total input energy could be reduced by 8.5% without reducing the cucumber yield from its present.
Feed cost contributes 69% of the total cost saving for inefficient farmers. In most cases of surveyed farms in this study, there are given free access to food and the birds are allowed to consume as much food as they wish. Broilers usually consume just enough food to meet their nutrient requirements. This control of intake is based primarily on the amount of energy in the diet.
CONCLUSIONS
In this study, we have determined efficient and inefficient broiler farms with respect to four variable costs via Data Envelopment Analysis. This technique allowed us to determine which farms had the best practices and also provided helpful insights for farm management. Broiler production consumed a total
Table 5 - The actual and suggested values of costs from different sources for inefficient farmers (based on BCC Model).
DMU PTE Actual use ($ (1000 bird)
-1) Projection use ($ (1000 bird)-1)
Saving %
Labor Feed FE Chick Labor Feed FE Chick
(1) (2) (3) (4) (5) (6) (7) (8) (9) (10) (11)
2 0.980 129.6 2025.0 50.5 832.5 127.1 1985.5 49.5 816.3 2.0
3 0.979 129.0 2250.0 84.8 828.0 126.3 2202.0 83.0 810.4 2.1
4 0.982 117.3 2250.0 94.1 825.0 115.2 2209.1 92.4 810.0 1.8
5 0.966 123.2 2250.0 75.6 840.0 119.0 2173.1 73.0 811.3 3.4
6 0.953 110.4 2842.1 90.8 855.0 105.3 2709.8 86.5 815.2 4.7
7 0.989 118.3 2250.0 73.9 823.6 117.1 2226.4 73.2 815.0 1.1
8 0.977 114.7 2445.7 80.6 828.0 112.0 2388.4 78.7 808.6 2.3
9 0.988 165.9 2543.5 56.4 828.0 163.8 2512.3 55.7 817.9 1.2
10 0.972 160.0 2913.3 82.2 821.5 155.6 2832.8 79.9 798.7 2.8
12 0.955 165.5 2582.0 79.9 844.6 158.1 2465.5 76.3 806.5 4.5
13 0.952 204.8 2343.8 52.2 864.0 195.0 2231.5 49.7 822.6 4.8
14 0.992 162.3 2423.1 39.5 835.7 161.0 2403.4 39.2 828.9 0.8
15 0.965 171.6 2596.2 44.0 850.9 165.6 2505.5 42.5 821.2 3.5
16 0.984 112.0 2494.6 53.3 828.0 110.2 2454.9 52.5 814.8 1.6
17 0.991 160.0 2445.7 46.7 828.0 158.5 2422.8 46.3 820.3 0.9
18 0.977 107.2 2947.6 58.0 824.4 104.7 2879.0 56.6 805.2 2.3
21 0.982 124.8 2205.9 74.6 826.2 122.6 2166.7 73.3 811.5 1.8
22 0.985 90.2 2445.7 64.4 828.0 88.8 2407.8 63.4 815.2 1.5
23 0.986 185.6 2600.0 87.0 810.0 183.0 2563.9 85.8 798.7 1.4
24 0.985 138.2 2668.0 45.8 828.0 136.1 2628.3 45.2 815.7 1.5
25 0.968 106.4 2441.5 51.7 846.0 103.0 2363.1 50.0 818.9 3.2
27 0.987 246.9 2531.3 55.2 822.9 243.7 2498.9 54.5 812.4 1.3
28 0.971 168.0 2445.7 76.4 828.0 163.1 2374.8 74.2 804.0 2.9
29 0.994 86.7 2409.7 48.0 828.0 86.2 2396.1 47.7 823.3 0.6
30 0.995 138.3 2445.7 42.9 828.0 137.5 2432.5 42.7 823.5 0.5
31 0.936 195.2 2334.0 72.6 867.6 182.6 2183.6 67.9 811.7 6.4
32 0.977 162.2 3142.6 66.6 829.7 158.5 3070.6 65.0 810.7 2.3
35 0.989 118.9 2475.0 54.5 824.5 117.6 2448.4 53.9 815.6 1.1
39 0.998 118.2 2527.2 62.9 828.0 118.0 2523.2 62.8 826.7 0.2
42 0.990 91.4 2250.0 53.2 830.1 90.5 2228.1 52.7 822.0 1.0
Table 6 - Cost savings ($/1000 bird) from different sources.
Input Present use
($.(1000 bird)-1)
Target use ($.(1000 bird)-1)
Cost saving ($.(1000 bird)-1)
Contribution of input to savings, %
Labor 133.15 101.70 31.46 9.11
Feed 2475.67 2237.66 238.02 68.93
FE 63.81 57.43 6.38 1.85
Chick 830.33 760.90 69.43 20.11
Total variable
cost 3502.96 3157.68 345.28 100
Figure 1 - Total potential improvement summary. *FE:
Fuel and Electricity Costs.
FE* 2%
cost of 3648.47 $ (1000 bird-1), which was mainly due to feed. DEA has helped in segregating efficient from inefficient farmers. It has also helped in finding the wasteful uses of production costs by inefficient farmers, ranking efficient farmers by DEA models and ranking input sources by using technical, pure technical and scale efficiency. On average, the total input cost could be reduced by 10% without reducing the income from its present level by adopting the recommendations based on this study. Feed cost and chick cost had relatively higher weights in the distribution of total input cost savings for inefficient farmers. If inefficient farmers would pay more attention to these sources, they would improve their economic productivity.
Based on our findings, modern and well-established scientific practices should be used to obtain higher technical efficiency from broiler farming like:
1. Purchase of improved strains of one-day-old healthy broiler chicks from a reputed hatchery.
2. Inefficient farmers should pay more attention to the consumption of diesel, feed and electricity to improve their economic productivity.
3. There is a need for capacity training of poultry farmers and processors to enable them cope with the challenges of modern poultry farming and commercialization of the poultry sub-sector in the studied region.
4. It is suggested accurate supervision and record daily information for better farm management.
REFERENCES
Asmilda M, Hougaard JL. Economic versus environmental improvement
potentials of Danish pig farms. Agricultural Economics 2006; 35:171-181.
Atilgan, A., Koknaroglu, H. Cultural energy analysis on broilers reared in different capacity poultry houses. Italian Journal of Animal Science 2006; 393-400.
Banker RD, Charnes A, Cooper WW. Some models for estimating technical and scale inefficiencies in data envelopment analysis. Management Science 1984; 30:1078-1092.
Begum IA, Buysse J, Alam MJ, Van Huylenbroeck G. Technical, allocative and economic efficiency of commercial poultry farms in Bangladesh. Worlds Poultry Science Journal 2010; 66:465-476.
Binuomote SO, Ajetomobi JO, Ajao AO. Technical efficiency of egg production in Osun State. International Journal of Poultry Science, 2008; 7(12):1227-1231.
Boussofiane A, Dyson RG, Thanassoulis E. Applied data envelopment analysis. European Journal of Operation Research 1992; 52:1-15.
Bravo-Ureta BE, Rieger L. Alternative production frontier methodologies and dairy farm efficiencies. Journal of Agricultural Economics 1990; 14:215-226.
Charnes A, Cooper WW, Lewin A, Seiford L. Data envelopment analysis: theory, methodology and applications. Boston: Kluwer Academic Publishers; 1994.
Charnes A, Cooper WW, Rhodes E. Measuring the efficiency of decision making units. European Journal of Operational Research 1978; 2:429-441.
Chauhan NS, Mohapatra PKJ, Pandey KP. Improving energy productivity in paddy production through benchmarking: an application of data envelopment analysis. Energy Conversion and Management 2006; 47:1063-1085.
Childress WM. Correlation analysis; a statistical test for relationships between two sets of data. Creative Computing 1985; 11(9):96.
Cooper WW, Seiford LM, Tone K. Introduction to DEA and its uses with DEA-Solver software and references. New York: Springer; 2006.
Ekunwe PA, Emokaro CO. Technical efficiency of catfish farmers in Kaduna, Nigeria. Journal of Appleid Science Research 2009; 5(7):802-805.
Farrell MJ. The Measurement of productive efficiency. Journal of the Royal Statistical Society, Series A (General) 1957; 120:253-81.
Heidari MD, Omid M. Energy use patterns and econometric models of major greenhouse vegetable productions in Iran. Energy 2011; 36:220-225.
Heidari MD, Omid M, Akram A. Aplication of artificial neural network for modeling benefit to cost ratio of broiler farms in tropical regions of Iran. Research Journal of Applied Sciences, Engineering and Technology 2011, 3 (6):546-522.
Inoni OE. Allocative efficiency in pond fish production in delta state, Nigeria: a production function approach. Agricultura tropica et subtropica 2007; 40(4):127-134.
Jekayinfa O, Simeon. Energetic analysis of poultry processing operations. Leonardo Journal of Sciences 2007; 77-92.
Latruffe L, Balcombe K, Davidova S, Zawalinska K. Determinants of technical efficiency of crop and livestock farms in Poland. Appllied Economics 2004; 36:1255-1263.
Morrison Paul CJ, Felthoven RG, Torres MO. Productive performance in fisheries: modeling, measurement, and management. The Australian Journal of Agricultural and Resource Economics 2010; 54:343-360.
Mostafa MM. Modeling the efficiency of top Arab banks: A DEA–neural network approach. Expert Systems with Applications 2009; 36:309-320.
Ojo SO. Productivity and technical efficiency of poultry egg production in Nigeria. International Journal of Poultry Science 2003; 2(6):459-464.
Omid M, Ghojabeige F, Delshad M, Ahmadi H. Energy use pattern and benchmarking of selected greenhouses in Iran using data envelopment analysis. Energy Conversion and Management 2011; 52:153-162.
Yamane T. Elementary sampling theory. New Jersey: Prentice Hall Englewood Cliffs; 1967.
Yusef SA, Malomo O. Technical efficiency of poultry egg production in Ogun state: a data envelopment analysis (DEA) approach. International Journal of Poultry Science 2007; 6(9):622-629.