ISSN 0100-879X
BIOMEDICAL SCIENCES
AND
CLINICAL INVESTIGATION
www.bjournal.com.br
www.bjournal.com.br
Volume 43 (10) 914-1009 October 2010
Institutional Sponsors
The Brazilian Journal of Medical and Biological Research is partially financed by
Hotsite of proteomics metabolomics developped by:
Braz J Med Biol Res, October 2010, Volume 43(10) 996-1000
doi: 10.1590/S0100-879X2010007500094
Effect of chloride dialysate concentration on metabolic acidosis in
maintenance hemodialysis patients
Effect of chloride dialysate concentration
on metabolic acidosis in maintenance
hemodialysis patients
F.O. Marques
1, A.B. Libório
2and E.F. Daher
31Programa de Pós-graduação em Ciências Médicas, Departamento de Medicina Clínica, Faculdade de Medicina, Universidade Federal do Ceará, Fortaleza, CE, Brasil 2Disciplina de Nefrologia, Faculdade de Medicina, Universidade de Fortaleza, Fortaleza, CE, Brasil 3Divisão de Nefrologia, Departamento de Medicina Clínica, Faculdade de Medicina, Hospital Universitário Walter Cantídio, Universidade Federal do Ceará, Fortaleza, CE, Brasil
Abstract
Hyperchloremia is one of the multiple etiologies of metabolic acidosis in hemodialysis (HD) patients. The aim of the present study was to determine the influence of chloride dialysate on metabolic acidosis control in this population. We enrolled 30 patients in maintenance HD program with a standard base excess (SBE) ≤2 mEq/L and urine output of less than 100 mL/24 h. The patients underwent dialysis three times per week with a chloride dialysate concentration of 111 mEq/L for 4 weeks, and thereafter with a chloride dialysate concentration of 107 mEq/L for the next 4 weeks. Arterial blood was drawn immediately before the second dialysis session of the week at the end of each phase, and the Stewart physicochemical approach was applied. The strong ion gap (SIG) decreased (from 7.5 ± 2.0 to 6.2 ± 1.9 mEq/L, P = 0.006) and the standard base excess (SBE) increased after the use of 107 mEq/L chloride dialysate (from -6.64 ± 1.7 to -4.73 ± 1.9 mEq/L, P < 0.0001). ∆SBE was inversely correlated with ∆SIG during thephases of the study (Pearson r = -0.684, P < 0.0001) and there wasno correlation with ∆chloride. When we applied the Stewart model, we demonstrated that thelower concentration of chloride dialysate interfered with the control of metabolic acidosis in HD patients, surprisingly, through theeffect on unmeasured anions.
Key words: Chloride dialysate; Hemodialysis; Metabolic acidosis; Stewart model
Introduction
Correspondence: F.O. Marques, Rua Vicente Leite, 700/900, 60170-150 Fortaleza, CE, Brasil. Fax: +55-85-3242-1354/3208-3100. E-mail: [email protected]
Received January 21, 2010. Accepted August 27, 2010. Available online September 17, 2010. Published October 18, 2010.
Metabolic acidosis is a common feature of chronic kidney disease (CKD), worsening progressively with renal func-tion decline (1). Nearly one-third to one-half of patients on maintenance hemodialysis (HD) have a predialysis serum
bicarbonate level below 22 mEq/L, in contrast to a serum level at or above 22 mEq/L as suggested by the K/DOQI
statement guidelines (2). In these patients, metabolic aci-dosis has detrimental effects such as renal osteodystrophy,
inflammation and impaired nutritional status (3-7).
The real determinants of acidosis in maintenance HD patients can be reanalyzed using the Stewart model, which considers water dissociation at the center of the acid-basic
status of body fluids and is based on six simultaneous
equations, incorporating the Laws of Mass Action, Mass Conservation and Electrical Neutrality (8).
The human plasma is a complex solution that consists
of fully dissociated ions (“strong ions” such as sodium, po-tassium, chloride, and lactate), partially dissociated “weak” acids (such as albumin and phosphate), and volatile buffers (carbonate species). Therefore, serum pH is determined by three independent variables: partial carbon dioxide tension (pCO2), the difference in charge between strong cations and strong anions (“strong ion difference” or SID) in plasma, and the total plasma concentration of nonvolatile weak acid buffers, mainly albumin and inorganic phosphate, with bicarbonate being a dependent variable (8,9).
Metabolic acidosis in maintenance hemodialysis 997
critical pediatric and trauma patients (10,11).
Liborio et al. (12) performed a cross-sectional study to identify and quantify each component of metabolic acidosis in hemodialysis patients using the physicochemical approach. Their study showed that metabolic acidosis in this population was due to retention of unmeasured anions, hyperchloremia and hyperphosphatemia. Thus, it was proposed that hyper-chloremia was an important component of metabolic acidosis in hemodialysis patients.
As the chloride ion is one of the multiple factors involved in metabolic acidosis in hemodialysis patients, we analyzed one of the main sources of this anion, i.e., the dialysis solution. The aim of the present study was to detect the effect of chloride dialysate on metabolic acidosis control, while maintaining a stable bicarbonate dialysate level in this population.
Patients and Methods
Hemodialysis patients and study design
We enrolled 30 patients submitted to a maintenance hemodialysis program three times a week for at least 4 h, within a minimum period of 3 months. The patients were selected from a single dialysis center according to the fol-lowing inclusion criteria: predialysis blood gas with standard
base excess (SBE) ≤2 mEq/L, urine output of less than 100 mL/24 h, 18 years of age or older; arterial pressure levels below 140/90 mmHg with or without antihypertensive therapy; interdialytic fluid gain ≤50 mL/kg, and absence of hypertensive
emergency events or congestive heart failure.
The study was divided into two phases from May to July
2009. In the first phase, the chloride dialysate concentration was set at 111 mEq/L for 4 weeks and in the second phase,
for the next 4 weeks, at 107 mEq/L. The setting of chloride dialysate concentration was attained by modifying sodium dialysate in the same proportion.The dialysate composition
was 2.0 mEq/L potassium, 32 mEq/L bicarbonate, 3.0 mEq/L acetate, 3.5 mEq/L calcium, and 1.0 mEq/L magnesium. Sodium was 140 mEq/L during the first phase and 136 mEq/L during the second phase. The ionic concentrations of
the dialysate were measured directly to identify changes in sodium and chloride levels according to the study phase.
Vascular access was achieved through a native
arterio-venous fistula in all patients, without evidence of stenosis or recirculation. A high-flow and high-efficiency dialyzer was
used (F-80, Fresenius, Germany). The dialysis equipment consisted of a Fresenius 4008-S instrument and the dialysate
flow was set at 500 mL/min. Blood flow was set at a range of 350-450 mL/min. The Ethics Committee of Federal University
of Ceará approved the study design and written informed consent was obtained from all patients.
Analysis of blood
Laboratory analysis was carried out using arterial blood drawn immediately before the midweek dialysis session
dur-ing the last week of use of modified dialysate concentration.
All samples were analyzed with a Cobas 400 Plus analyzer (Roche Diagnostics, Germany) and standard reagents were used to measure biochemical variables, including urea, sodium, chloride, potassium, calcium, phosphate, magne-sium, and albumin. Blood gases and lactate were analyzed using Eletrodo Rapid lab 348 (Bayer, Germany). SBE was determined according to the Van Slyke equation.
Interpretation of quantitative acid-base analysis The quantitative physicochemical analysis of the results was performed using the Stewart-Figge approach. This model involves the following principles: 1) apparent SID
(SIDa) = [Na+] + [K+] + [Ca2+] + [Mg2+] - [Cl-] - [lactate-],
expressing all concentrations in mEq/L; 2) effective SID
(SIDe), representing the weak acid effect on the balance of electrical charges in plasma, was calculated using the
formula: SIDe = [(2.46 x 10⁻⁸) x (pCO
2/(10-pH))] + [(albu
-min) x (0.123 x pH - 0.631)] + [(phosphate) x (0.309 x pH
- 0.469)], pCO2 in mmHg, albumin in g/L, and phosphate in
mM; 3) strong ion gap (SIG) = SIDa - SIDe, represents the
unmeasured anions (sulfate, ketoacids, citrate, pyruvate, acetate, and others).
Adequacy of dialysis and estimated protein intake The adequacy of dialysis was evaluated by the
equili-brated Kt/V (eq Kt/V) equation, obtained from the single pool Kt/V (sp Kt/V), and estimated protein intake by the normal
-ized protein catabolic rate: 1) sp Kt/V = -ln (Req - 0.008 x t) + [4 - (3.5 x Req)] x UF/W; where ln = natural logarithm, Req = post- and pre-dialysis blood urea nitrogen ratio, t = duration of hemodialysis session in hours, UF = ultrafiltra -tion volume in liters, W = post-dialysis weight in kg; 2) eq
Kt/V = sp Kt/V (1 - 0.60 / t) + 0.03; 3) PCRn (g·kg-1·day-1)
= (pre-dialysis BUN / [25.8 + (1.15 / Kt/V)] + [(56.4 / Kt/V)]) + 0.168; where BUN = blood urea nitrogen (mM).
Statistical analyses
Data are reported as means ± SD. Continuous variables were compared between groups using the D’Agostino and Pearson normality test, followed by the paired t-test. The
correlation coefficient (r) between pairs of variables was determined using Pearson’s method. Values of P < 0.05 were considered to be statistically significant. All statisti -cal analyses were performed using the Graph Pad Prism program, version 5.02 (Graph Pad software, USA).
Results
Demographic features
Twenty-one male and 9 female patients were studied. Mean age was 47 ± 15.7 years (Table 1). The etiology
of CKD was chronic glomerulonephritis (N = 5), diabetic nephropathy (N = 3), hypertensive nephrosclerosis (N = 6), and polycystic kidney disease (N = 2). Fourteen patients
on dialysis treatment was 7.6 ± 4 years. Five patients had undergone previous renal transplantation.
Acid-base variables in hemodialysis patients
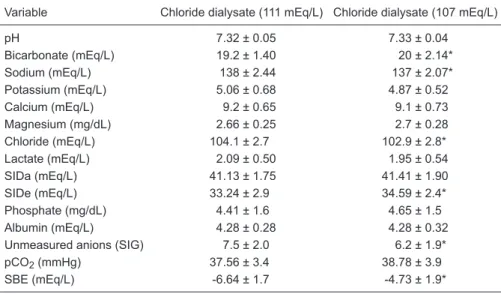
After the use of a chloride dialysate of 111 mEq/L, the
patients persisted with a mean SBE of -6.64 ± 1.7. Analysis based on the physicochemical approach revealed that meta-bolic acidosis in these patients was due almost exclusively to the accumulation of unmeasured anions, represented by
a SIG of 7.5 ± 2.0 mEq/L. SIDa was within the normal range,
similar to the other determinants of acid-base status.
When the chloride dialysate level was fixed at 107 mEq/L, SBE improvement was observed (from -6.64 ± 1.7 to -4.73 ± 1.9 mEq/L, P < 0.0001). As expected, se -rum sodium was reduced (from 138 ± 2.44 to 137 ± 2.07
mEq/L, P = 0.02), as also was serum chloride (from 104.1 ± 2.7 to 102.9 ± 2.8 mEq/L, P = 0.03). When investigating
the cause of metabolic acidosis correction, we observed no difference in SIDa (see Table 2) and the increase in
SBE (1.9 mEq/L) was almost completely explained by SIG reduction (1.3 mEq/L).
Influence of unmeasured anions on standard base
excess
Pearson’s correlation analysis was also used to
inves-tigate the interrelationship between the ∆SBE (difference
between SBE after using chloride dialysate of 111 and
107 mEq/L) and ∆ of each of the acid-base determinants. We observed that ∆SBE was inversely correlated with the unmeasured anion variation (∆SIG) between the two study
phases, which was the only significant variable (Pearson r = -0.684, P < 0.0001).Other variables, ∆sodium, ∆chloride, ∆potassium, ∆calcium, ∆magnesium, ∆lactate and ∆phos -phate, did not correlate with SBE.
In addition to the analysis of acid-base variables, there
was no statistically significant difference between compo -nents that could be involved in the control of metabolic
Table 1. Characteristics of hemodialysis patients.
Clinical characteristics
Age (years) 47 ± 15.7
Gender (male/female) 21/9
Weight (kg) 64.25 ± 12.6
Height (m) 1.64 ± 0.1
BMI (kg/m2) 24 ± 4.3
Mean time on hemodialysis (years) 7.6 ± 4.0 Etiology of CKD
Unknown 14 (46.6%)
Hypertensive nephrosclerosis 6 (20%) Chronic glomerulonephritis 5 (16.7%) Diabetes mellitus 3 (10%) Polycystic kidney disease 2 (6.7%) Previous renal transplantation 5 (17%)
Data are reported as means ± SD or as number with percent in parentheses for 30 patients. BMI = body mass index; CKD = chronic kidney disease.
Table 2. Comparison of acid-base variables after the use of chloride dialysate of 111 and 107 mEq/L.
Variable Chloride dialysate (111 mEq/L) Chloride dialysate (107 mEq/L)
pH 7.32 ± 0.05 7.33 ± 0.04
Bicarbonate (mEq/L) 19.2 ± 1.40 20 ± 2.14*
Sodium (mEq/L) 138 ± 2.44 137 ± 2.07*
Potassium (mEq/L) 5.06 ± 0.68 4.87 ± 0.52
Calcium (mEq/L) 9.2 ± 0.65 9.1 ± 0.73
Magnesium (mg/dL) 2.66 ± 0.25 2.7 ± 0.28 Chloride (mEq/L) 104.1 ± 2.7 102.9 ± 2.8*
Lactate (mEq/L) 2.09 ± 0.50 1.95 ± 0.54
SIDa (mEq/L) 41.13 ± 1.75 41.41 ± 1.90
SIDe (mEq/L) 33.24 ± 2.9 34.59 ± 2.4*
Phosphate (mg/dL) 4.41 ± 1.6 4.65 ± 1.5
Albumin (mEq/L) 4.28 ± 0.28 4.28 ± 0.32
Unmeasured anions (SIG) 7.5 ± 2.0 6.2 ± 1.9* pCO2 (mmHg) 37.56 ± 3.4 38.78 ± 3.9
SBE (mEq/L) -6.64 ± 1.7 -4.73 ± 1.9*
Metabolic acidosis in maintenance hemodialysis 999
acidosis in hemodialysis patients, according to study phase,
as eq Kt/V, PCRn, phosphorus binders, interdialytic weight
gain, and serum osmolality.
Discussion
Although acidosis has complex and multiple etiologies in maintenance hemodialysis, the acidosis composition is still unknown (13). In addition to the unmeasured anions, hyper-chloremia and phosphate are important components.
Until recently, it was difficult to demonstrate which fac
-tors affected by dialysis had the most influence on acidosis.
Regardless of bicarbonate diffusion has been the center of acidosis correction, it is necessary to remove the anions resulting from metabolism, while bicarbonate is being replaced. Although the identification of which components are mainly responsible for the unmeasured anions, the
physicochemical approach made their quantification pos -sible through relatively simple equations.
While analyzing the factors involved in the maintenance
of patients’ metabolic acidosis, significant differences in SBE
were observed. This variable is frequently used to quantify the degree of metabolic acidosis, and can be used as a tool to demonstrate changes in the components of the acid-base balance, especially in critically ill patients (14). Although it is considered obsolete by some investigators, the change in SBE is directly related to the concentration of weak acids, which is independent of the respiratory component, thus being preferred to bicarbonate (15).
Even though dialysis plays a role in the correction of
acidosis, the influence of dialysate ion concentration on
this acid-base control process is unexplored. In the present study, when sodium and chloride dialysate concentrations were reduced, we observed a better correction of SBE than during the use of a high sodium and chloride concentration dialysate, although the same bicarbonate concentration was used in the dialysate.
More noteworthy is the fact that metabolic acidosis correction was mainly due to a reduction of unmeasured anions, represented by SIG. At the beginning of the study, it was hypothesized that acidosis correction was more predictable by an increase in SIDa. This was possible by reducing serum chloride levels due to reduced concentration in the dialysate. At the same time, a lesser improvement in serum sodium was predictable due to individual and constant
osmolar set points (16), suggesting that its variations have a minor impact on acid-base variables.
Surprisingly, metabolic acidosis improvement was ob-served due to unmeasured anion reduction. We suggest that the reduction in serum chloride during the post-dialysis period can facilitate redistribution from the intracellular or interstitial compartment, a shift described in septic animals by Kellum et al. (17). This decrease in intracellular chloride can improve the intracellular capacity of buffering other negative charges, reducing plasma unmeasured anions.
However, this analysis became more complex when we considered multiple cellular aqueous compartments (plasma, erythrocytes, interstitial and intracellular com-partments), containing a variety of strong ions and weak acids and incorporating several interlinked Gibbs-Donnan equilibria (18). Recently, a similar pattern has been demon-strated in septic patients, in whom a higher renal clearance of chloride was not accompanied by a reduction in serum chloride, but by a reduction in unmeasured anions (19).
Another possible explanation may be found in the di-alysate compartment. It has been suggested that a higher dialysate chloride concentration, through Gibbs-Donnan equilibrium across the dialyzer membrane, partially prevents an adequate clearance of unmeasured anions due to a charge effect, i.e., electric repulsion of a negative charge. Moreover, based on this principle, it is not possible to ex-clude that an improvement in bicarbonate diffusion might have been the result of using a lower dialysate chloride concentration.
Although a decrease in SIG is suggestive of unmeasured anion reduction, this study presents limitations: unmeasured anions are estimated based on calculations using many variables and the possibility of minor changes in each one
can result in significant variations in their final value.
Additional studies may be needed to demonstrate the relationship between the effects of the prescribed dialysis and long-term effects of acidosis, accumulation of un-measured anions, hyperchloremia and its effects on bone
metabolism, inflammation and nutrition.
Acknowledgments
Research supported by the Liver and Kidney Diseases Research Center of Federal University of Ceará (CPDHR-CE), Walter Cantídio University Hospital.
References
1. Kraut JA, Kurtz I. Metabolic acidosis of CKD: diagnosis, clini-cal characteristics, and treatment. Am J Kidney Dis 2005; 45: 978-993.
2. K/DOQI clinical practice guidelines for bone metabolism and disease in chronic kidney disease. Am J Kidney Dis 2003; 42: S1-S201.
3. Uribarri J, Levin NW, Delmez J, Depner TA, Ornt D, Owen W, et al. Association of acidosis and nutritional parameters in hemodialysis patients. Am J Kidney Dis 1999; 34: 493-499.
patients. French Study Group for Nutrition in Dialysis. Semin Dial 2000; 13: 241-246.
5. Mitch WE. Metabolic acidosis stimulates protein metabolism in uremia. Miner Electrolyte Metab 1996; 22: 62-65. 6. Ballmer PE, McNurlan MA, Hulter HN, Anderson SE, Garlick
PJ, Krapf R. Chronic metabolic acidosis decreases albumin synthesis and induces negative nitrogen balance in humans.
J Clin Invest 1995; 95: 39-45.
7. Lowrie EG, Lew NL. Death risk in hemodialysis patients: the predictive value of commonly measured variables and an evaluation of death rate differences between facilities. Am J Kidney Dis 1990; 15: 458-482.
8. Morgan TJ. The Stewart approach - one clinician’s perspec-tive. Clin Biochem Rev 2009; 30: 41-54.
9. Corey HE. Stewart and beyond: new models of acid-base balance. Kidney Int 2003; 64: 777-787.
10. Balasubramanyan N, Havens PL, Hoffman GM. Unmea-sured anions identified by the Fencl-Stewart method predict mortality better than base excess, anion gap, and lactate in patients in the pediatric intensive care unit. Crit Care Med
1999; 27: 1577-1581.
11. Kaplan LJ, Kellum JA. Comparison of acid-base models for prediction of hospital mortality after trauma. Shock 2008; 29:
662-666.
12. Liborio AB, Daher EF, de Castro MC. Characterization of acid-base status in maintenance hemodialysis: physico-chemical approach. J Artif Organs 2008; 11: 156-159. 13. Story DA, Tosolini A, Bellomo R, Leblanc M, Bragantini L,
Ronco C. Plasma acid-base changes in chronic renal failure: a Stewart analysis. Int J Artif Organs 2005; 28: 961-965. 14. Maciel AT, Park M. Unmeasured anions account for most
of the metabolic acidosis in patients with hyperlactatemia.
Clinics 2007; 62: 55-62.
15. Kellum JA. Clinical review: reunification of acid-base physiol-ogy. Crit Care 2005; 9: 500-507.
16. Flanigan MJ. Role of sodium in hemodialysis. Kidney Int Suppl 2000; 76: S72-S78.
17. Kellum JA, Bellomo R, Kramer DJ, Pinsky MR. Etiology of metabolic acidosis during saline resuscitation in endotox-emia. Shock 1998; 9: 364-368.
18. Morgan TJ. Invited commentary: Putting standard base excess to the test. J Crit Care 2009; 24: 492-493.
19. Noritomi DT, Soriano FG, Kellum JA, Cappi SB, Biselli PJ, Liborio AB, et al. Metabolic acidosis in patients with severe sepsis and septic shock: a longitudinal quantitative study.