Article
Printed in Brazil - ©2012 Sociedade Brasileira de Química0103 - 5053 $6.00+0.00
A
*e-mail: [email protected]
Spatial Structure of
Eugenia dysenterica
Based on Essential Oil Chemovariations and
Implications for Conservation and Management of the Genetic Diversity of its Populations
Eliane C. Vilela,a Thays C. Carvalho,a Alessandra R. Duarte,a Ronaldo R. Naves,b Suzana C. Santos,a José C. Seraphinc and Pedro H. Ferri*,a
aInstituto de Química, bEscola de Agronomia e Engenharia de Alimentos and cInstituto de Matemática e Estatística, Universidade Federal de Goiás,
CP 131, 74001-970 Goiânia-GO, Brazil
A composição química dos óleos essenciais foi utilizada para estudar a estrutura espacial de oito populações de Eugenia dysenterica do Cerrado central brasileiro. O particionamento da variação utilizando os conjuntos de dados espaciais e ambientais como preditores foi altamente significativo e explicou 7,8 e 8,1% da variação total dos óleos essenciais, respectivamente. Os resultados sugeriram que o polimorfismo nos óleos essenciais foi determinado mais por fatores genéticos do que ambientais. Além disso, o intercepto do autocorrelograma multivariado de Mantel entre as matrizes de distância dos constituintes químicos e dos locais de coleta sugere que as populações se diferenciam quimicamente a distâncias geográficas superiores a 120 km, contribuindo como indicador alternativo da distância mínima entre amostras necessária para a conservação da diversidade genética das populações.
The chemical composition of essential oils was used to study the spatial structure of eight Eugenia dysenterica populations in central Brazilian Cerrado. Variation partitioning using spatial and environmental data sets as predictors was highly significant and explained 7.8 and 8.1% of oil chemovariations, respectively. Results suggested that essential oil polymorphism was genetically rather than environmentally determined. Furthermore, the intercept of the multivariate Mantel autocorrelogram between the distance matrices of oil constituents and sampling sites suggested that the populations differ chemically whenever geographical distance exceeds 120 km. It stands, therefore, as an alternative indicator of the minimal distance between samples required for conserving the genetic diversity of populations.
Keywords: Eugenia dysenterica, essential oil, variation partitioning, spatial pattern, spatial autocorrelation
Introduction
The Cerrado Biome spans about a quarter of the Brazilian territory and is characterized by the phytophysiognomic gradient from grassland to forest formations.1 Despite
Cerrado status as a biodiversity hotspot which houses over 11,000 species of native plants, including 4,400 endemic species, only about 2.2% of its area enjoys legal protection.2
Central Brazilian Cerrado was severely fragmented and degraded by deforestation in the early 1950s, a process accelerated in the 1970s with the expansion of the agricultural frontier.3 An estimation by remote sensing
shows that about 47.8% of Cerrado original vegetation had
been cleared by 2008 mainly due to cultivated pastures and agricultural crops.4 After the Atlantic Forest, Cerrado
is the Brazilian Biome that has suffered the greatest anthropogenic impacts, and has been classified among the most threatened biomes in the world.5 Thus, strategies to
manage, conserve and domesticate wild species are required for the sustainable exploitation of this region.
Among the many tree species found in the Cerrado Biome,
Eugenia dysenterica DC. (Myrtaceae), or “cagaiteira” tree,
is unique because of its wide range of uses by local human populations.6 Its fruits are appreciated for their taste and
are consumed in natura or processed to produce different
kinds of sweet, jelly, ice cream, liqueur and wine.7 A
non-toxic peptide from pulp fruits shows in vivo laxative activity
constipation and irritable bowel syndrome treatments.8
Commercial frozen pulps exhibit high α-glucosidase and
α-amylase inhibitory activities and represent a potential tool for treating diabetes.9 In addition, leaf extracts reveal
potential in vitro activities against rotavirus and systemic
fungi, which confirms its ethnopharmacological use for treating diarrhoea and dysentery.10
E. dysenterica is a perennial species with a long
life cycle, and is mainly pollinated by bees and primate (including human) seed dispersal.11 These biological and
ecological factors often lead to greater genetic variability among populations, including a specific spatial pattern.12
In fact, E. dysenterica populations located in Southeast
Goiás State have been the object of various genetic studies based on morphological and isozymatic descriptors,13-15
as well as on DNA markers such as simple sequence repeats (SSR) and random amplification of polymorphic DNA (RAPD).16,17 All of these descriptors showed a
similar genetic profile for populations located at around 120 km. This profile decreases with increasing distance, so that populations located more than 190-200 km away become genetically different as far as these descriptors are concerned.14,16 According to this finding, it would
be possible to decide which groups of local populations should be given priority in sampling or preserving,18 as the
distribution of genetic variation in the geographical space is an essential factor for the conservation and management of wild populations.19
It has been recently suggested that the chemical variation of essential oils from E. dysenterica leaves
seems to point towards a strong genetic influence on oil chemical composition (chemotypes), despite another recent finding which revealed that chemical variation also resulted in a response to selective pressures under different environmental conditions (ecotypes) for E. dysenterica.20
These facts suggest that chemical polymorphism in essential oils can be used as an additional criterion in strategies for sample selection and conservation.
Therefore, the chemical variability in essential oils from eight E. dysenterica populations located in Southeast
Goiás State was performed by gas chromatography coupled with mass spectrometry (GC-MS). Matrices containing the chemical information of the essential oils, geographical coordinates of sampling sites and the physicochemical analysis of soil and foliar nutrients were submitted to chemometric techniques, including a spatial analysis, which enabled the detection of chemical variability patterns in the samples along the environmental and spatial gradient of the populations. Measuring the degree of chemical differentiation among populations and the associated spatial pattern of such chemical divergence may help to develop
a new, additional criterion based on chemical profile for the conservation and management of E. dysenterica in the
Cerrado region.
Results and Discussion
In this study, 121 essential oils were extracted from
E. dysenterica trees originated from eight populations in
Southeast Goiás State. A list of the populations investigated, as well as their provenance, is shown in the Supplementary Information (SI) section (Table S1, Figure S1). The main soil features that showed the highest variations among the sampled original populations were clay, silt, Al3+, potential
acidity (H + Al3+), organic matter, macronutrients (K+,
Ca2+, Mg2+) and micronutrients (Zn2+, Mn2+), in addition to
leaf nutrients (Fe3+, Zn2+, Mn2+).13 A total of 49 chemical
constituents (Table S2), mainly sesquiterpenes (30), were measured in each essential oil.
Essential oils revealed a predominance of sesquiterpenes (range of 61.2-80.1%), particularly of sesquiterpene hydrocarbons (47.6-68.5%).Οxygenated sesquiterpenes only showed the lowest values in Campo Alegre de Goiás (4),
Cristalina (5) and Senador Canedo (7) (2.29-5.23%). With
the exception of the population from Três Ranchos (3),
which showed the lowest levels of monoterpene hydrocarbons (7.81%), all other samples showed moderate amounts of monoterpenes (12.8-29.1%).
The most abundant constituent throughout the populations analyzed was (E)-caryophyllene (7.15 31.9%,
average value of 18.5%), even though it showed the lowest value in specimens from Goiânia (8). α-Copaene showed a high percentage (6.87-12.85%; 8.34%), except in the populations from Senador Canedo (3.66%) and Goiânia (5.34%). Despite the high amounts of α-humulene (7.02-12.7%, 9.90%) and δ-cadinene (5.05 12.2%, 8.85%), these constituents did not reveal any significant differences among populations. These results are in agreement with previous studies,20 although they differ regarding minor
constituents. High contents of (E)-caryophyllene, which
are known to prevent herbivory,21 suggest that this essential
oil may provide E. dysenterica with selective advantages
over native species in terms of habitat adaptation against herbivores.
Canonical redundancy analysis (RDA) showed a high correlation between environmental variables (soil and foliar nutrients) and essential oil chemovariations. A significance test with an unrestricted Monte Carlo permutation (999 permutations) found Fischer’s F-ratio for the first
canonical axis (F-value = 10.880; p = 0.002) and for all
canonical axes (F = 3.090; p = 0.002), giving signs that
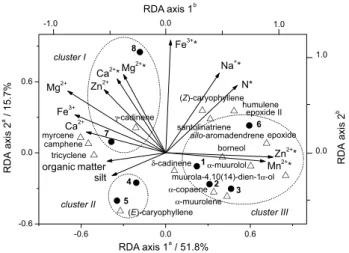
According to the triplot shown in Figure 1, RDA axis 1 clearly correlated to foliar micronutrients (Mn2+,
Zn2+) in samples from Catalão-1 (1), Catalão-2 (2), Três
Ranchos (3) and Luziânia (6), whereas an increase in the
value of RDA axis 2 is mainly associated with an increase in foliar and soil macronutrients (Ca2+, Mg2+, Fe3+) from
Goiânia (8) and Senador Canedo (7) samples, which
reveal high amounts of γ-cadinene (7.77-10.7%; 9.80%). In addition, the decrease in values of RDA axes 1 and 2 is also highly linked to an increment in silt texture and organic matter of soils in Campo Alegre de Goiás (4) and
Cristalina (5), whose samples showed the highest
(E)-caryophyllene content (20.9-31.9%; 25.8%).
A similar hierarchical structure emerges when it is considered the oil constituents grouped together according to carbon skeletons (Table S3 and Figure S2).
Canonical discriminant analysis (CDA) on chemical data confirmed an a priori clustering tendency in the
first RDA factorial plane (Table S4 and Figure S3). An axial representation of CDA results discriminated the three groups based only on the contents of α-muurolol,
γ-cadinene, (E)-caryophyllene and foliar nutrients Ca2+ and
Mn2+ as predictor variables. The fitted model showed a high
canonical correlation (R =0.970) and a significant Wilks’
lambda (Λ = 0.023; p < 0.0001), which accounts for a
multivariate measure of group differences over predictor variables. The first discriminant function distinguished clusters I and II due to high positive and negative scores of leaf Ca2+ and (E)-caryophyllene, respectively, whereas
cluster III was separated according to high negative scores of α-muurolol and Mn2+ from leaves. It was also possible to
make an accurate prediction of 98% well-classification in the original clusters via the cross-validation approach. This shows that the entire group contributes to discrimination, not only individual plants. The only predicted mismatched classification referred to three samples from cluster III (Luziânia population, 6) which had been classified as
belonging to cluster II. Such misclassification might have been caused by a higher level of (E)-caryophyllene in the
samples, which is characteristic of cluster I. Percentages of oil constituents (or of the constituents that were rearranged according to carbon skeletons) in clustered samples are shown in the SI section (Tables S5 and S6).
For the study of spatial chemical structure, the matrices of Euclidean distances from geographical coordinates and essential oil data sets (chemical constituents or oil constituents rearranged according to carbon skeletons) were submitted to a general linear Mantel test, a randomization technique used to determine associations between distance matrices.23 The results showed a significant correlation
(Mantel’s correlation; r = 0.132, p = 0.001 and r = 0.060, p = 0.009, respectively), suggesting that spatial distribution
in both oil data sets are not random. These results were confirmed by the variation partitioning performed by partial RDAs on response chemical matrices.24 RDAs on
oil constituent data set (Table 1) showed that the variation explained only by environmental factors ([A] = 8.1%) is similar for the pure spatial influence ([C] = 7.8%), whereas only 0.2% of variation in essential oils was explained by a environmental-spatial joint effect ([B]). In contrast, the high unexplained variation in oil constituent data (see residuals, [D] = 84%) suggested that essential oil chemovariations should be mainly determined by genetic factors.25
A Monte Carlo permutation test of trace statistics (sum of all canonical eigenvalues) and under the first eigenvalue confirmed the significance of the canonical relationship between chemical matrices and spatial variables (p < 0.001).
Similar results of variation partitioning were obtained for oil constituents rearranged according to carbon skeletons (data not shown). A Venn diagram showing the variation partitioning is shown in Figure S4.
Even though the Mantel test and the partial RDAs were able to detect (and quantify) the spatial influence, they revealed nothing about the kind of relationship that exists between chemicals and spatial data sets. Thus, the multivariate Mantel correlograms (Figure 2) were obtained for the two chemical data sets with the use of spatial analyses.26
The profile of Mantel correlograms showed a decrease in chemical similarity as geographical distances increased, regardless of the essential oil data type. This pattern is similar to those obtained via an isolation-by-distance
Figure 1. Triplot of the first two RDA axes showing the distribution of
E. dysenterica populations (; 1-8). Soil and foliar (*) nutrient parameters
model,27 which confirms that the spatial distribution
of essential oil data sets did not arise by chance. The
x-intercept in the Mantel correlograms (175 and 117 km;
Figures 2a and 2b, respectively) shows that only populations located at a shorter distance have more chemical similarities in their essential oils than is expected by chance. Below this value, populations are regarded as a homogeneous chemical group and consequently as a chemical operational unit, similar to genetic operational units for the purposes of conserving and managing populations.28 This suggests that
populations of the minimum distance of 120 km (carbon
skeleton data set) may be considered different as regards essential oil chemovariations, which seem to reflect the genetic variability among the sampled populations.
A few differences were observed between the clusters established by RDA/CDA analyses and the results from spatial statistics. Populations 1-3 and from Luziânia (6)
(cluster III) exceed 180 km between them, which suggests two distinct chemical units, even though they were clustered by RDA/CDA. However, samples from Cristalina (5) and
Campo Alegre de Goiás (4) move away from Luziânia and
populations 1-3 approximately 130 km, respectively, thus
justifying the clustering of their populations (cluster II). This shows that populations located east of Corumbá River are more complex for conservational purposes, a finding in accordance with genetic markers.18
In fact, the pattern for E. dysenterica essential oils is
in agreement with the evolutionary isolation by distance model observed for morphological and isozymatic descriptors,13-15 as well as for SSR and RAPD genetic
markers.16,17 In previous studies, the x-intercept was located
at around 120 km, a finding which suggests that at least the populations to the east and west of the Corumbá River basin should be considered different conservation units and that at least one population from each group should be conserved. This similarity between the two chemical data sets with genetic markers is consistent with the findings of other studies which used terpenoids and isozymes, RAPD, amplified fragment length polymorphism (AFLP), SSR and inter-simple sequence repeat (ISSR) molecular markers.29
Unlike the spatial pattern found in Myrciaria cauliflora
(Mart.) O. Berg., Myrtaceae) essential oils,25 which
occurred at a local scale and thus suggested distinct ecotypes, the chemical differentiation among E. dysenterica
samples could be explained by isolation due to geographical
Table 1. Summary of the variation partitioning of E. dysenterica oil constituents using partial RDAs, with environmental and spatial data as predictors Effect and main variables
(covariable) Variation fraction
Explained variation (sum λa / %)
Pb
(sum λ)
Explained variation (λ1c / %)
P
(λ1)
Total effect
Environmental, spatial [A + B + C] 16.1 0.001 8.3 0.001
Partial effects
Environmental [A + B] 8.3 0.001 3.8 0.001
Environmental (spatial) [A] 8.1 0.001 4.4 0.001
Spatial [B + C] 8.0 0.001 6.0 0.001
Spatial (environmental) [C] 7.8 0.001 6.5 0.001
Joint effect
Environmental, spatial [B] 0.2
Residuals [D] 84.0
aSum of canonical eigenvalues (λ) divided by total inertia (1.0) × 100; bprobability on Monte Carlo test (999 permutations); cfirst autovalue. The spatial data
consist of significant monomials (x2, x2y3) of third-order polynomial trend surface originated from the first two PCA axes of UTM geographical coordinates
(northing, easting) and altitude of the sampling sites.
Figure 2. Spatial structure of E. dysenterica populations based on multivariate Mantel correlograms of RDA axis 1 scores for (a) essential oil constituents and (b) oil constituents rearranged according to carbon skeletons. Black circles represent significant (p < 0.05) Mantel statistical
distance, as a result of low-level gene flow among populations.15-18 However, this fact should be carefully
applied since an extrinsic barrier to gene flow has not always proved necessary for adaptive divergence emerging from isolation in novel habitats and causing speciation.30
Terpenes, especially the ones that take part in defense and host recognition mechanisms between a plant (plant interactions) and its herbivores, may play an important role in explaining the observed geographical distribution of species.31
Regardless of the underlying process operating in
E. dysenterica, essential oil chemovariations may be used
as an additional tool to establish in situ conservation areas
or sampling areas for ex situ conservation, which bring
together the concepts of representativeness and minimum viable population for conservation and management strategies.32
Conclusions
Essential oil analyses of eight E. dysenterica populations
found in central Brazilian Cerrado revealed high chemical polymorphism, which was mainly related to genetic influences. Furthermore, the multivariate analyses, including those pertaining to spatial patterns, support the use of essential oils as an additional tool to establish chemical units for the management of this species.
Experimental
Essential oil extraction
E. dysenterica samples were collected in July 2010 from
121 trees originated from eight populations in Southeast Goiás State, Brazil. To assess essential oils, leaves were dried at room temperature for seven days at 30 °C until constant weight. After powdering, the dried phytomass (50-100 g) of each sample was submitted to hydrodistillation (2 h) using a modified Clevenger-type apparatus. At the end of each distillation, the oils were collected and dried with anhydrous Na2SO4, then transferred to glass flasks where
they were kept at a temperature of −18 °C. Oil yields (%) were based on the dried weight of plant samples.
Soil and leaf parameters
Soil parameters of sampling sites (P, K+, Ca2+, Mg2+,
Al3+, Zn2+, Cu2+, Fe3+, Mn2+, pH, organic matter, cationic
exchange capacity (CEC), potential acidity (H + Al3+) and
soil textures) as well as representative leaf nutrients of each population (N, P, S, K+, Na+, Ca2+, Mg2+, Zn2+, Cu2+,
Fe3+ and Mn2+) previously reported by Telles et al.13 were
ordered in an environmental data matrix with 27 variables for each sampling site. Organic matter and soil textures were submitted to angular transformation, whereas the other variables were log(x + 1)-transformed.
Essential oil analyses
Oil sample analyses were performed on a GC MS Shimadzu QP5050A instrument under the following conditions: (i) a CBP-5 (Shimadzu) fused silica capillary
column (30 m × 0.25 mm i.d., 0.25 µm film thickness) connected to a quadrupole detector operating in the EI mode at 70 eV with a scan mass range of 40 400 m/z
at a sampling rate of 1.0 scan s−1; (ii) He as carrier gas
(1 mL min−1); (iii) injector and interface temperatures of
220 and 240 °C, respectively, with a split ratio of 1:20. The injection volume was 0.4 µL (20% in hexane) and the oven temperature was raised from 60 to 246 °C with an increase of 3 °C min−1, then of 10 °C min−1 to 270 °C, holding the
final temperature for 5 min.
Essential oil constituents were identified by comparing their mass spectra with those recorded by the National Institute of Standards and Technology,33 and by
comparing mass spectra and calculated linear retention indices (RI) with values found in the literature.34 Retention
indices were obtained by co-injection with a mixture of linear hydrocarbons, C8–C32 (Sigma, USA), and by Dool and Kratz’s equation.35 Representative total ion
chromatograms (TIC) of essential oil populations are shown in Figures S5 to S12.
Statistical analyses
Canonical redundancy analysis (RDA) was applied to describe the patterns of the only explained variation of interrelationships between essential oil constituents (121 × 49 = 5,929) or oil constituents rearranged according to carbon skeletons (121 × 14 = 1,694), in addition to the interspecific variations as a function of soil and leaf parameters (121 × 27 = 3,267), treated as environmental variables.22 An unrestricted Monte-Carlo permutation
test (999 permutations) was used to test the eigenvalue significance of the first canonical axis as well as the sum (trace) of all canonical axes.
Discriminant analyses via SAS CANDISC and SAS DISCRIM procedures were used to distinguish samples and the clustering tendency in the first two RDA axes on the basis of essential oil composition.36 The predictive ability
Partial RDA produced constrained ordinations while controlling the effect of a number of significant predictor variables. Total variation partitioning of species data between environmental (soil and foliar nutrients) and spatial components was obtained by partial RDA.24 Spatial
data consisted of two-dimensional UTM geographical coordinates of plant individuals (northing, easting) and altitude, which were summarized by the PCA first two extracted axes (new x and y coordinates). The new
consensus x and y coordinates was completed by adding all
terms of a third-order trend surface polynomial equation. Significant monomials were selected via the forward selection procedure available in CANOCO for Windows,37
with Bonferroni’s adjustment and the variance inflation factor acting to decrease error type I and to assess the multicolinearity in the regression.
The variation partitioning yielded four fractions of species data variation: [A] local species variation, explained by environmental factors regardless of any spatial structure, [B] spatial structure in the species data which is shared by environmental factors, [C] spatial structure in the species data which is not shared by environmental factors, and [D] unexplained variation by predictor data sets.24 In addition,
the Mantel test was used to assess the significance of the relationship between the species similarity matrix and the geographical distance matrix.23 The Euclidean distance was
used to record these similarity matrices. Multivariate Mantel autocorrelograms (999 permutations) were performed in Pattern Analysis, Spatial Statistics and Geographic Exegesis (PASSAGE) software package.38
Multiple comparisons were established by univariate analysis of variance (one-way ANOVA) using SAS GLM procedure. All data was checked for homoscedasticity with the use of Hartley’s test. Whenever heteroscedasticity was observed, the variable was angular or rank-transformed. In addition, whenever a difference in ANOVA was established, a Tukey’s post-hoc test was performed. Results are given as
mean values and in some cases are joined by the standard deviation of independent measurements. p-Values below
0.05 were regarded as significant.
Supplementary Information
Supplementary data (Tables S1-S6, Figures S1-S12) are available free of charge at http://jbcs.sbq.org.br as a PDF file.
Acknowledgements
We are indebted to Conselho Nacional de Desenvolvimento Científico e Tecnológico (CNPq) and
Programa de Apoio ao Desenvolvimento Científico e Tecnológico (PADCT III) for their financial support, as well as to Conselho de Aperfeiçoamento do Ensino Superior (CAPES) and Fundação de Amparo à Pesquisa do Estado de Goiás (FAPEG) for granting fellowships to E. C. V., A. R. D. and T. C. C (PIBIC-UFG/CNPq).
References
1. Ribeiro, J. F.; Walter, B. M. In Cerrado: Ambiente e Flora;
Sano, S. M.; Almeida, S. P., eds.; Embrapa-CPAC: Planaltina, DF, Brasil, 1998.
2. Marris, E.; Nature2005, 437, 944.
3. Klink, C. A.; Machado, R. B.; Conserv. Biol.2005, 19, 707.
4. Sano, E. E.; Rosa R.; Brito, J. L. S.; Ferreira, L. G.; Environ. Monit. Assess.2009, 1, 1; http://www.mma.gov.br/estruturas/219/_
arquivos/texto_indicadoresdesmatamento_2010_219.pdf accessed in May 2012.
5. Myers, N.; Mittermeier, R. A.; Mittermeier, C. G.; Fonseca, G. A. B.; Kent, J.; Nature2000, 403, 853; Mittermeier, R. A.;
Gil, P. R.; Hoffman, M.; Pilgrim, J.; Brooks, T.; Mittermeier, C. G.; Lamoreux, J.; Fonseca, G. A. B.; Hotspots Revisited: Earth’s Biologically Richest and Most Endangered Terrestrial
Ecoregions; Conservation International: Arlington, VA, USA,
2005.
6. Fonseca, A.; Muniz, I. A. F.; Inf. Agropec.1992, 16, 12.
7. Almeida, S. P.; Silva, J.; Ribeiro, J. F.; Aproveitamento Alimentar de Espécies Nativas dos Cerrados: Araticum, Barú,
Cagaita e Jatobá; EMBRAPA-CPAC: Planaltina, DF, Brasil, 1987; Oliveira, M. E. S.; Pantoja, L.; Duarte, W. F.; Collela, C. F.; Valarelli, L. T.; Schwan, R. F.; Dias, D. R.; Food Res. Int.
2011, 44, 2391.
8. Lima, T. B.; Silva, O. N.; Oliveira, J. T. A.; Vasconcelos, I. M.; Scalabrin, F. B.; Rocha, T. L.; Grossi-de-Sa, M. F.; Silva, L. P.; Guadagnin, R. V.; Quirino, B. F.; Castro, C. F. S.; Leonardecz, E. L.; Franco, O. L.; Peptides 2010, 31, 1426.
9. Gonçalves, A. E. S. S.; Lajolo, F. M.; Genovese, M. I.; J. Agric. Food Chem. 2010, 58, 4666.
10. Costa, T. R.; Fernandes, O. F. L.; Santos, S. C.; Oliveira, C. M. A.; Lião, L. M.; Ferri, P. H.; Paula, J. R.; Ferreira, H. D.; Sales, B. H. N.; Silva, M. R. R.; J. Ethnopharmacol. 2000, 72, 111; Cecílio, A. B.; Faria, D. B.; Oliveira, P. C.; Caldas, S.; Oliveira, D. A.; Sobral, M. E. G.; Duarte, M. G. R.; Moreira, C. P. S.; Silva, C. G.; Almeida, V. L.; J. Ethnopharmacol. 2012,
141, 975.
11. Donadio, L. C.; Martins, A. B. G.; Valente, J. P.; Fruticultura Tropical; Funep: Jaboticabal, SP, Brasil, 1992; Ferreira M. B.; Cunha, L. H. S.; Inf. Agropec.1980, 6, 27.
12. Loveless, M. D.; Hamrick, J. L.; Annu. Rev. Ecol. Syst.1984,
15, 65; Proença, C. E. B.; Gibbs, P. E.; New Phytol.1994, 126,
13. Telles, M. P. C.; Silva, R. S. M.; Chaves, L. J.; Coelho, A. S. G.; Diniz-Filho, J. A. F.; Pesq. Agropec. Bras.2001, 36, 1387.
14. Telles, M. P. C.; Diniz-Filho, J. A. F.; Coelho, A. S. G.; Chaves, L. J.; Rev. Bras. Bot.2001, 24, 145.
15. Trindade, M. G.; Chaves, L. J.; Genet. Mol. Biol. 2005, 28, 407. 16. Zucchi, M. I.; Brondani, R. V.; Pinheiro, J. B.; Coelho, A. S. G.; Chaves, L. J.; Vencovsky, R.; Rev. Bras. Bot.2003, 26, 449. 17. Zucchi, M. I.; Pinheiro, J. B.; Chaves, L. J.; Coelho, A. S. G.;
Couto, M. A.; Morais, L. K.; Vencovsky, R.; Pesq. Agropec. Bras.2005, 40, 975.
18. Telles, M. P. C.; Coelho, A. S. G.; Chaves, L. J.; Diniz-Filho, J. A. F.; Valva, F. D.; Conserv. Genet.2003, 4, 68.
19. McCue, K. A.; Buckler, E. S.; Holtsford, T. P.; Conserv. Biol.
1996, 10, 1425.
20. Duarte, A. R.; Naves, R. R.; Santos, S. C.; Seraphin, J. C.; Ferri, P. H.; J. Braz. Chem. Soc. 2009, 20, 967; Duarte, A. R.; Naves,
R. R.; Santos, S. C.; Seraphin, J. C.; Ferri, P. H.; J. Braz. Chem. Soc. 2010, 21, 1459.
21. Love, A.; Naik, D.; Basak, S. K.; Babu, S.; Pathak, N.; Babu, C. R.; Chem. Biodivers. 2009, 6, 2263.
22. Lepš, J.; Šmilauer, P.; Multivariate Analysis of Ecological Data Using CANOCO; Cambridge University Press: Cambridge, UK,
2007.
23. Mantel, N.; Cancer Res.1967, 27, 209; Legendre, P.; Fortin,
M.-J.; Vegetation1989, 80, 107.
24. Borcard, D.; Legendre, P.; Drapeau, P.; Ecology1992, 73, 1045;
Legendre, P.; Legendre, L.; Numerical Ecology, 2nd ed.; Elsevier
Science: Amsterdam, 2003; Wagner, H.; Fortin, M.-J.; Ecology
2005, 86, 1975.
25. Duarte, A. R.; Santos, S. C.; Seraphin, J. C.; Ferri, P. H.; J. Braz. Chem. Soc. 2012, 23, 737.
26. Rossi, R. E.; Mulla, D. J.; Journel, A. G.; Franz, E. H.; Ecol. Monogr.1992, 62, 277.
27. Sokal, R. R.; Wartenberg, D. E.; Genetics1983, 105, 219; Sokal,
R. R.; Jacquez, G. M.; Evolution1991, 45, 152.
28. Diniz-Filho, J. A. F.; Telles, M. P. C.; Conserv. Biol.2002, 16,
924.
29. Nan, P.; Peng, S.; Shi, S.; Ren, H.; Yang, J.; Zhong, Y.; Z. Naturforsch. 2003, 58c, 57; Adams, R. P.; Socorro, M.;
Elizondo, G.; Elizondo, M. G.; Slinkman, E.; Biochem. Syst. Ecol.2006, 34, 205; Trindade, H.; Costa, M. M.; Lima, S. B.;
Pedro, L. G.; Figueiredo, A. C.; Barroso, J. G.; Biochem. Syst. Ecol.2009, 37, 670; Ben El Hadj Ali, I.; Guetat, A.;
Boussaid, M.; Ind. Crops Prod.2012, 40, 277.
30. Orr. M. R.; Smith, T. B.; Tree1998, 13, 502; Messaoud, C.;
Khoudja, M. L.; Boussaid, M.; Genet. Res. Crop Evol.2006,
53, 407.
31. Roussis, V.; Tsoukatou, M.; Petrakis, P. V.; Skoula, M.; Harborne, J.; Biochem. Syst. Ecol.2000, 28, 163; Ehlers, B. K.;
Thompson, J.; Oecologia2004, 141, 511.
32. Vencovsky, R.; Crossa, J.; Crop Sci.2003, 43,1912; Menges,
E. S.; Tree2000a, 15, 51; Menges, E. S.; Ecol. Bull.2000b,
48, 73.
33. National Institute of Standards and Technology (NIST); PC version of the NIST/EPA/NIH Mass Spectral Database; US
Department of Commerce: Gaithersburg, USA, 1998. 34. Adams, R. P.; Identification of Essential Oil Components by Gas
Chromatography/Mass Spectrometry, 4th ed.; Allured: Illinois,
USA, 2007.
35. Dool, H. V. D.; Kratz, P. D.; J. Chromatogr.1963, 11, 463. 36. Statistical Analysis System; SAS Institute Inc.: Cary, NC, USA,
1996.
37. Ter Braak, C. J. F.; Šmilauer, P.; CANOCO Reference Manual and CanoDraw for Windows User’s Guide: Software for
Canonical Community Ordination, version 4.5; Microcomputer
Power: New York, NY, USA, 2002.
38. Rosenberg, M. S.; Anderson, C. D.; Methods Ecol. Evol.2011,
2, 229.
Submitted: June 20, 2012