Planning to have a child: a socially conditioned
decision?
–Evidence from the European Social Survey (Round 2)
for Spain and Portugal
1Mendes, Maria Filomena
Universidade de Évora, Departamento de Sociologia Largo dos Colegiais, 2
7000 – 803 Évora, Portugal Tel. 351266740805
E- mail: [email protected]
Santos, José Rebelo dos
Escola Superior de Ciências Empresariais do Instituto Politécnico de Setúbal, Departamento de Comportamento Organizacional e Gestão de Recursos Humanos Campus do IPS, Estefanilha,
2914-503 Setúbal, Portugal, Tel. 351265790406
E- mail: [email protected]
Abstract
In a demographic situation characterized by exceptionally low period fertility levels, can we say that the social background of individuals is crucial for the planning of their future childbearing? In what way does it interfere in the shape of the expected fertility trend?
Facing a very low fertility level in the last decades, the European Southern Countries belong to the group that presents the lowest-low fertility, according to the terminology adopted by Kohler, Billari and Ortega (2002). Although Portugal maintains a relatively higher level of period fertility, the decline observed in the last few years suggests that soon it will reach the same standard. We believe that both the future level of period fertility and its evolutionary trend will be related to the manner the future parents (mothers and fathers) will face their fertility decision. That decision making in the forthcoming times could be associated with some specific behaviour patterns, socially
1
1. Introduction
In the last decades the sustained decline of fertility in the Southern European Countries turned them into the group of countries that reveals, at the present time, the lowest-low levels of period fertility. Several authors described and explained that particular trend (Bongaarts, 1999; De Santis and Livi Bacci, 2001; Kohler, Billari and Ortega, 2002; Kohler and Ortega, 2002; Goldstein, Lutz, and Testa, 2003; Sobotka, 2003; Frejka and Sardon, 2006, among others), but the persistence and the deepening of that decline became a concern for governments and a central issue for demographers. Particularly, it became critical to predict the most likely future paths by anticipating the fertility behaviour of the youngest. Our contribution in this study was based on the analysis of the characteristics of those people who declared to plan to become parents in the next future aiming a better understanding of what will influence mostly the childbearing decision, focusing on Spain and Portugal.
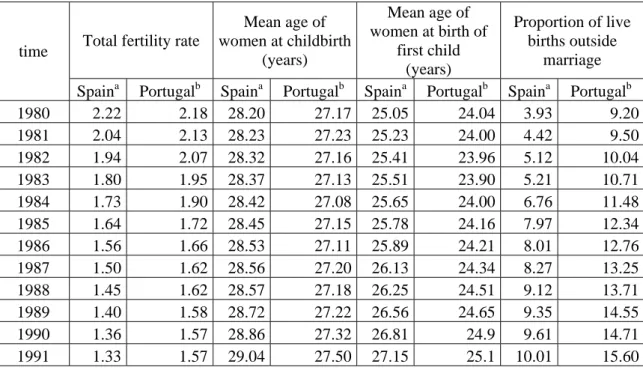
In the beginning of the 80’s, both Spain and Portugal showed levels of period fertility which guaranteed the replacement of the generations (see total fertility rates in Table 1).
Table 1 – Demographic indicators for Spain and Portugal (1980-2005)
Total fertility rate
Mean age of women at childbirth
(years)
Mean age of women at birth of
first child (years)
Proportion of live births outside
marriage time
1992 1.32 1.54 29.25 27.60 27.49 25.2 10.52 16.10 1993 1.27 1.51 29.46 27.70 27.8 25.4 10.75 16.96 1994 1.20 1.44 29.72 27.80 28.11 25.4 10.76 17.84 1995 1.17 1.41 29.96 28.00 28.39 25.6 11.09 18.67 1996 1.16 1.44 30.19 28.10 28.45 25.8 11.68 18.66 1997 1.18 1.47 30.37 28.30 28.68 25.9 13.12 19.56 1998 1.16 1.48 30.54 28.40 28.87 26.1 14.51 20.15 1999 1.19 1.50 30.66 28.50 28.97 26.4 16.3 20.85 2000 1.23 1.55 30.72 28.60 29.08 26.5 17.74 22.20 2001 1.24 1.45 30.75 28.70 29.1 26.8 19.73 23.78 2002 1.26 1.47 30.79 28.90 29.18 27.0 21.78 25.46 2003 1.31 1.45 c 30.84 29.02 c 29.24 27.05 c 23.41 26.90 c 2004 1.33 1.40 c 30.86 29.15 c 29.29 27.14 c 25.08 29.06 c 2005 1.35 1.41 c 30.90 29.26 c 29.33 27.30 c 26.57 30.74 c 2006 1.38 1.36 c 30.89 29.44 c 29.31 28.1 28.38 31.61 c
Source: a) Instituto Nacional de Estadística (Spain), for Spanish data, http://www.ine.es/; b) Instituto Nacional de Estatística (Portugal), http://www.ine.pt/, and Eurostat, http://epp.eurostat.ec.europa.eu/, for Portuguese data; c) computed by the authors
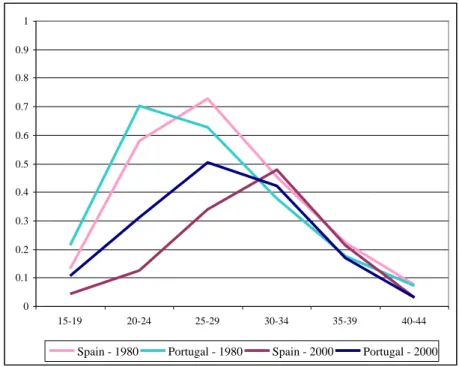
Figure 1 – Fertility rates by group of ages (years) in Spain and Portugal (in 1980 and 2000)
0 0.1 0.2 0.3 0.4 0.5 0.6 0.7 0.8 0.9 1
15-19 20-24 25-29 30-34 35-39 40-44
Spain - 1980 Portugal - 1980 Spain - 2000 Portugal - 2000
Source: Eurostat data; computed by the authors.
It is evident the diminishing values of fertility rates (for all age groups, with exception for the oldest women) and the clear shift to the right of both curves concerning all groups till the one aged 35-39 years. After these specific ages the curve shift in the opposite direction. The major decline was observed in the youngest ages (15 to 19 years and, specially, 20-24 years). For the group of ages from 25 to 29 years, the fertility rate diminished too but less than the verified in the first two age’s brackets. The increase registered in the groups aged 35-39 and 40-44 years has been insufficient to compensate the fertility loss in the youngest ages.
During the latest years of the studied period, the fertility rates were slightly higher for all groups of ages, in both countries. Nevertheless, the more considerable increase was observed for those aged from 30 to 34 years, followed by those old 35 to 39 years (Figure 2).
Figure 2 – Fertility rates by group of ages, for Spain and Portugal, between 1980 and
2000
Source: Eurostat data; computed by the authors.
Finally, it is worth to note the profound change in the fertility behaviour in what concerns the number of births inside and outside marriages. In both countries, the proportions of live births outside marriage raised considerably: from 3.93% and 9.20% in 1980 to 26.57% and 30.74% in 2000, for Spain and Portugal, respectively.
behaviour could get closer the levels of period fertility in both countries. We raise the hypothesis that the analysis of the intentions and plans of becoming parents made by the persons aged from 15 to 49 years could predict the near future fertility. We also suggest that understanding the demographic and social characteristics of that particular group, formed by those who plan to have children at short time, will contribute for a first forecast of the path of the fertility curves. Therefore, this paper intent to give an answer to the following question: What are the main characteristics that differentiate the persons who plan to have a child in the next three years in Spain and Portugal?
1. Data and Methods
We have utilised data from the European Social Survey (Round 2 – 2004/2005)2 . The survey was carried out between the final of 2004 and the beginning of 2005. The sample included 1729 Spaniards and 1511 Portuguese. The planning of childbearing concerning the next three years, following the inquiries date, was questioned in the round 2 of the survey. First of all, we have utilised a multivariate model for analysis of qualitative data (HOMALIS) to analyse the association between the multiple variables (Carvalho, 2004). After this exploratory treatment of the data, the evaluation of the differences in the probability of planning proximate fertility in a positive way was performed by using a logit model.
The fertility situation, similarly to others demographic processes, is embedded in a specific economic and social environment and simultaneously affects it and is influenced by it.
2
The explanation of the fertility decision is usually linked to the behaviour of a set of variables which includes a person’s educational level, his/her participation in the labour market and his/her marital status (Engelhardt and Prskawetz, 2004; Billari, 2004, among others). The childbearing decision may also vary with the sex and the age of a person. Besides, it is also assumed that the fertility decision may be related with social and psychological variables (Mendes, 1992). The framework of the Second Demographic Transition where values such hedonism, individualism are taken into account against altruism and the importance of “familism”, helped us to better identify the variables of interest in a changing process of fertility decision (Dalla Zuanna, 2001; van de Kaa, 1998, 1999; Surkyn and Lesthaeghe, 2004).
2. Results
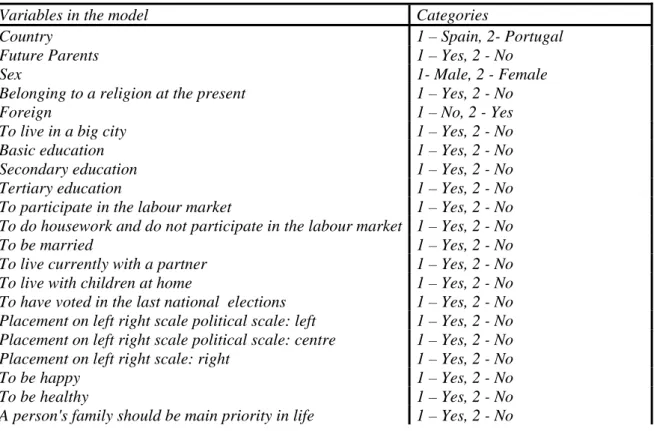
The variables utilised in the model are listed in Table 2.
Table 2 – List of variables in the model
Variables in the model Categories
Country 1 – Spain, 2- Portugal
Future Parents 1 – Yes, 2 - No
Sex 1- Male, 2 - Female
Belonging to a religion at the present 1 – Yes, 2 - No
Foreign 1 – No, 2 - Yes
To live in a big city 1 – Yes, 2 - No
Basic education 1 – Yes, 2 - No
Secondary education 1 – Yes, 2 - No
Tertiary education 1 – Yes, 2 - No
To participate in the labour market 1 – Yes, 2 - No To do housework and do not participate in the labour market 1 – Yes, 2 - No
To be married 1 – Yes, 2 - No
To live currently with a partner 1 – Yes, 2 - No To live with children at home 1 – Yes, 2 - No To have voted in the last national elections 1 – Yes, 2 - No Placement on left right scale political scale: left 1 – Yes, 2 - No Placement on left right scale political scale: centre 1 – Yes, 2 - No Placement on left right scale: right 1 – Yes, 2 - No
To be happy 1 – Yes, 2 - No
To be healthy 1 – Yes, 2 - No
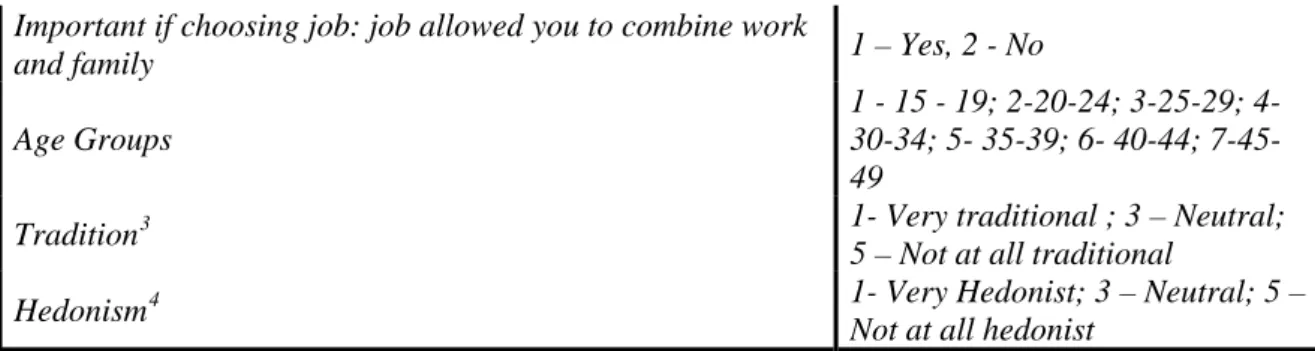
Important if choosing job: job allowed you to combine work
and family 1 – Yes, 2 - No
Age Groups
1 - 15 - 19; 2-20-24; 3-25-29; 4- 30-34; 5- 35-39; 6- 40-44; 7-45-49
Tradition3 1- Very traditional ; 3 – Neutral;
5 – Not at all traditional
Hedonism4 1- Very Hedonist; 3 – Neutral; 5 –
Not at all hedonist
The measures of the model fit are presented in Table 3.
Table 3 – Measures of model fit
Observations 2039 Fit 0.199570
Dimension 1 Dimension 2 Eingenvalue (by dimension) 0.108 0.092
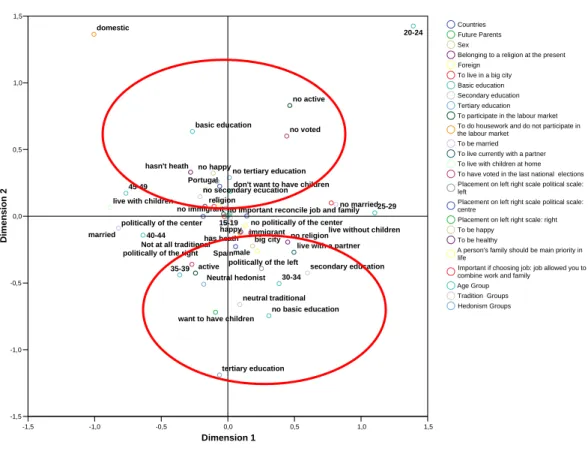
In the dimension 1 the results of the homogeneity analyse evidences “the level of education” (secondary), “to be married”, “to live with children in the household” and “to have voted in the last national election”; the dimension 2 is characterized by the variables “future parents”, level of education (basic and tertiary), “labour market participation” and “participation in the last national elections” (Figure 3).
3
Figure 3 – HOMALS
-1,5 -1,0 -0,5 0,0 0,5 1,0 1,5
Dimension 1 -1,5 -1,0 -0,5 0,0 0,5 1,0 1,5 Dime nsion 2 Spain Portugal
want to have children
don't want to have children
male religion no religion no immigrant immigrant big city basic education
no basic education secondary education no secondary ecucation
tertiary education no tertiary education
active
no active domestic
married
no married
live with a partner live with children
live without children no voted
politically of the left politically of the center no politically of the center
politically of the right happy no happy
has heath hasn't heath
no important reconcile job and family 15-19 20-24 25-29 30-34 35-39 40-44 45-49 neutral traditional Not at all traditional
Neutral hedonist
Countries Future Parents Sex
Belonging to a religion at the present Foreign
To live in a big city Basic education Secondary education Tertiary education To participate in the labour market To do housework and do not participate in the labour market
To be married To live currently with a partner To live with children at home To have voted in the last national elections Placement on left right scale political scale: left
Placement on left right scale political scale: centre
Placement on left right scale: right To be happy
To be healthy
A person's family should be main priority in life
Important if choosing job: job allowed you to combine work and family
Age Group Tradition Groups Hedonism Groups
Quantifications
The results of the model evidence a relationship between the “purpose of becoming a parent in the next three years” and the following characteristics: to be a Spaniard, to have secondary or tertiary education, to belong to the group aged from 25 to 29 years; to place himself in the left of the left right political scale; to participate in the labour market and to live with a partner. On the other hand, the “purpose of do not become a parent in the next three years” is more associated with the feature of being Portuguese, having a basic level of education, not being very happy, not participating in the labour market and not voting in the last national elections.
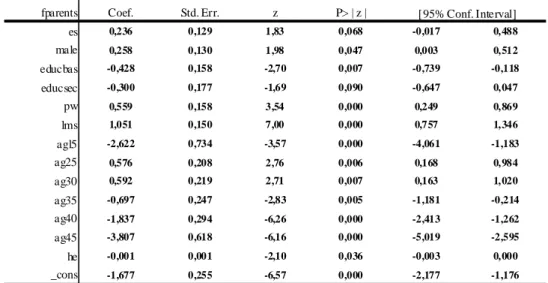
variables summary in Annexe B). We found that the majority of the model variables influence significantly the planning of childbearing (variable “fparents”), specially the age (agi), the marital status (lms), the level of participation in the labour market (pw) and the educational level (educbas, educsec and educter) (Table 3).
Table 3 – Logit model
Logistic regression Number of obs = 1925
LR chi2(13) = 421,06
Prob > chi2 = 0,0000
Log likelihood = -779.83 Pseudo R2 = 0,2126
fparents Coef. Std. Err. z P> | z |
es 0,236 0,129 1,83 0,068 -0,017 0,488
male 0,258 0,130 1,98 0,047 0,003 0,512
educbas -0,428 0,158 -2,70 0,007 -0,739 -0,118
educsec -0,300 0,177 -1,69 0,090 -0,647 0,047
pw 0,559 0,158 3,54 0,000 0,249 0,869
lms 1,051 0,150 7,00 0,000 0,757 1,346
agl5 -2,622 0,734 -3,57 0,000 -4,061 -1,183
ag25 0,576 0,208 2,76 0,006 0,168 0,984
ag30 0,592 0,219 2,71 0,007 0,163 1,020
ag35 -0,697 0,247 -2,83 0,005 -1,181 -0,214
ag40 -1,837 0,294 -6,26 0,000 -2,413 -1,262
ag45 -3,807 0,618 -6,16 0,000 -5,019 -2,595
he -0,001 0,001 -2,10 0,036 -0,003 0,000
_cons -1,677 0,255 -6,57 0,000 -2,177 -1,176
[95% Conf. Interval]
The dependent variable varies significantly and negatively with the level of hedonism, i. e., persons considered more hedonist show lower probabilities of becoming parents in the next future5. Having a basic or a secondary educational level also lowers that probability. Similarly, being male, to be married and to participate in the labour market increases the probability of becoming parents, as well as belonging to the groups aged
5
25-29 and 30-34 years, whereas being a teenager or being older than 35 years decreases the chances of childbearing when compared with those aged between 20 and 24 years. We used the parameter estimates in Table 3 to retrieve the predicted probabilities (shown in Annexe C). The baseline probability of “becoming a parent in the next three years when all covariate values are zero (i. e., for Portuguese females, with a tertiary educational level, not married, not participating in the labour market and belonging to the group aged from 20 to 24 years) is 0.157. The higher estimates refers to married men in Spain, aged 30 to 34 years, working in the labour market and having tertiary education (0.35), followed closely by those who was 25 to 29 years old (0.731). For Portuguese men showing analogous characteristics, the estimated probability was lower, (0.686 and 0.683, respectively). The estimated values for married and working females of the same groups of ages and with tertiary education are lower, either in Spain (30 to 34 years: 0.681; 25 to 29 years: 0.678) or in Portugal (0.628 and 0.625, respectively). For the same group of ages, men in Spain with lower levels of education (secondary and basic) revealed higher probabilities of becoming parents than Portuguese females with tertiary education.
females, and from 0.483 to 0.379 for the Portuguese ones, both presenting identical ranking, i. e., from tertiary till basic.
3. Concluding Remarks
For both countries, the legal marital status is still a relevant variable regarding the planning of childbearing in a next future. Similarly, the level of participation in the labour market is also crucial to increase the probability of becoming a parent. Additionally, that probability increases for higher levels of education. Finally, men show always higher probabilities than women.
For the same level of education and for each category of labour market participation, the planning of childbearing reveals higher probabilities inside the groups aged 30 to 34 and 25 to 29 years. It seems reasonable to assume that those who have an older age and want to become parents plan the childbearing for the next years, but it should be stressed that those are the ages of the fertility “focus”, concerning both the achieved fertility (in the last calendar years) and the planned one (for the next years). It is expected that the “peak” of the fertility curve in Portugal will keep changing, shifting towards the 30 to 34 years group, remaining the highest fertility level in Spain in that group of ages. Spaniards always have shown higher probabilities of being parents than the Portuguese for all the fertile age groups. So, we can expect that the fertility rates in Spain will attain higher values than in Portugal in the next future.
REFERENCES
BILLARI, F. (2004): “Becoming an Adult in Europe: a Macro (/Micro)- Demographic Perspective”, Demographic Research, Special Collection 3, Article 2, April 2004, pp. 15-44, Max Planck Institute for Demographic Research, Rostock, www.demographic-research.org;
BONGAARTS, J. (1999): “Fertility Decline in the Developed World: where will it end?”, The American Economic Review, May, 89, 2, pp. 256-260.
CARVALHO, H. (2004): Análise Multivariada de dados Qualitativos, utilização da HOMALS com o SPSS, Lisboa, Edições Sílabo.
DALLA ZUANNA, G. (2001): “The banquet of Aeolus: A familistic interpretation of Italy’s lowest low fertility”, Demographic Research, Volume 4, Article 5, May 2001, pp. 133-161, Max Planck Institute for Demographic Research, Rostock, www.demographic-research.org;
DE SANTIS, G. and LIVI BACCI, M. (2001): “Reflections on the economics of the fertility decline in Europe”, EURESCO Conference: The second demographic transition in Europe, Bad Herrenalb.
ENGELHARDT, H. &. PRSKAWETZ, A. (2004): “On the Changing Correlation between Fertility and Female Employment over Space and Time”, European Journal of Population, 20, pp. 35-62.
FREJKA, T. and SARDON, J. P (2006): “First birth trends in developed countries: Persisting parenthood postponement”, Demographic Research, Volume 15, Article 6, September 2006, pp. 147-180, Max Planck Institute for Demographic Research, Rostock, www.demographic-research.org;
GOLDSTEIN, J., LUTZ, W. and TESTA, M. R. (2003): “The emergence of sub-replacement family size ideals in Europe”, Population Research and Policy Review, 22, pp. 479-496.
KOHLER, H. and ORTEGA, J. A. (2002): “Tempo-adjusted period parity progression measures: assessing the implications of delayed childbearing for cohort fertility in Sweden, the Netherlands and Spain”, Demographic Research, Volume 6, Article 7, Mar 2002, pp. 145-190, Max Planck Institute for Demographic Research, Rostock, www.demographic-research.org;
KOHLER, H., BILLARI, F. and ORTEGA, J. A. (2002): “The emergency of lowest-low fertility in Europe during the 1990s”, Population and Development Review, 28 (4), pp. 641-680.
MENDES, M. (1992): Análise sociodemográfica do declínio da fecundidade da população portuguesa na década de 90, Évora, Universidade de Évora.
POWERS, D. & XIE, Y. (2000): Statistical Methods for Categorical Analyses, San Diego, Academic Press.
SOBOTKA, T. (2003): “Tempo-Quantum and Period-Cohort Interplay in Fertility Changes in Europe. Evidence from the Czech Republic, Italy, the Netherlands and Sweden”, Demographic Research, Volume 8, Article 6, April 2003, pp. 151-214, Max Planck Institute for Demographic Research, Rostock, www.demographic-research.org;
VAN DE KAA, D. (1998): “Postmodern fertility preferences: From changing value orientation to new behaviour”, The Australian National University, Working Papers in Demography, 74.
VAN DE KAA, D. (1999): European Populations. Unity in Diversity, Dordrecht, Kluwer Academic Publishers.
Annexe B – Variables list and summary
Variable Obs Mean Std. Min Max
fparents 1942 0,209 0,407 0 1
male 1942 0,473 0,499 0 1
es 1942 0,498 0,500 0 1
pt 1942 0,502 0,500 0 1
religion 1942 0,731 0,443 0 1
nforeign 1942 0,908 0,289 0 1
urban 1942 0,365 0,482 0 1
educbas 1942 0,542 0,498 0 1
educsec 1942 0,258 0,438 0 1
educter 1942 0,200 0,400 0 1
pw 1942 0,663 0,473 0 1
hw 1942 0,086 0,280 0 1
lms 1942 0,504 0,500 0 1
childliv 1942 0,454 0,498 0 1
age 1942 32,607 9,290 15 49
ag15 1942 0,093 0,291 0 1
ag20 1942 0,141 0,348 0 1
ag25 1942 0,161 0,367 0 1
ag30 1942 0,170 0,376 0 1
ag35 1942 0,152 0,360 0 1
ag40 1942 0,160 0,367 0 1
ag45 1942 0,122 0,327 0 1
vot 1942 0,639 0,480 0 1
bhappy 1942 0,871 0,335 0 1
Annexe C – Estimated probabilities of “becoming parents in the next three years” by country, sex, age, level of education, participation in the labour market and legal marital status (some results)
Country gender age education working married Odds
Spain male 30-34 tertiary education working married 0.735
Spain male 25-29 tertiary education working married 0.731
Portugal male 30-34 tertiary education working married 0.686
Portugal male 25-29 tertiary education working married 0.683
Spain female 30-34 tertiary education working married 0.681
Spain female 25-29 tertiary education working married 0.678
Spain male 30-34 secondary education working married 0.672
Spain male 25-29 secondary education working married 0.669
Spain male 30-34 basic education working married 0.643
Spain male 25-29 basic education working married 0.640
Portugal female 30-34 tertiary education working married 0.628
Portugal female 25-29 tertiary education working married 0.625
Portugal male 30-34 secondary education working married 0.618
Portugal male 25-29 secondary education working married 0.615
Spain female 30-34 secondary education working married 0.613
Spain male 30-34 tertiary education
not
working married 0.613
Spain female 25-29 secondary education working married 0.609
Spain male 25-29 tertiary education
not
working married 0.609
Spain male 20-24 tertiary education working married 0.605
Portugal male 30-34 basic education working married 0.588
Portugal male 25-29 basic education working married 0.584
Spain female 30-34 basic education working married 0.582
Spain female 25-29 basic education working married 0.578
Portugal female 30-34 secondary education working married 0.556
Portugal male 30-34 tertiary education
not
working married 0.556
Portugal female 25-29 secondary education working married 0.552
Portugal male 25-29 tertiary education
not
working married 0.552
Spain female 30-34 tertiary education
not
working married 0.550
Portugal male 20-24 tertiary education working married 0.548
Spain female 25-29 tertiary education
not
working married 0.546
Spain female 20-24 tertiary education working married 0.542
Spain male 30-34 secondary education
not
working married 0.540
Spain male 25-29 secondary education
not
working married 0.536
Spain male 20-24 secondary education working married 0.532
Portugal female 30-34 basic education working married 0.524
Portugal female 25-29 basic education working married 0.520
Spain male 30-34 basic education
not
working married 0.508
Spain male 25-29 basic education
not
working married 0.504