AN ASSESMENT OF THE POLICIES CONCERNING THE EU
SUSTAINABLE DEVELOPMENT STRATEGY
Arnold Weiszenbacher*
Abstract: Sustainable development has been now for more than 15 years, at the center of the objectives of the EU, being already enshrined in the Amsterdam Treaty of 1997. The basic concern of this
noа uЛiquitous term is to assure the Мurrent generation’s demands аill Лe fulfilled without endangering the needs of upcoming generations, sustainability being a key factor that affects both the financial market and the overall economy. The European Union has addressed this issue by developing a long term strategy, taking into account both economical, social, environmental and global governance factors and identifying seven key interrelated issues regarding climate change and clean energy, transport, consumption and production, the management and conservation of natural resources, public health, social inclusion and global poverty. This paper aims to present an overview of the current situation of the key challenges and their intersectoral measures and to determine the progress made in this area as well as to identify the key issues that offer the greatest amount of improvement and to recommend possible solutions to the aforementioned challenges. The methodology will benefit from data obtained and sampled from the Eurostat monitoring report, thus providing an accurate and transparent impartial analysis.
Keywords: sustainable development strategy; social inclusion; public health; climate change and energy.
JEL Classification: A14; C40; E24; E31; E62; H31; H50; I12; I31.
INTRODUCTION
Sustainable development is now at the forefront of European policies with a growing demand for conserving the resources at disposal and improving the quality of life for the current generation, without endangering the needs of future ones. The EU has devised a strategy based on several key trends, among which the seven most important ones will be tackled in a successive manner and the underlying issues as well as some possible lines of recommendation will be highlighted. Headline indicators will provide an overview of the current situation regarding each topic and a brief summary of each trend will be offered in conclusion.
* Master in International Business Management at the Babes-Bolyai University of Cluj Napoca, Romania, e-mail:
1.SOCIAL INCLUSION
The goal of the European Union is to include every citizen in society, especially those that are disadvantaged. There is a strong link between poverty and social inclusion in the EU, poverty eradication being the greatest global challenge and a crucial requirement for sustainable development, as was pointed out in Chapter II of the Johannesburg Plan of Implementation. A large part of the EU population risks being at poverty level and social exclusion, but it is interesting to notice that not all are affected in the same way. Although some people may have low income compared to people residing in other countries, this does not imply that their standard of living is low. People affected by material deprivation, which is another form of poverty, cannot deal with unplanned expenses, nor purchase desirable items that would contribute to a decent living. Reducing the gap between the highest and lowest incomes is essential to sustainable development and to social cohesion. In eliminating this gap between incomes, the elimination of the inequality of earnings between men and women must also be taken into account.
Figure 1 – People at risk of poverty or social exclusion (1.000 persons)
Geo/time 2005 2006 2007 2008 2009 2010 2011 2012
EU 27 124.339 123.051 119.360 116.418 114.286 116.780 120.171 122.860
Source: Eurostat.
Figure 2 – Percentage of people at risk of poverty or social exclusion by country
Source: Eurostat.
2. PUBLIC HEALTH
Healthy people are valuable to the social development and economy of a country, as they tend to be more productive. The main public health challenges faced by countries differ depending on the stage of development that they are in. Traditional health issues are commonly associated with a country’s lack of development, while more modern ones are correlated with a rather quick development that do not dispose of health and environmental safety guards. Among modern health threats it is worth mentioning air and water pollution, chemical radiation, waste accumulation, chronic diseases, as well as social factors that might lead to health damage such as unemployment or social exclusion.
A strong connection exists between health and other problems concerning sustainable development. Environmental issues such as that caused by climate change and energy (greenhouse gas emissions, for example), sustainable production and consumption and the way in which natural resources are managed all impact the health of the individuals. Improvement in health can be achieved through means of socioeconomic development and reaching for social cohesion, as all these reduce the existent inequalities between people and favour the opportunities for living more decently.
Whereas in 2004 a woman was expected to live on average 81.5 years at birth, in 2012 this number grew by 1.6 to 83.1 years expected to live in good health at birth.
Figure 3 – Healthy life years and life expectancy at birth
Geo/time 2005 2006 2007 2008 2009 2010 2011 2012
EU 27 81.5 82.0 82.2 82.4 82.6 82.9 83.2 83.1
Source: Eurostat
It is worrying however, that the number of years in good health is showing a decline. One of the main goals of the EU in what concerns public health is to increase this number, of expected healthy years to live at birth by 2 years by 2020. The importance of the healthy expected years at birth indicator is justifiable when we think of the quality of life concept and its emphasis in the policies of the EU.
A positive picture concerns the suicide rates, which have dropped by about 14% from 2000 until 2010. However, most of the decrease occurred before the start of the economic crisis. After 2007, the rate started to increase again. Also, similar to life expectancy the gap between men and women is reducing.
Pollution is a major health risk as well. No considerable improvements occurred in the exposure to air pollution by particulate matter with only a reduction of 1 microgram per cubic meter in 11 years.
Figure 4 – Urban population exposure to air pollution by particulate matter (mg/m3)
Geo/time 2000 2001 2002 2003 2004 2005 2006 2007 2008 2009 2010 2011
EU 27 28 26 27 30 27 28 30 28 26 26 26 27
Source: Eurostat.
On the other side of the spectrum, some worrying increments were observed in what concerns the exposure to air pollution by ozone with 769 micrograms per cubic meter per day from 2000 to 2001, accompanied by noteworthy fluctuations due to heat waves in between.
Figure 5 – Urban population exposure to air pollution by ozone (mg/m3/day)
Geo/time 2000 2001 2002 2003 2004 2005 2006 2007 2008 2009 2010 2011 EU 27 2937 3512 3511 5528 3491 3677 4478 3611 3580 3648 3368 3706
Source: Eurostat.
Directive 2008/50/EC is also an important piece of legislation that strives to merge most of the existing directives into a single one for a better air quality for Europe. A 120 micrograms of ozone per cubic meter benchmark was imposed for the long-term as well.
3. SUSTAINABLE CONSUMPTION AND PRODUCTION
The basic needs of humanity such as food or shelter are covered through the means of production and consumption of goods, as well as of services. Sustainable consumption and production is achieved through taking care of the basic needs of society while minimizing the use of natural resources, which implies that waste is reduced, pollutants are eliminated and consumption and the demand of products is reduced if all these aspects are managed properly and if the quality of products and of services are improved. In addition, more agricultural practices that are eco-friendly should be put into usage, as these help preserving the landscape and improving the quality of the soil and water.
There is a link between all these aspects concerning sustainable consumption and production: air pollutants used in fields such as industry, agriculture or transportation are leading not only to health damage, but also to acidification or eutrophication. There is also a link between waste levels and waste treatment, recycling and composting playing a crucial role in reducing the need for raw materials and the extraction of resources.
An 18.74% increase in resource productivity, which is the ratio between gross domestic product (GDP) divided by domestic material consumption (DMC) occurred from 2000, the reference year, to 2011. Whereas GDP grew by 16.5% in the same period, this means an absolute decoupling or separation of the environmental pressures from economic growth. However, the biggest influence on the DMC is the construction sector and the decrease in consumption of non-metallic materials by this sector.
Figure 6 – Resource productivity
Geo/time 2000 2001 2002 2003 2004 2005 2006 2007 2008 2009 2010 2011 EU 27 100 101.8 104.1 106.4 103.9 104.1 105.9 106.9 107.8 116.2 121.4 118.7
Source: Eurostat.
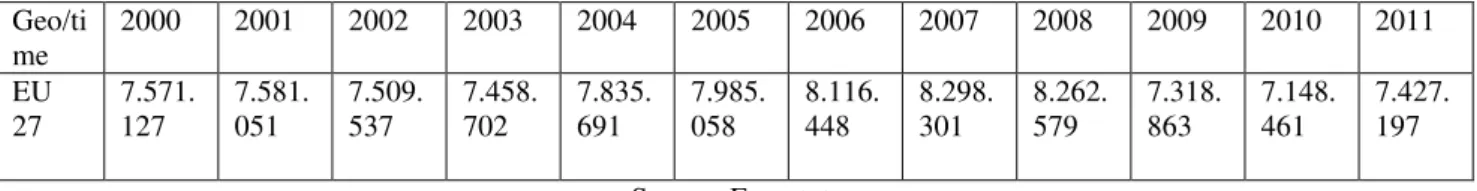
was noticeable, followed by another increase from 2010 to 2011 due to increased material extraction.
Figure 7 – Components of domestic material consumption (1.000 tonnes)
Geo/ti me
2000 2001 2002 2003 2004 2005 2006 2007 2008 2009 2010 2011
EU 27 7.571. 127 7.581. 051 7.509. 537 7.458. 702 7.835. 691 7.985. 058 8.116. 448 8.298. 301 8.262. 579 7.318. 863 7.148. 461 7.427. 197 Source: Eurostat.
A very positive outlook is encountered when it comes to waste generation and treatment. In 2012, out of 492 kg of waste generated per capita, 481 kg of that was disposed of by one form of deposit onto or into land, total incineration, material recycling or composting and digestion. The quantity of waste disposed onto or into land, which is the most environmentally threatening, reduced significantly from 278 kg in 2001 to 162 kg in 2012, a decrease of more than 40%.
Figure 8 – Municipal waste generation and treatment (kg per capita)
Geo/time 2001 2002 2003 2004 2005 2006 2007 2008 2009 2010 2011 2012
EU 27 278 269 255 239 221 220 213 199 192 186 171 162
Source: Eurostat.
That share was overcompensated by more green-oriented technologies of waste disposal, like incineration, recycling and composting, with material recycling showing the greatest increase, of around 33% from 2001 to 2012.
Figure 9 – Material recycling (kg/capita)
Geo/time 2001 2002 2003 2004 2005 2006 2007 2008 2009 2010 2011 2012
EU 27 88 95 97 99 105 109 119 120 122 125 129 132
Source: Eurostat.
reduction. They recorded an almost 50% reduction from 2000 to 2011, from 1.14 million tonnes to 6 million tones. As for the nitrogen oxides, they are released through fuel combustion and impact the soil and water quality as well as the air quality.
Figure 10 – Emissions of sulphur oxides SOx (tonnes)
Geo/ time
2000 2001 2002 2003 2004 2005 2006 2007 2008 2009 2010 2011
EU 27 11.34 9.194 10.94 3.100 10.41 1.218 10.22 5.496 9.780 .526 9.374 .929 9.208 .283 8.886 .359 7.242 .969 6.349 .026 5.974 .396 5.977 .237 Source: Eurostat.
Non-methane volatile organic compounds (NMVOC) are another class of very damaging pollutants to human health. They are released in the environment through combustion, the use of solvents or through different kind of production processes. Being one of the main contributors to ground-level ozone it is encouraging to witness a 34% reduction of levels between 2000 and 2011 in the EU-28 countries. Ammonia underwent the least reduction out of the four main pollutants, experiencing a less than 10% decrease in the EU-28 from 2000 to 2011. The main contributor to the reduction is the modernization of the agricultural sector where ammonia found one of its highest usages.
The EU has already adopted an action plan to combat these issues by trying to decouple economic growth from the environmental component. This would be achieved by setting high standards for products, more precise and convincing information to customers through use of a better labeling framework and providing incentives for improved products. According to researchers in the RESPONSES project (2013) more emphasis needs to be put on implementation and adaptation rather than assessment in terms of climate change, as does closer attention to qualitative insight because of uncertainty in the quantitative analysis methods.
4. SUSTAINABLE TRANSPORT
In what concerns energy consumption of transport relative to GDP, we can notice a 12.2% decrease between 2000 and 2012.
Figure 11 – Energy consumption of transport relative to GDP
Geo/time 2001 2002 2003 2004 2005 2006 2007 2008 2009 2010 2011 2012 EU 27 99.0 98.6 98.6 98.7 97.5 96.2 94.7 93.2 94.2 91.9 90.0 87.8
Source: Eurostat.
In order to analyze the most popular means of transport among people from the EU, we will divide passenger transport into the following three categories: passenger cars, trains, and the third one motor coaches, buses and trolley buses. As far as passenger cars are concerned, a slight increase of 1.32%, from 83% in 2000 to 84.1% in 2011, was observed, representing the percentage share of this mode of transport.
The average percentage share of trains as modes of transport has remained relatively constant in the years from 2000 to 2011, with a value of 7.1%. As for motor coaches, buses and trolley buses, we can observe a 11.1% decrease in their usage as forms of transport, from 9.9% in 2000 to 8.8% in 2011. Although the transportation of people occupies a large segment from the total of transport activities, freight transport is also a very important component in analyzing and developing the keys through which the EU could make transport sustainable. Freight transport on roads has become over the last few decades indispensable for the well-functioning of several economic industries, and we can notice an increase from 73.7% in 2000 to 75.5% in 2011 in the percentage share of this mode of transport, making this mean of transporting freight the most popular one, three quarters of the total freight transport. As for freight transport done on railways, we can notice a 6.59% decrease in the percentage share of this transport mode, from 19.7% in 2000 to 18.4% eleven years later. The least percentage share of freight transport belongs to the freight carried on inland waterways. In the time span from 2000 to 2011, it decreased slightly from 6.5% to 6.2%, respectively.
Such intense transport activities have serious repercussions for the environment, most noticeable through the rising greenhouse gas emissions, but also for society, in a more direct way, if we take into account the number of road accidents that occur.
5. CLIMATE CHANGE AND ENERGY
years. Studies have shown that greenhouse gas emissions caused by people is the main reason why the average temperatures have increased so much all over the world in the last two centuries. These emissions come, from the most part, from the burning of fossil fuels not only in power plants, but also in households or auto vehicles. Energy consumption has the largest contribution to the formation of these emissions in the EU, although other sources of the greenhouse gases include excessive farming, waste and deforestation.
The EU aims to limit climate change and to minimize its negative effects upon the environment and society. The major headline indicator through which climate change can be analyzed is the greenhouse gas emissions (1000 tonnes of CO2 equivalent) by sector. Total emissions have decreased with 18.3% from 5.092.754 tonnes in 2000 to 4.578.469 in 2011, though the declining trend is not continuous from year to year. The greenhouse gas emissions that have come from energy industries dropped 15.7%, those produced as a result of manufacturing industries and construction have decreased with 34%, the emissions resulted from industrial processes decreased with 27.4%, those that appeared as a consequence of agriculture fell down by 23.1%, while emissions resulted from waste decreased with 34.1%, all recorded in the 1990-2011 time interval and at the level of the EU countries. In contrast with the overall decrease of greenhouse gas emissions is the sector of transport, within which the emissions have increased in the same time interval and at the level of the EU with 19%.
Figure 12 – Energy consumption of transport relative to GDP
Geo/t ime
2000 2001 2002 2003 2004 2005 2006 2007 2008 2009 2010 2011
EU 27 5.066 .484 5.115 .451 5.070 .198 5.157 .890 5.161 .640 5.129 .156 5.116 .865 5.059 .034 4.952 .412 4.593 .422 4.705 .200 4.550 .212 Source: Eurostat.
In the context of greenhouse gas (GHG) emissions it is also worth mentioning the trend of these emissions’ intensity of energy consumption, which is the ratio between energy-related GHG emissions (carbon dioxide, methane and nitrous oxide) and the gross energy consumption produced on the territory of the EU. The intensity of energy consumption has decreased with 19.8% from 1990 to 2011.
with only a 0.87% difference between them, though the fluctuations of the primary energy consumption over the years in between was much more evident.
To keep under control the climate change, the EU aims to replace fossil fuels with renewable energy resources, which will benefit the EU by reducing the dependence on the imports of energy, as these imports are subjected to unpredictable market prices for fossil fuels. Creating an eco-friendly economy holds many opportunities, as the increasing need for green technologies is capable of innovating and putting on the market new jobs. Investing into electric vehicles or energy storage can prove to be very benefic for the EU as it will export more and more on the global market.
6. NATURAL RESOURCES
Natural resources is one of the themes most closely associated with sustainable development in the heads of EU citizens since it is one whose needs of fulfillment when related to the requests of current and future generations provide a simple, direct and visible picture in terms of what sustainable development means.
It is crucial for the EU to reform the agriculture industry, the fish and water policies and to make transport, consumption and production sustainable to control and ensure that our natural resources will be sufficient for generations to come.
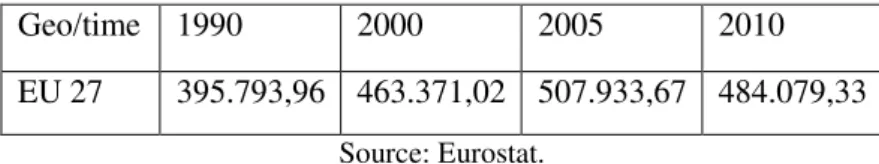
We can analyze the quality of water in the EU by observing the biochemical oxygen demand in rivers – the lower its value, the higher the water quality. From 1992 until 2008, the mean annual BOD5 in rivers has decreased from 6.27 (mg O2/L) to 1.88 (mg O2/L). Moreover, water abstraction from ground, as well as surface water has proved to be sustainable in the majority of the EU country members. As far as land use is concerned, forest fellings have increased with 22.2% from 400.239 (1000 m3 over bark) to 489.265.34 (1000 m3 over bark) in the 1990-2010 time interval. Another negative aspect related to land use is the fact that more and more artificial areas emerge to the detriment of natural areas. As of 2012, 4.6% of the land area in the EU was covered by artificial areas.
Figure 13 – Forest annual fellings (1000 m3 over bark)
Geo/time 1990 2000 2005 2010
EU 27 395.793,96 463.371,02 507.933,67 484.079,33
While the percentage of all common bird species slightly increased between 2000 and 2011 by 1.1%, the percentage of common farmland birds drastically plunged in the same period, reaching a low of 89.2% in 2011. According to a 2012 report of the European Commission, the main culprit was the simplification of landscapes created by intensive agriculture. Birdlife international (2012) suggests the lack of proper distribution of subsidies from the Common Agriculture Policy in order for maintaining High Nature Farmland is one of the key problems when addressing intensive agriculture.
Figure 14.1 – Common bird index (2000=100)
Geo/time 2000 2001 2002 2003 2004 2005 2006 2007 2008 2009 2010 2011 EU 27 100.0 102.8 102.5 103.1 106.5 101.8 101.1 103.3 103.4 99.4 100.7 101.1
Source: Eurostat.
Figure 14.2 – Common farmland species (2000=100)
Geo/time 2000 2001 2002 2003 2004 2005 2006 2007 2008 2009 2010 2011 EU 27 100.0 99.9 94.4 96.3 99.8 94.9 92.8 93.0 93.0 90.3 88.6 89.2
Source: Eurostat.
Pro Europe has identified two main strategic objectives that the EU needs to follow in order to improve the efficiency of natural resources usage. First would be making sure that the consumption of resources and the impact that this has, doesn’t exceed the carrying capacity of the environment and secondly, an important reduction in the amount of waste that are disposed as well as in the amount of hazardous waste needs to be achieved.
7. FIGHTING GLOBAL POVERTY
The EU has committed itself to helping least-developed countries by striving to donate 0.7% of its gross national income by 2015, however this has been offset now due to the financial crisis and it looks barely in reach.
Figure 15 – Official development assistance as share of gross national income
Geo/time 2004 2005 2006 2007 2008 2009 2010 2011 2012
EU(27 countries)
0.34 0.42 0.41 0.37 0.4 0.42 0.44 0.42 0.39
The official development assistance (ODA) which is measured as the percent of GNI that is donated annually has fallen down in the period 2010-2012 in line with the economic downturn of most of Europe. Least-developed countries rely heavily on ODA. During the years 2004-2006, in the lower middle income countries the share of ODA directed to them increased, while the share meant for least-developed countries decreased. However, since 2009, countries that were less developed received a greater percentage share of ODA than lower middle income countries and by 2011 both least-developed countries and other low income countries were granted 52.2% of the total share of the ODA to be allocated to the countries in need. It should also be noted that in recent years many countries advanced and became lower or upper middle income countries. In the 10 years span between 2000 and 2010, 26 countries that were least-developed or other low-income countries upgraded their status to that of lower or upper middle income countries, depending on the case. As a consequence of this fact, many people argue that a higher percentage of poor people nowadays live in lower or upper middle income countries, not in least-developed ones.
Also, imports from developing countries have increased while those from least-developing countries didn’t have the same amount of share. At the level of the EU, imports from China, Hong Kong included, have increased with a staggering 368%, from values of 64.2 billion euros in 1999 to 300.5 billion euros in 2012. EU imports from least developed countries increased with 236%, from 9.6 billion to 32.3 billion, as did imports from lower middle economies with 165% from 62.2 to 165.0 and those from upper middle income countries increased from 122.7 to 356.1.
Figure 16 – EU imports from developing countries by income group (billion EUR)
Geo/time 2001 2002 2003 2004 2005 2006 2007 2008 2009 2010 2011 2012 EU 27 93.5 101.1 116.9 139.4 172.0 209.4 244.9 260.3 227.6 296.9 304.8 300.5
Source: Eurostat (online code tsdgp210)
In terms of handling of the global resources, the gap in CO2 emissions per capita has reduced between the EU and developing countries but this is partly due to the increased level of emissions from the developing countries.
and raising awareness of citizens in order for them to understand and support the need for assistance.
CONCLUSIONS
In summary, sustainable development will be affected in part by the macroeconomic policies that will be undertaken in order to promote growth as well as by policies concerning industrial activities and redistributive measures, that combined should offer decent employment opportunities.
A better social protection framework needs to be put into place with the scope of getting rid of poverty and social exclusion, with nearly a quarter of the EU population being in this kind of danger in 2012. No major advances were observed in terms of public health either, with stagnating progress and a lot to be addressed when it comes to access to health care. The best improvements could be seen in the climate change and energy sector, with a significant reduction in greenhouse gas emissions in the last two decade. Positive signs are also emerging in terms of the sustainability of transport with a relative decoupling of energy consumption from economic growth and even absolute decoupling being registered in 2010 and 2011. The EU still needs to strongly tackle the direction in which its natural capital is being spent. Close attentions should also be given to the way the CAP is distributing its resources. When concerning the fight against global poverty, the EU still has a lot of work to do in order to dedicate 0.7% of its GNI to ODA. The amount distributed from the EU budget should be closely monitored and active citizen support is needed. However, with reasonable and well devised policies, the EU can reach its set of 2020 indicators.
REFERENCES
Berkhout, F. Frans Berkhout, Bouwer, L, Bayer, J., Bouzid, M., Cabeza, M., Hanger, S., Hof, A., Hunter, P., Meller, L., Patt, A., Pfluger, B., Rayner, T., Reichardt, K., van Teeffelen, A. (2013) European Responses to climate change: deep emissions reductions and mainstreaming of mitigation and adaptation, FP7 RESPONSES PROJECT, available at http://www.responsesproject.eu/pdf/RESPONSES%20Policy%20Brief%20Keyfindings.pdf Birdlife International (2012) On the road to recovery?, Birdlife assessment of progress on the EU
Concord (2013) EU Budget 2014-2020: Fit for the fight against global poverty?, Executive summary of Concord’s report, pp 2-3
Directive 2002/3/EC, accessed on April 2014 at
http://eur-lex.europa.eu/LexUriServ/LexUriServ.do?uri=OJ:L:2002:067:0014:0030:EN:PDF
European Commission (2013) 2013 Monitoring report of the sustainable development strategy, accessed on April 2014 at http://epp.eurostat.ec.europa.eu/cache/ITY_OFFPUB/KS-02-13-237/EN/KS-02-13-237-EN.PDF
European Commision (2013) Improving health for all EU citizens, accessed on April 2014 at http://ec.europa.eu/health/health_policies/docs/improving_health_for_all_eu_citizens_en.pdf European Commission (2013) Social investment through the European Social Fund – Commission
staff working document, accessed on April 2014 at
file:///E:/Downloads%20from%20net/SWD_Social-Investment-ESF_en.pdf
Pro Europe, European commission communication towards a thematic strategy on the sustainable use of natural resources, accessed on April 2014 at http://pro-e.org/files/PROEE30_pospaper-thematicstrategy-Resources.pdf
Shima, I., Rodrigues, R. (2009) The implementation of EU social inclusion and social protection strategies in European countries with reference to equality for disabled people, Report prepared for the Academic Network of European Disability Experts (ANED).
Van der Voet et al. (2005) Policy Review on Decoupling: Development of indicators to assess decoupling of economic development and environmental pressure in the EU-25 and AC-3
countries, accessed on April 2014 at