SPATIAL ANALYSIS FOR OUTLIER REMOVAL FROM LIDAR DATA
A. A. Matkan a, M. Hajeb a*, B. Mirbagheri a, S. Sadeghian b, M. Ahmadi a a Department of Remote Sensing & GIS, Shahid Beheshti University, Evin, Tehran, Iran.
(a-matkan, M_Hajeb,B_Mirbagheri, mos.ahmady)@sbu.ac.ir
b Geomatics College of National Cartographic Center, Meraj street, Azadi square, Tehran, Iran. [email protected]
KEY WORDS: Spatial analysis, Cross-validation, LiDAR, Outlier detection.
ABSTRACT:
Outlier detection in LiDAR point clouds is a necessary process before the subsequent modelling. So far, many studies have been done in order to remove the outliers from LiDAR data. Some of the existing algorithms require ancillary data such as topographic map, multiple laser returns or intensity data which may not be available, and some deal only with the single isolated outliers. This is an attempt to present an algorithm to remove both the single and cluster types of outliers, by exclusively use of the last return data. The outliers will be removed by spatial analyzing of LiDAR point clouds in a hierarchical scheme that is uses a cross-validation technique. The algorithm is tested on a dataset including many single and cluster outliers. Our algorithm can deal with both the irregular LiDAR point clouds and the regular grid data. Experimental results show that the presented algorithm almost completely detects both the single and cluster outliers, but some inlier points are wrongly removed as outlier. An accuracy assessment indicated . 8%Error α and,
. 5 % Error β that are very satisfactory.
1. INTRODUCTION
LiDAR is a relatively new technology which is an alternative to field surveying and photogrammetric techniques to collect elevation data. This technology is able to provide high accuracy three-dimensional data with reasonable cost and time. 3-D data acquired by this technology are applicable in 3-D urban modeling, DTM generation, mapping and etc. Although LiDAR data present high height accuracy, there are some defects in them leading to some disadvantages in output of next processes. Hence,these errors should be removed before performing any process.One of the most important errors in LiDAR data is the outlier points. Measured elevation for these points is unreasonably more or less from their neighboring points. The outliers are mainly measurements that do not obey the local surface geometry and do not belong to the topography of the interested area. In some references in the literature, the points with too high elevation values are named "positive outliers" and the points with too low elevation values are named "negative outliers", so we used these terms, too. The outliers can be caused from different sources. Positive outliers are resulted from hitting laser beams to birds or other suspended objects at high altitude. In connection with the negative outliers, it is believed that the laser beams be reflected several times among the glasses of buildings before they are detected, just like the multi-path effect of GPS. These specular reflections result in a longer travel time of the laser beam, and thus a lower elevation is calculated during post-flight processing. The negative outliers are often located at a few spots beside which there are tall buildings (Hu, 2003). If a dataset contains many outliers or unreliable points reflected from water features, the subsequent processes will not produce reliable results at neighboring regions (Hu, 2003). It is better to detect outlier points prior to the filtering procedure because they may have bad effects on the output of filtering algorithms (Baligh et al., 2011).
Positive outliers are easily detected and removed during the filtering process due to their high elevation. So, it is not necessary to remove them in a separate process. Despite this, the negative outlier detection and removal should be done before point cloud
filtering because there is an assumption in this field that treats the lowest point in a local neighborhood as a bare-earth point (Sithole, 2005). However, this assumption will not work properly for low outlier points. Using it results in losing bare-earth points near to those outlier points and consequently causes a conical hole in obtained DTM.
Many outlier points can be discarded promptly if a prior knowledge about the terrain relief of the region of interest is available. These information can be found in topographic maps. Mabudi (2005) used minimum and maximum elevation of the interested area to remove both positive and negative outliers. This strategy does not work well in high relief area. In addition, these information may not always be available. Hence, some strategies have been considered in which no prior knowledge is required. Maximum acceptable difference between first and last laser returns is one of them. Logically, for a LiDAR point, the first return value should be more than the last one. Therefore, the result of subtracting the last return from first return should not be greater than a threshold which is determined considering the height accuracy of the LiDAR system. Matkan et al. (2014) used this strategy to remove the outliers. They set the threshold to twice the height accuracy of the LiDAR data. A major weakness of this approach is that it is not able to remove the negative outliers from the last return data as well as the positive outliers from the first return. Surface fitting is another approach in which a surface is fitted on a certain number of nearest neighbors of a point. The considered point is treated as an outlier if its distance from the surface is greater than a predefined value (Jiang and Ming 2006). Presented method in (Leslar et al., 2011) fits a quadratic curved surface to sections of LiDAR data. Generally, the surface fitting method does not work well in high relief area (Jiang and Ming 2006). In (Pang, 2011) a minimum covariance determinant (MCD) based multiple attributes model is proposed which used both range and intensity LiDAR data to extend traditional data processing methods from single attribute to multiple attribute. The connectivity based outlier factor is then defined which indicates the spatial neighborhood relationship of a point to its neighbors as an attribute. This attribute and the height attribute are extracted to organize a 2-D space. In the The International Archives of the Photogrammetry, Remote Sensing and Spatial Information Sciences, Volume XL-2/W3, 2014
The 1st ISPRS International Conference on Geospatial Information Research, 15–17 November 2014, Tehran, Iran
This contribution has been peer-reviewed.
formed 2-D space, the proposed MCD-based multiple attributes model is conducted to identify the outliers. The results showed that the method can detect both the individual and cluster outliers. The major weakness of this method is its dependence on the intensity data. Nex and Rinaudo (2009) presented an algorithm to detect outliers from laser scanning data. In this algorithm the position of a point is predicted considering the neighboring dominant points of the edge and, then the difference between the predicted and real position of the point is evaluated. If the difference value is higher than a threshold, the point will be deleted. This filter works well if the outliers are isolated from each other.
Some of the presented algorithms require ancillary data such as topographic map, multiple laser returns or intensity data which may not be available, and some deal only with the single isolated outliers. It has proven to be surprisingly difficult to automatically remove negative outliers in form of cluster (Pang, 2011). Therefore, the designing new algorithms to overcome these shortcomings seems to be necessary.
In this paper we try to present an algorithm to remove both the single and cluster types of outliers by use of the last return data exclusively. Our algorithm detects and removes the negative outliers by spatial analyzing of LiDAR point clouds in a hierarchical scheme that uses a cross-validation technique. This algorithm can deal with both the irregular LiDAR point clouds and the regular grid data. In the latter case each cell is considered as a point in its center.
2. PROPOSED ALGORITHM
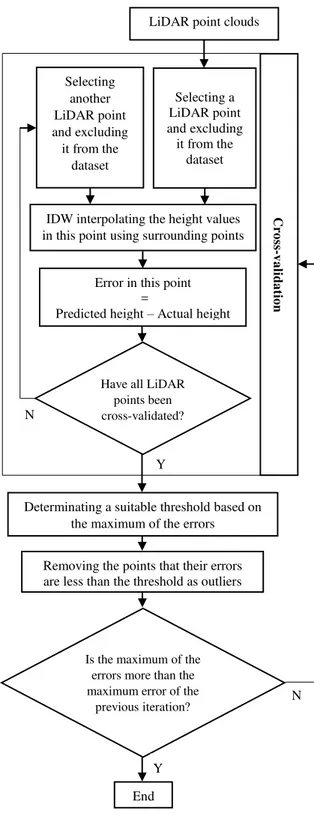
First, a point of LiDAR point clouds is selected and temporarily excluded from the data set. The height in this point is interpolated using the surrounding points. The error in this point is calculated by subtracting the actual height from the predicted height. This process is carried out for all of the LiDAR point clouds, so an error is assigned to each of the points. This is similar to the cross-validation technique in spatial analysis in GIS. The error value for negative outliers is positive and vice versa. Regarding to the aim of the study the negative outliers are only considered. Each point that its error is greater than a user defined threshold is considered as a negative outlier and permanently removed from the dataset. The threshold is determined according the maximum of the predicted errors. Then, the cross-validation process is again implemented on the remaining points and the new errors are calculated as previously explained. A new threshold is also defined based on the maximum of the predicted errors. The points with error greater than this threshold are removed. The process is repeated until the maximum of calculated errors in each of the iterations have a descending trend. In the other word, the process stops when the maximum of the errors is greater than the previous one. This way, the negative outliers are removed in a hierarchical iterative procedure. The flowchart of the proposed algorithm is given in figure 1.
3. OUTLIER REMOVAL EXPERIMENT
3.1 Study Area
The algorithm was tested on a dataset. The dataset was recorded with an average point distance of about 1 m. A high-resolution aerial image of the areas was also available. The dataset describes an urban area of Rheine region located in the west of Germany and has been prepared by the company Toposys and covers about 330 m × 430 m. There are residential areas with small buildings and industrial areas with large buildings. Many trees are
distributed in the area. The topography of this region is nearly flat. Visual interpretation of the DSM of the area shows that the dataset contains many single and cluster negative outliers. So, these datasets are suitable to test the algorithm. Figure 2 shows the study areas. The outliers are illustrated by the red circle in this figure.
Figure 1. The flowchart of the proposed algorithm
Selecting another LiDAR point and excluding
it from the dataset
N LiDAR point clouds
Selecting a LiDAR point and excluding
it from the dataset
IDW interpolating the height values in this point using surrounding points
Error in this point =
Predicted height – Actual height
Have all LiDAR points been cross-validated?
Cr
o
ss
-v
a
li
d
a
tio
n
Y N
Removing the points that their errors are less than the threshold as outliers Determinating a suitable threshold based on
the maximum of the errors
Is the maximum of the errors more than the maximum error of the
previous iteration?
Y
End
The International Archives of the Photogrammetry, Remote Sensing and Spatial Information Sciences, Volume XL-2/W3, 2014 The 1st ISPRS International Conference on Geospatial Information Research, 15–17 November 2014, Tehran, Iran
This contribution has been peer-reviewed.
(a) (b)
(c)
Figure 2. Study area: (a) Aerial image (b) Last return LiDAR data (c) 3-D view of DSM
3.2 Experimental Results
In order to perform the interpolation process, IDW procedure was used. This is due to existence of enormous LiDAR point clouds based on the fact that IDW is a suitable method when dealing with massive data. The maximum of the resultant errors in this iteration (the first iteration) was 22.718. Regarding this maximum error, the first threshold was set to 11 (approximately half of the maximum error yielded by trial and error). In this step the errors of 7 points were greater than the considered threshold. So, these 7 points were removed from the dataset as outlier. The remaining points were again IDW interpolated and the new errors were calculated. The maximum of the obtained errors in this iteration (the second iteration) was 18.052. Concerning this maximum error, the second threshold was set to 9. The algorithm was repeated 5 times before the stopping criterion to be met. The values of the maximum errors and thresholds, and number of the removed points are listed in table 1. The maximum of the errors in the sixth iteration is also given in the sixth row of the table 1. As seen in the table 1, the maximum error in sixth iteration (4.178) is more than the maximum error of the previous iteration (3.597) hence, the algorithm has not been continued anymore.
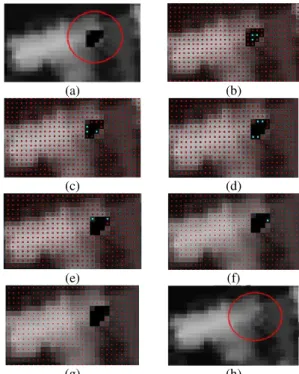
Figure 3 shows the gradual eliminating of a cluster outlier. In this figure all LiDAR point clouds and the detected points as outlier are respectively illustrated by red and cyan points. In each iteration the previous detected points have been removed. After fifth iteration all outliers was detected and eliminated from dataset.
The image of a single outlier and the resultant image after outlier removal are depicted in figure 4.
Parameters Iteration
Maximum error
Determined threshold
Number of removed points
1st iteration 22.718 11 7
2nd iteration 18.052 9 19
3rd iteration 7.779 3.5 42
4th iteration 4.762 2.5 157
5th iteration 3.597 2 380
6th iteration 4.178
Table 1. Obtained values for used parameters in each iteration of the algorithm
(a) (b)
(c) (d)
(e) (f)
(g) (h)
Figure 3. The result of the algorithm in cluster outlier: (a) Before (b) Detected points as outlier in 1st iteration (c) Detected points as outlier in 2nd iteration (d) Detected points as outlier in 3rd iteration (e) Detected points as outlier in 4th iteration (f) Detected points as outlier in 5th iteration (g) Removed points as outlier (h) Interpolating the remaining points (Final result)
(a) (b)
Figure 4. The result of the algorithm in single outlier: (a) Before (b) After
In this experiment the algorithm was tested on regularized grid data but it should be note that it can be applied on irregular LiDAR point clouds. In the case of regularized grid data, each cell is considered as a point in its center.
3.3 Accuracy Assessment
Accuracy assessment was done based on a comparison of the outputs of the algorithm with the reference data, obtained by manually detection of outliers through visual interpretation of the DSM. Number of 129 points were detected as reference outliers. The accuracy assessment measures are defined as follows:
Error α = + + + ×100 (1)
Error β = + + + ×100 (2)
where a, b, c and d are determined using table 2.
The International Archives of the Photogrammetry, Remote Sensing and Spatial Information Sciences, Volume XL-2/W3, 2014 The 1st ISPRS International Conference on Geospatial Information Research, 15–17 November 2014, Tehran, Iran
This contribution has been peer-reviewed.
Output of the algorithm Inlier Outlier
Reference data Inlier a b
Outlier c d
Table 2. Accuracy assessment parameters
The Error α (Type I) indicates the number of reference inliers that were detected as outliers by the algorithm. The Error β (Type II) indicates the number of reference outliers that were detected as inliers.
Table 3 shows the accuracy assessment measures obtained in each iteration of the algorithm.
Measures
Iteration
a b c d Errorα
(%)
Errorβ (%)
1st 7 0 122 142779 0 0.085 2nd 26 0 103 142760 0 0.072 3rd 44 24 85 142742 0.016 0.059 4th 71 154 58 142715 0.017 0.040 5th 10
2 503 27
142684 0.352 0.018
Table 3. The values of accuracy assessment measures
4. CONCLUSION
In this paper a new and effective algorithm is developed for outlier reduction from LiDAR point clouds. Most of the previously proposed algorithms are not able to tackle the cluster form outliers, so this issue has become an interesting challenge in LiDAR data processing. The proposed algorithm in this work focuses on overcoming the cluster outlier problem. A hierarchical iterative scheme based on cross-validation technique is proposed to solve this problem. There is no requirement for ancillary data such as topographic map, intensity data and multi retune laser data during the implementation. This algorithm can deal with both the irregular LiDAR point clouds and the regular grid data, although the regular grid data have only been tested in the experiment. The results of experiment show that our algorithm almost completely detects both the single and cluster outliers. A shortcoming of the algorithm is that it removes some points
which are not actual outlier. This leads to higher values of error
β. In the future work we intended to reduce the error β of the algorithm.
REFERENCES
Baligh, J.A., Valadan zoej, M.J., Mohammadzadeh, M., Sadeghian, S., 2011. A novel filtering algorithm for bare-earth extraction from airborne laser scanning data using an artificial neural network. IEEE Journal Of Selected Topics In Applied Earth Observations And Remote Sensing, Vol. 4, No. 4, Pp. 836- 843.
Hu, Y., 2003. Automated Extraction of Digital Terrain Models, Roads,and Building Using Airborne LiDAR Data, Ph.D. dissertation, University of Calgary, Canada.
Jiang, J., Ming, Y., 2006. Classification and filtering of LIDAR point clouds for DTM generation. ISPRS CommissionVII Mid-term Symposium, Enschede, the Netherlands, 8-11 May 2006.
Leslar, M., Wang, J. g., Hu, B., 2011. Comprehensive Utilization of Temporal and Spatial Domain Outlier Detection Methods for Mobile Terrestrial LiDAR Data, Remote Sens. 2011, 3, pp. 1724-1742.
Maboudi, M., 2005. Object Extraction from LiDAR Data, M.Sc. thesis, University of Tehran, Tehran, Iran.
Matkan, A.A., Hajeb, M., Sadeghian, S., 2014. Road Extraction from LiDAR Data Using Support Vector Machine Classification, Photogrammetric Engineering & Remote Sensing, Vol. 80, No. 5, pp. 409–422.
Nex, F., Rinaudo, F., 2009. New integration approach of Photogrammetric and LIDAR techniques for architectural surveys. In: Laserscanning 2009, Paris, 1-2 september 2009.
Pang, G., 2011. Outlier Detection and Data Filtering in LiDAR Data with Multiple Attributes, Ph.M. dissertation, Hong Kong polytechnic university, Hong Kong.
Sithole, G., 2005. Segmentation and Classification of Airborne Laser Scanner Data, Ph.D. dissertation, University of Delft, Delft, Netherlands.
The International Archives of the Photogrammetry, Remote Sensing and Spatial Information Sciences, Volume XL-2/W3, 2014 The 1st ISPRS International Conference on Geospatial Information Research, 15–17 November 2014, Tehran, Iran
This contribution has been peer-reviewed.