U.S.-Mexico Border
Field Office of the
Pan American Health Organization
Submitted By:
Alberto Barud
El Paso, TX abarud@sbcglobal.net
Final Report
Final Report
Final Report
Final Report
Executive Summary
Overview
This report explains in detail what activities took place during the duration of the contract between the Pan American Health Organization (PAHO) El Paso Field Office and Mr. Alberto Barud. It provides important information describing the data gathered from all the agencies involved. The type of information included in this report will allow PAHO, other researchers and individuals interested in this topic to have a better understanding of the situation along the United States-Mexico border in terms of the use of pesticides and the logistics involved in the different Irrigation Districts, Counties, Municipalities, States, etc. After reading this report, the reader will have a better understanding of the needs and challenges of a specific geographic area and will gain a broader perspective thanks to the comprehensive nature of the study.
Current Situation
In the United States, pesticides are used by almost 900,000 farms and in 70 million households. Agriculture uses 75 percent of all pesticides, but 85 percent of all U.S. households have at least one pesticide in storage, and 63 percent have from two to five different pesticides stored. (Aspelin et al. 1991). In 1986 about 60,000 tons of chemicals were sold in Mexico. In the border region, the Arizona Department of Health Services administers a pesticide poisoning surveillance and prevention program to identify factors associated with pesticide-related illnesses. Most of the existing and possible poisoning identified by the program in the state during 2000 was from structural pest control application and agricultural application (ADHS, 2001).
Rural communities along the border are confronted with a host of environmental problems, including pollution from agricultural activities and surface and ground water resources at risk for contamination. Some border residents suffer from many health problems, including waterborne diseases and respiratory disorders. These health problems can be related to air pollution, inadequate water and sewage treatment, and improper management of toxic, hazardous, and solid waste and pesticides.
Data Needed and Availability
Gap Analysis and Recommendations
What is most needed at this point is to be able to generate the records that back up each pesticide application for the Mexican side. Most of the agricultural areas lack a control system to document the application of pesticides. However, there are some exceptions: in the U.S., at least, data are available for all states, although for Texas and New Mexico they will be difficult to obtain, because each pesticide user—whether private, commercial or any other designation used by each state—must be located and contacted individually. The principal recommendation for the states of New Mexico and Texas is to improve the reporting system so that a state agency can handle a single database which will operate in the public domain. For Arizona, the data is available but it takes some time to acquire it once a formal request has been submitted.
PAGE 1
Chapter
1
Background
Introduction
This report explains in detail what activities took place during the performance period of the contract between the Pan American Health Organization (PAHO) El Paso Field Office and Mr. Alberto Barud. It provides important information describing data gathered from all the different agencies. The type of information included in this report will allow PAHO, other researchers and anyone interested in this topic to have a better understanding of the situation in the United States-Mexico border region in terms of the use of pesticides and the logistics involved in the various Irrigation Districts, Counties, Municipalities, States, etc. After reading this report, the reader will better understand the needs and challenges of specific geographic areas but will also acquire a broader perspective thanks to the comprehensive nature of the study.
As part of PAHO's efforts to implement environmental health indicators in the US-Mexico border region, this study set three goals: 1) locating and characterizing agricultural areas, 2) identifying the types and amounts of pesticides used, and 3) identifying the exposed population in the US-Mexico Border area.
A main component of this work was to obtain appropriate datasets in order to compile, process, and present them in a Geographic Information System (GIS) format. To accomplish this, several agencies on both sides of the border have been contacted with varying degrees of success; as explained in the following sections. Below there is a more detailed explanation of
accomplishments relating to each of the goals stated in the contract.
Justification
In the United States, pesticides are used by almost 900,000 farms and 70 million households. Agriculture uses 75 percent of all pesticides, but 85 percent of all U.S. households have at least one pesticide in storage, and 63 percent have between two and five pesticides stored. (Aspelin et al. 1991). In 1986, about 60,000 tons of chemicals were sold in Mexico. In addition, a very dramatic trend toward increased use of pesticides, herbicides and fungicides has been observed since 1970 (Ortega-Ceseña et al. 1994). This trend will certainly will continue or even increase with the switch from seasonal to regular irrigation agriculture practice in order to protect capital investment by farmers.
Rural communities along the border are confronted with a host of environmental problems, including pollution from agricultural activities and surface and ground water resources at risk for contamination. Border residents suffer disproportionately high rates of illness, particularly from waterborne diseases and respiratory disorders. These health problems can be related to environmental factors such as air pollution, inadequate water and sewage treatment, and improper management of toxic, hazardous and solid wastes and pesticides.
In order to help the local health services participate in a binational reporting system for acute pesticide poisoning and to help communities get information about the risks and safe handling of pesticides, including ways to minimize exposure for families and children, a database of the pesticide usage in the US-Mexico Border region is needed.
The need to generate an inventory of pesticides used is critical to establish a baseline of exposure to pesticides for residents living along the US-Mexico border.
Goals and Objectives
Initially, researchers Mara Oliveira and Alberto Barud proposed to undertake an epidemiological study of the potential effects and human health risks associated with pesticide use within the US-Mexico Border region. After subsequent consultation with the Pan American Health Organization, it was agreed that the study should be divided into two phases: the first phase would consist of gathering all available information and formatting it to facilitate further analysis, and the second phase would involve carrying out the epidemiological study. For the initial phase, three goals were established:
1) Location and characterization of agricultural areas in the U.S. – Mexico Border Region
All the agricultural areas for the states located on the US side of the Border have been located
in GIS as to their geographic extension through the thematic layer available through the Multi-Resolution Land Characteristic (MRLC) Consortium for which several state and federal agencies participate. Agricultural areas for the Mexican side are available through the National
Commission for the Knowledge and Use of Biodiversity (Comisión Nacional para el
Conocimiento y Uso de la Biodiversidad, CONABIO). Land use thematic layer, however with
only four classes differentiating between agricultural land, urban area, apparent lacking vegetation and water body.
Datasets of the hydrography were collected from the official websites of the USGS for the US
side and CONABIO for the Mexican side. Both layers are ready to use in GIS.
Datasets depicting bodies water were acquired from the USGS digital line graphics (DLG) files
for the US side. The data gathered from the Mexican side were provided by the Autonomous
University of Ciudad Juárez (Universidad Autónoma de Ciudad Juárez, UACJ) at the
Geographic Information Center (Centro de Información Geográfica CIG).
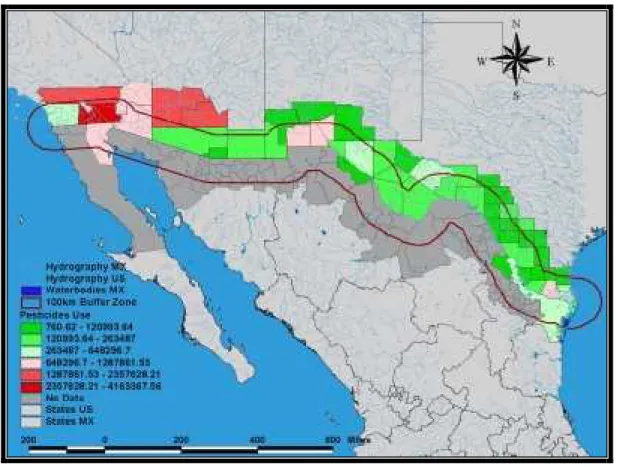
A generalized GIS map of irrigated/agricultural areas, hydrography and bodies of water for the
Border Region is shown in Figure 3.1.
2) Identification of the type and volume of pesticides used in specific agricultural areas.
Data regarding pesticide use for virtually all counties in the state of California reported for the
Data on pesticide use for Arizona was collected for the seven counties that lie within 100 km of the US-Mexico border. These counties are La Paz, Yuma, Maricopa, Pima, Pinal, Graham, Gila, and Cochise. Data for these counties was provided by the Arizona Department of Agriculture under contract between this agency and the National Agriculture Statistics Service (NASS) of the United States Department of Agriculture (USDA). This data was acquired for years 2000, 2001, 2002 and 2003.
The New Mexico Department of Agriculture does not maintain records of pesticide use for
New Mexico. Absent state data, county-level estimates as prepared by the USGS were acquired.
The Texas Administrative Code, Title 4, Part 1, Chapter 7, Subchapter D, Rule §7.33, states
that private and commercial or non-commercial applicators are required to keep records for a period of two years after each restricted-use pesticide, state-limited-use pesticide, or regulated herbicide. Unfortunately, Texas does not have a consolidating body that compiles this information in a single database. Consequently, the county-level estimates of the USGS were used.
3) Identification of population exposed to pesticides.
Demographic information from the 2000 Censuses of Population for both the U.S. and Mexico
PAGE 4
Chapter
2
Acquisition and Processing of
Data Acquisition
Assembling compatible datasets for the study area was a formidable challenge. In some jurisdictions, data were readily available. For example, data for California only required locating the appropriate agency, which then made the data available on a compact disk. For other U.S. states and for the Mexican portion of the study area, numerous inquiries were required and officials were visited, only to discover that no data were available.
The most desired data were those containing specific location of the application of certain pesticides on a specific date and for a specific crop. Of course, as mentioned previously this information is not available for all areas; however, this is the case for the states of California and Arizona. In addition, the existing data for California are already available for download when the user is querying a small part of the state, and are available on CD when the user needs a larger area. Data on use of pesticides for Arizona are available, but the requestor needs to put in a formal request and wait for the data to be generated. In any case, the data are ready for distribution, as in California.
The least amount of information was available on the Mexican side. Controls and records of the use of pesticides in some areas are wholly lacking. Pesticide applicators are not required to file a report of their applications throughout the year. In some cases the only data available is a list of registered applicators, but such applicators are not restricted to a specific region and they can operate in the whole state or even the entire country.
Data sources
United
States
México
#
Thematic layer
California
Arizona
Ne
w Mex
ico
T
exa
s
Ba
ja Cal
if
o
rni
a
Sonora
Chihua
hua
Coahui
la
Nuev
o Le
ó
n
Tama
ulipa
s
1 National
Boundaries
2 State
Boundaries
3 County/Municipio
boundaries
4
Census Tract/AGEB boundaries
5 Water
bodies
6 Hydrology
7 Irrigated
areas
- - - -
8 Land
use
- - - -
9 Land
Cover
- - -
10 Pesticides
use
2000
11 Pesticides
use
2001
12 Pesticides
use
2002
13 Pesticides
use
2003
14
Pesticides estimates 1997 USGS
15
Census demographics tract/AGEB
-
Data not found
Data not existent
Data acquired
1) National Boundaries
The thematic layer for the national boundaries was collected from the U.S. Census website. It was a compilation of the four US states and was incorporated into a single file with the four states. The original projection of these files is in meters, Universal Transverse Mercator (UTM), Zones, 11, 12, 13 and 14. North American Datum 1983 (NAD83). A Metadata file for this layer can be seen in Appendix C.a.
The layer for the Mexican boundaries was downloaded from the CONABIO website. The layer was gathered from the INEGI data at scale 1:250,000. The original projection for this file is in meters, UTM, NAD83. A Metadata file for this layer can be seen in Appendix C.a.
2) State Boundaries
The same layers used in number 1 above were used for the state boundaries. 3) County / Municipio Boundaries
The county layer was downloaded from the US Census website state by state. Once data from all states were collected, they were merged into a single working file. The original projection of these files is in meters, Universal Transverse Mercator (UTM), Zones, 11, 12, 13 and 14. North American Datum 1983 (NAD83). A Metadata file for this layer can be seen in Appendix C.b. The municipio layer was provided by the Center for Environmental Resource Management (CERM) of the University of Texas at El Paso (UTEP). This layer was already projected into decimal degrees. No metadata file is available for this file.
4) Census Tract/AGEB Boundaries
The census tract layer was downloaded from the U.S. Census website state-by-state. Once all states were collected, they were merged into a single file to generate the working file. The original projection of these files is in meters, Universal Transverse Mercator (UTM), Zones, 11, 12, 13 and 14. North American Datum 1983 (NAD83). A Metadata file for this layer can be seen at Appendix C.c.
The AGEB data was acquired from the Library at UTEP. The University acquired this layer from INEGI to have it as a resource for the public; however, the information is copyrighted and cannot be reproduced without written authorization from INEGI. These layers come in several formats and are mostly for the municipios within the urbanized areas. A metadata of these files is attached on Appendix C.c.
5) Water Bodies
The layer for the Mexican side was acquired from the CIG at UACJ. The original data come from the INEGI 1:250,000 scale maps in digital format. All sections have been joined into a single file and put together by UACJ-CIG staff. A metadata file is included in Appendix C.d.
6) Hydrology
The hydrology layer for the US comes together with the water body data for the United States. Information has been collected from the USGS as mentioned in number 5 above. This layer contains the streams and bodies of water in the United States that can be represented at a map scale of 1:2,000,000. The USGS has associated names to all stream segments and water bodies for which official geographic names were available. A metadata file can be found in Appendix C.d. The hydrology layer for Mexico was downloaded from the CONABIO web portal. These data were originally generated from a printed map edited by Maderey-R, L. E. and Torres-Ruata, C. in 1990.
This map title is Hydrography and Hydrometry (“Hidrografía e hidrometría" in Spanish). It is
included in section IV.6.1 (A) of the National Atlas of Mexico, Volume II at a scale of 1:4,000,000. It
is published by the Geography Institute at the National University of Mexico (Universidad Nacional
de México, UNAM). The metadata file for the electronic layer can be found in Appendix C.d.
7) Irrigated Land
Irrigated land information for the US was not collected as a polygon layer. Instead, a land cover layer was utilized to identify the irrigated areas. See number 9 below for more details.
The irrigated land layer for the Mexican side was acquired from the UACJ-CIG. This layer was
created from the National Forest Index (Índice Forestal Nacional, IFN). This layer was created by
the CIG with information available from INEGI and the IFN as indicated in the metadata file included in Appendix C.e.
8) Land Use
Land use data for the US were not collected. Instead, a Land Cover layer was utilized to identify the irrigated areas. See number 9 below for more details.
This layer was generated by CONABIO from an original paper version published in 1996 by the
INEGI and the National Institute of Ecology of Mexico (Instituto Nacional de Ecología, INE) and the
Land Use and Vegetation grouped by CONABIO in 1998 at scale of 1:1,000,000. This layer contains a classification of 27 types of land use and vegetation. Even though the classification is different from the one used by the US for their land cover layer explained below, these two are the most similar thematic layers to identify irrigated areas in both countries. A metadata file is included in Appendix C.f.
9) Land Cover
Figure 2.1. Multi-Resolution Land Cover Consortium Partners
The MRLC2001 (Multi-Resolution Land Characteristics 2001) consists of a collection of terrain-corrected Landsat 7 ETM+ (Enhanced Thematic Mapper Plus) and limited Landsat 5 TM (Thematic Mapper) scenes that have been acquired by the MRLC Consortium.
Because of USGS restrictions on the distribution of terrain-corrected data, the MRLC2001 data are available to MRLC Consortium members and Approved USGS Researchers only. The MRLC2001 data cover the conterminous US, Alaska, and Hawaii. The Landsat scenes are primarily 2000 imagery, although individual dates may range from 1999 to present. Multi-temporal scenes may also be available, depending on location. Most of the images are of very high quality, and cloud cover is generally less than 10%. See Appendix C.g. for the metadata file. The classification utilized for this layer is shown in Figure 2.2 below.
Mexico does not have a coverage similarly titled; however, the land use and vegetation layer generated by CONABIO and mentioned in number 8 above closely resembles the Land Cover layer for the US.
10)Pesticide Use Data
California
The California Department of Pesticides Regulation (CDPR) makes information available on their website regarding use of pesticides by area and chemical. The information can be downloaded from a regular web browser by carrying out different types of queries. When a query becomes too complex for the server to handle, a formal request must be made to the CDPR. If the user needs the entire suite of files for a specific year, the user can buy a CD-ROM with all the information available for 58 counties in the State of California.
California has been under full-use reporting since 1990, becoming the first state to require reporting of all agricultural pesticide use, including amounts applied and types of crops or locations (e.g., structures, roadsides) treated. Commercial applications–including structural fumigation, pest control, and turf applications–must also be reported. The main exceptions to full-use reporting are home and garden applications, as well as most industrial and institutional uses. This information was acquired for the last three years that the data were available, which are 2000, 2001 and 2002. To enhance accuracy of the data, DPR contracts with agricultural commissioners in the state’s 58 counties for the electronic submission of their pesticide use data. To further improve the accuracy and timeliness of pesticide use data, DPR initiated the California Electronic Data Transfer System (CEDTS) in 1994. This system allows growers and pest control operators to electronically transfer application data to the agricultural commissioners' office. By the close of 1998, 36 counties were capable of receiving data through the CEDTS program. Although response to CEDTS from pesticide users was favorable, adoption of the reporting system was slow. Many growers and pest control operators lack the time and expertise to write the software that pulls together the necessary pieces of information into a single pesticide use application database that meets DPR’s standardized data requirements. In response, private software providers and others began introducing systems that allowed use reporting via internet websites in 1999. In addition, new programs are being developed to enable nonagricultural users of pesticides to file electronic reports. Appendix C.h. shows a very complete record documenting pesticide use data for California for 2002. Identical reports are included for years 2001 and 2000 on the compact discs provided with this report.
Arizona
dataset can be seen in Appendix C.h. Even though this information is not readily available for download and is not as easy to access as in California, the information can be requested and provided at some point in time thanks to the reporting system that allows the Arizona Department of Agriculture to hold this database. Data included in this report are for the period 2000—2003, and each record is available on CD provided in conjunction with this report.
A pesticide dealer shall file quarterly reports within 30 days after the end of a calendar quarter (March 31, June 30, September 30, and December 31), indicating the quantity and date of sales of agricultural use pesticides on the Groundwater Protection List that are soil-applied. A report is required only from a pesticide dealer who makes the final sale prior to use. A pesticide applicator shall report the use of any agricultural use pesticide on the Groundwater Protection List that is soil-applied. The report shall be filed no later than the first Monday following the date of the pesticide application. If the first Monday following the date of the pesticide application is a holiday, the report shall be postmarked no later than the first working day following the holiday.
Pesticide use and application reporting is governed by the Arizona Agricultural Administrative Rules, following the Arizona Administrative Code, shown in Appendix C.h. under Title 18. Environmental Quality, Chapter 6. Department Of Environmental Quality Pesticides And Water Pollution Control.
Other U.S. States
New Mexico does not require applicators to report any use of pesticides if not requested to do so. However, commercial, noncommercial and public applicators are required to keep records of their applications, and these should be available to the New Mexico Department of Agriculture (NMDA) within 24 hours of application. Owners of property with pesticides applied to their acreage and the NMDA should receive a copy of these records upon written request. Private applicators, which are farmers and ranchers in New Mexico, are exempt from these record-keeping requirements. The information must be recorded within 14 days of application, and must be kept for two years. However, the records are limited to USDA and NMDA representatives and health care professionals treating individuals who have been exposed to restricted use of pesticides. (SWEC, 2004)
Texas applicators must keep records for two years after application of pesticides or herbicides, but there is no centralized place where applicators report their activity throughout the year. If anyone wants information on these applications, that person needs to go and visit each and every one of the applicators to gather that information, which is considered public information.
The Texas Administrative Code states in Title 4, Part 1, Chapter 7, Subchapter D, Rule §7.33 that private and commercial or noncommercial applicators shall keep records for a period of two years after each restricted-use pesticide, state-limited-use pesticide, or regulated herbicide. See Appendix C.h for a copy of this rule. But there is no consolidating body that collects this information in a single place. Therefore, data for this state were extremely difficult to collect, and only pesticide use data from USGS estimates at the county level were collected.
MEXICAN STATES
pesticides. Almost 20 years ago the CICOPLAFEST, which means Interagency Commission for
the Control of Processes and Use of Pesticides and Toxic Substances (Comisión Intersecretarial
para el Control del Proceso y Uso de Plaguicidas y Sustancias Tóxicas) was created to coordinate
interdepartmental efforts, to include private sector strategies, and to facilitate compliance with health, sanitary and environmental laws in Mexico. Despite efforts on the part of CICOPLAFEST to control the use of pesticides, there is no record-keeping regulation that requires the applicators to maintain records or report the use of pesticides.
According to the Regulation of Use and Control of Herbicides (see Appendix C.i.) for Mexico, the most common requirement for applicators is to use chemicals that are registered with the agency, but in any case it is a requirement that a record of the application be generated. In spite of this fact, most of the agencies keep records only if they feel can be useful to them for administrative or financial purposes. Below there is an explanation of each one of the contacts made with the states and the data acquired.
At the beginning of the contract, PAHO was in charge of gathering data for the Mexican side. For this purpose, several agencies were contacted at the local, state, regional, and federal levels. Most of the agencies dealt with the area of health and environment, such as the Secretariat of Health,
Secretariat of Agriculture, Livestock, Rural Development, Fishing, and Food (Secretaría de
Agricultura, Ganadería, Desarrollo Rural, Pesca y Alimentación, SAGARPA). The National Water
Commission (Comisión Nacional del Agua, CNA), the International Water and Boundary
Commission (Comisión Internacional de Límites y Aguas, CILA), were among others that were
contacted less formally. Unfortunately, these efforts were not productive, and the main reason was that data were nonexistent.
Therefore a different approach was taken, and PAHO and Mr. Barud decided that Mr. Barud would look for the information following up with the contacts previously made by PAHO for this purpose. Below is a summary of the activities that took place to obtain pesticide use data for the Mexican side.
Baja California
MAXIMILIANO CERVANTES RAMIREZ Deleg. Estatal en Baja California
Jefe del Programa de Sanidad vegetal Av. Reforma y Calle L No.S/N - Piso-PB Col. Nueva C.P. 21100
MEXICALI, BAJA CALIFORNIA TEL. (686) 553-6140 EXT. 41
mcervantes@bc.sagarpa.gob.mx
Sonora
VICTOR M. BELTRAN FAVELA Deleg. Estatal en Sonora
Jefe del Programa de Sanidad Vegetal Blvd. y paseo rio de Sonora sur y comonfort, Edif. México 2o. Nivel, Centro de Gobierno Col. Villa de Seris C.P. 83280
HERMOSILLO, SONORA TEL. (662) 259-9822
son_psv@sagarpa.gob.mx
Chihuahua
RODRIGO GARCÍA ALDACO Calle Perú #293 Nte.
CD. JUÁREZ, CHIHUAHUA TEL. (656) 682-3024
Coahuila
RICARDO E. FRAUSTRO SILLER SAGARPA
Deleg. Estatal en Coahuila
Jefe del Programa de Sanidad Agropecuario Km. 7.5 Carr. Central No. - Piso-PB
Col. C.P. 25016
psv@coa.sagarpa.gob.mx
Nuevo León
JUAN UBALDO GONZALEZ GONZALEZ
Jefe de Programa de Información y Estadística
Deleg. Estatal en Nuevo León
Av. Constitución No.4101 Oriente- Piso- Col. Fierro C.P.64590
MONTERREY, NUEVO LEON TEL. (81) 8126-7519
TEL. (81) 8126-7500 EXT. 77034 FAX. (81) 8126-7503
jubaldo@nvl.sagarpa.gob.mx
OR
Ing. Joel Pablo García
jefe de distrito de riego de Anahuac (873) 737-0047
Tamaulipas
PROGRAMA DE SANIDAD VEGETAL Ing. Humberto Ramírez
(834) 318-2107 ext 79245
progsv@tml.sagarpa.gob.mx
Table 2.2. Principal contact persons for pesticide use information
Baja California
Among other persons, the Vegetation Sanitation Manager, Ing. Maximiliano Cervantes Ramírez was contacted at the Mexicali office of SAGARPA. He was apprised of the purpose of the Project and was able to provide an electronic version of the summary that was furnished by their office showing the use of pesticides for the 2003 irrigation season. See Appendix C.i. to view this report. According to information gained from Mr. Cervantes Ramírez in several conversations, these estimates are similar to what might have been applied in the previous two or even three years. This might indicate that even the numbers given are rough estimates of whatever is applied in that area.
Mr. Cervantes Ramírez mentioned that they usually keep some record of the use of pesticides for high volume crops such as cotton, wheat, and sometimes alfalfa, but not for vegetables such as lettuce and others that are grown in the area. His contact information is shown in Table 2.2. above.
Sonora
Chihuahua
The contact for the Juarez Valley in Chihuahua provided copies of a weekly report on the application of pesticides in the valley. These reports are for the year 2004 and concern most of what is grown in the Juarez Valley. See this report in Appendix C.i. Information from the Ojinaga area, where the Río Conchos meets with the Río Bravo-Rio Grande, was not available through this office.
Coahuila
In this state the person who was able to provide some information was Mr. Ricardo Fraustro who only said that he is not aware of any information about pesticides available other than a list of industries that are registered to sell pesticides, who are called pesticide vendors
(comercializadores in Spanish). He mentioned that even that list does not exist, and he will have to generate it if I need it. Mr. Fraustro also mentioned that most of the agriculture is in the southern portion of the state and that the main activity is livestock and ranching, not agriculture.
Nuevo León
The state of Nuevo León has just a few areas within the 100 km buffer zone in which agriculture is an important activity. The most important area is the Municipality of Anahuac, which is not necessarily on the border but is within the 100 km buffer zone. According to the state SAGARPA office in the area of Vegetation Sanitation, no one handles the type of monitoring that we are looking for. They only handle lists of authorized pesticide vendors, but nothing else. However, they mentioned that in some cases, the local offices that are in charge of keeping some basic statistics or information about type of crop, acreage, etc., might have some pesticide use information. The
personnel in charge of these units, called Development Districts (Distritos de Desarrollo) do not
have that information handy either; however, they can look for it and provide estimates.
Our contact for Nuevo León provided important information that if it was not very well kept during the year on a list in writing, he was able to gather the data and gave Mr. Barud some numbers that Mr. Barud typed from his conversation. This report is attached on Appendix C.i.
Tamaulipas
During conversations between Mr. Barud and the contact for Tamaulipas, Mr. Humberto Ramírez told Mr. Barud on several occasions that the data are available and will be furnished, but he has reported having problems with his computer and has been unable to provide the data in question. At the time of this report, no data have been collected from him. This is unfortunate because the counties of Reynosa and Matamoros have large agricultural areas along the Río Bravo/Rio Grande Lower Valley.
11)Pesticide Use Estimates – USGS 1997
pesticide use for the conterminous United States by combining (1) state-level information on pesticide use rates available from the National Center for Food and Agricultural Policy, and (2) county-level information on harvested crop acreage from the Census of Agriculture. The average annual pesticide use, the total amount of pesticides applied (in pounds), and the corresponding area treated (in acres) were compiled for the 208 pesticide compounds that are applied to crops in the conterminous United States. Appendix C.j. shows a hard copy of this database for counties in the states sharing a boundary with Mexico. An extensive methodological article was published by the USGS, an electronic version of which is included in the CD packet provided.
Pesticide use was ranked by compound and crop on the basis of the amount of each compound applied to 86 selected crops. Tabular summaries of pesticide use for NAWQA study units and for the Nation were prepared, along with maps that show the distribution of selected pesticides to agricultural land.
In addition, a copy of the raw dataset for pesticides estimates by county was provided by the USGS to be incorporated into this report. An electronic version of this file is included in the CD packet provided.
12)Census Demographics
PAGE 15
Chapter
3
GIS Developed
US-Mexico Border Map
The map below shows the complete US-Mexico Border and represents in various shades the total amount of pesticides applied in a specific County or Municipio. It shows a nice comparison between the Counties or Municipios in which the agricultural activity is greater. This map is very similar to the study performed by the USGS, in which pesticide use estimates were given. However, this map shows authentic numbers and not estimates, at least for the states of California and Arizona.
State Level Map
The map in Figure 3.2 is an example of what a good record keeping and reporting system is all about. The CDPR has done an excellent job by compiling data such as these. With this kind of data the possibilities are excellent for tracking any illnesses related to pesticides. The geographic areas are small enough that the exact crop in which a case might have occurred can be determined. In terms of the dating, the fact that there are very good records on an application-by-application basis means the data are very reliable and there is no room for erroneous assumptions. The information speaks for itself.
Statistically, the fact that having information as accurate as this allows for professional studies and very reliable decisions. In the health arena there should not be a significant possibility for error. Moreover, the farm workers and other exposed people should have the right to decide for themselves if they want to work in an area that uses greater or lesser amounts of chemicals. Perhaps at the state level, or even at the county level, the responsibility might lie over the entire county and not with a single producer or geographic area that might be the only one responsible.
Figure 3.2. Sample map showing amount of pesticide use in California.
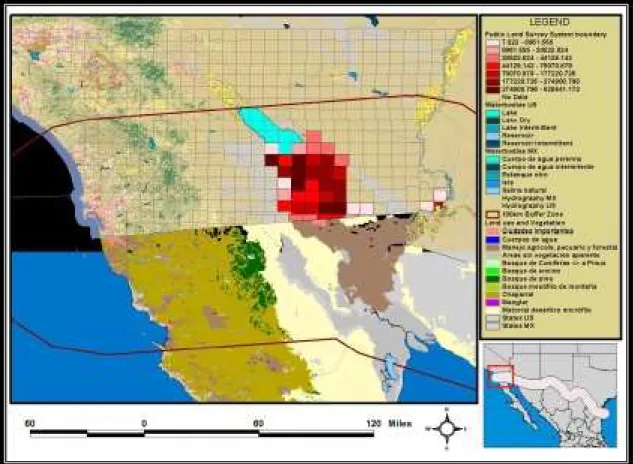
The excellent possibilities with using GIS and a good dataset in terms of integrity, reliability, accuracy, and content of the information, give the user a strong tool to make informed decisions. This is the case with databases such as the one from the Arizona Department of Agriculture used in conjunction with the Arizona Department of Water Resources. These two datasets are such that they allow a visual understanding of the pesticide use on a very large scale. This condition allows any researcher and decision maker to take appropriate steps toward research for planning, health risk assessment, etc., and to be confident that the decision will be the best possible.
On the other hand, the lack of information sometimes creates a more problematic situation, causing agencies to make wrong decisions. Figure 3.3 below shows a model of data available for Arizona and California.
PAGE 18
Chapter
4
Recommendations
Data
Availability of data for states in the US varies dramatically. California and Arizona are very much ahead of New Mexico and Texas. The existing process for collecting and reporting pesticide usage for California should be used as a benchmark for the rest of the states in the region.
Law s and Regulations
More specifically, the proposed changes are recommended in the policy arena so that pesticide use data are more readily available for all the states and counties within the US–Mexico border region. The recommendations below are listed in priority order according to the author’s point of view.
1) On the Mexican side there exists the need for generating pesticide application records and
data reporting at the three levels of government. As mentioned in this report, only a few agencies have informal reporting systems in place and it will be good to implement them across the country. However, these reporting systems are not required by law. Therefore, in most cases the data are not available.
2) Pesticide use data in New Mexico should be in the public domain, so that in case of any
health issue associated with human exposure to pesticides, investigations by third parties can be conducted. If confidentiality is an issue, special considerations may apply as well.
3) Pesticide use data in New Mexico should be reported in writing to an agency (perhaps the
New Mexico Department of Agriculture) every time there is an application. Currently the law is set so that a report of application is provided in writing only upon request.
4) Pesticide use data in New Mexico and Texas should be gathered by a single agency, or at
least by a single body, where it can be hosted for public use. Currently, the data is only available from the applicators and is not in the hands of a public agency.
5) It is recommended that the Arizona, New Mexico and Texas Departments of Agriculture
Appendix
A.
Cited References and Other Important Documents
Arizona Department of Health Services/ Bureau of Epidemiology and Disease Services/ Office of
Environmental Health, Arizona Lead & Pesticide Poisoning – annual report 2000 – July 2001.
Aspelin, A.L., A.H. Grube, & V. Kibler. 1991. Pesticide industry sales and usage: 1989 market estimates.
Washington, DC: EPA Economic Analysis Branch.
Fuhrer, Gregory J., Robert J. Guilliom, Et al. The Quality of Our Nation’s Waters: Nutrients and Pesticides; Circular 1225; U.S. Geological Survey, Reston, VA 1999, 90 pgs.
Gary W. Levings, Denis F. Haely, Steven F. Richey, and Lisa F. Carter. Water Quality in the Rio Grande Valley – Colorado, New Mexico, and Texas, 1992-95. U.S. Department of the Interior – U.S. Geological Survey, Circular 1162, 1998.
Ortega-Ceseña, J., Espinoza-Torrez, F., and Lopez-Carrillo, L., El Control de los Riesgos para la salud
generados por los plaguicidas organofosforados en México: Retos ante el Tratado de Libre Comercio, Salud
Pública de México, Nov-Dic 1994, Vol. 36, No. 6.
Southwest Environmental Center (SWEC), A Citizens’ Guide to Pesticides Use and Regulation in New
Mexico. Practical Information to protect yourself, your community and the environment from harm. January
2004.47 pp
Organización Panamericana de la Salud, Oficina de Campo, Frontera México-Estados Unidos, Encuesta
Sobre Salud Ambiental – Infraestructura y Recursos Humanos de los Estados de la Frontera Norte México, El
Paso, TX. Febrero 2001.
U.S. - Mexico Border Field Office of the Pan American Health Organization. Environmental Health Indicators For the U.S. - Mexico Border, Concept Document. El Paso, TX 2001.
U.S. - Mexico Foundation for the Science, Water and Health at the U.S.-Mexico Border - Science, Technology and Policy Issues, 1998
U.S. Department of Agriculture - New Mexico Agriculture Statistics Service. New Mexico Agricultural
Statistics 1999. Las Cruces, New Mexico.
U.S. Department of Agriculture - New Mexico Agriculture Statistics Service. New Mexico Agricultural
Statistics 2002. Las Cruces, New Mexico.
U.S. Environmental Protection Agency. Toxic Chemical Release Inventory – Reporting Forms and
Instructions. Revised 2001 Version. Section 313 of the Emergency Planning and Community Right-to-Know
C.
GIS Datasets
Description and Metadata for INEGI AGEBS 2000
Objetivo
Asegurar el uso y aprovechamiento de la cartografía elaborada para el levantamiento del XII Censo General de Población y Vivienda 2000, por parte de las instituciones que conforman la Red Nacional de Consulta, y promover su venta entre los nichos identificados como mercado meta.
Características del producto
Cartografía Censal Urbana actualizada al XII Censo General de Población y Vivienda 2000, versión en medio digital.
El producto Cartografía Censal Urbana contiene una representación digital de las localidades que al XII Censo General de Población y Vivienda, 2000, contaban con 2 500 o más habitantes, o bien eran cabeceras municipales.
Su contenido consiste en archivos digitales que representan a las 4 028 localidades urbanas del país con información alfanumérica y vectorial. Para fines operativos censales, se subdividió a las localidades urbanas en áreas geoestadísticas básicas urbanas (agebs urbanas).
El producto tiene un cubrimiento nacional constituido por un poco más de 40 000 AGEB y considera a las casi 1 millón 100 mil manzanas existentes, las cuales se distribuyen en 32 paquetes estatales a través de los siguientes contenidos:
Polígonos y claves de AGEB urbana.
Polígonos y claves de manzana.
Servicios: escuelas, mercados, servicios médicos, plazas o jardines, templos, palacios municipales y cementerios.
Vías de comunicación (férrea y carretera).
Cuerpos de agua.
Formatos utilizados
Archivos con información alfanumérica (dbf, doc, xls o arc). Dan cuenta de las claves y nombres de las entidades, municipios y localidades.
Archivos con información vectorial (shp, mif, dgn, dwg y coverage). Contienen una representación gráfica digital de las AGEB urbanas y de las manzanas, con su clave geoestadística asociada como atributo.
Archivos dxf. Incluyen elementos complementarios, tales como nombres de calle y servicios.
Para un mejor aprovechamiento de los datos, se debe considerar que las características del equipo de cómputo están supeditadas por los requerimientos del software elegido por el usuario. En este sentido, se hace la aclaración de que los formatos incluidos fueron probados en el siguiente software: AutoCad Map R3, ArcView GIS 3.1, Map Info 6.5, MicroStation 95 y Arc/Info 8.
Características del contenido
Con el propósito de facilitar al promotor la tarea de conocer el producto antes de realizar demostraciones del mismo ante los usuarios, se describen enseguida los pasos básicos para accesar a la información de la
Cartografía Censal Urbana:
Para lo relacionado con las claves y nombres de las 32 Entidades Federativas, el usuario debe remitirse al archivo Ent (dbf, doc, xls o asc), en tanto que para lo correspondiente a las 2 443 Áreas Geoestadísticas Municipales, deberá revisar el archivo Mun (dbf, doc, xls o asc). Así mismo, al acesar al archivo Loc (dbf, doc, xls o asc) encontrará la información concerniente a las 4 028 Localidades Urbanas. Estos catálogos se encuentran en la carpeta ALFANUMERICOS, al interior del disco.
Polígono y clave (EEMMMLLLLAAA-A) de las AGEB.
Polígono y clave (EEMMMLLLLAAA-Ammm) de las manzanas.
Nombres de calle.
Servicios: escuelas, mercados, hospitales, templos, plazas (o jardines), palacios municipales (o ayudantías) y cementerios.
Vías de comunicación: férrea y carretera.
Cuerpos de agua.
Amanzanamiento complementario.
Donde EE, MMM, LLLL, AAA-A y mmm son las claves de entidad, municipio, localidad, ageb y manzana, respectivamente.
Los archivos de polígonos con información vectorial se encuentran distribuidos y denominados dentro de la carpeta VECTORIALES, de acuerdo con la siguiente convención:
\<formato>\<ClvEntChr>\[AGEBS/MANZANAS]\<NomArc>+[a/m]
Donde:
Formato: DXF, DWG, SHAPE, MIF, DGN y COVERAGE
ClvEntChr:1, 2, .., 9, A, .., W (ver archivos Ent)
AGEBS/MANZANAS: AGEBS o MANZANAS
NomArc: EMMMLLLL (claves de entidad (ClvEntChr),municipio y localidad)
a/m: Letra "a" o letra "m", que identifican AGEB’s o manzanas, respectivamente.