www.nat-hazards-earth-syst-sci.net/15/1493/2015/ doi:10.5194/nhess-15-1493-2015
© Author(s) 2015. CC Attribution 3.0 License.
A contribution to the selection of tsunami human vulnerability
indicators: conclusions from tsunami impacts in Sri Lanka and
Thailand (2004), Samoa (2009), Chile (2010) and Japan (2011)
P. González-Riancho1, B. Aliaga2, S. Hettiarachchi3, M. González1, and R. Medina1
1Environmental Hydraulics Institute “IH Cantabria”, Universidad de Cantabria, C/Isabel Torres no 15, Parque Científico y Tecnológico de Cantabria, 39011 Santander, Spain
2Intergovernmental Oceanographic Commission of UNESCO, 7 Place de Fontenoy, 75732 Paris CEDEX 07, France 3Department of Civil Engineering, University of Moratuwa, 10 Simon Abeywickrama Avenue,
Mount Lavinia, 10370, Sri Lanka
Correspondence to:P. González-Riancho (grianchop@unican.es)
Received: 11 September 2014 – Published in Nat. Hazards Earth Syst. Sci. Discuss.: 16 December 2014 Revised: 01 June 2015 – Accepted: 03 June 2015 – Published: 03 July 2015
Abstract.After several tsunami events with disastrous
con-sequences around the world, coastal countries have realized the need to be prepared to minimize human mortality and damage to coastal infrastructures, livelihoods and resources. The international scientific community is striving to develop and validate methodologies for tsunami hazard and vulnera-bility and risk assessments. The vulneravulnera-bility of coastal com-munities is usually assessed through the definition of sets of indicators based on previous literature and/or post-tsunami reports, as well as on the available data for the study site. The aim of this work is to validate, in light of past tsunami events, the indicators currently proposed by the scientific community to measure human vulnerability, to improve their definition and selection as well as to analyse their validity for different country development profiles. The events analysed are the 2011 Great Tohoku tsunami, the 2010 Chilean tsunami, the 2009 Samoan tsunami and the 2004 Indian Ocean tsunami. The results obtained highlight the need for considering both permanent and temporal human exposure, the former requir-ing some hazard numerical modellrequir-ing, while the latter is re-lated to site-specific livelihoods, cultural traditions and gen-der roles. The most vulnerable age groups are the elgen-derly and children, the former having much higher mortality rates. Fe-male mortality is not always higher than Fe-male mortality and not always related to dependency issues. Higher numbers of disabled people do not always translate into higher numbers of victims. Besides, it is clear that mortality is not only re-lated to the characteristics of the population but also of the buildings. A high correlation has been found between the
af-fected buildings and the number of victims, being very high for completely damaged buildings. Distance to the sea, build-ing materials and expected water depths are important deter-mining factors regarding the type of damage to buildings.
1 Introduction
Natural disasters are triggered by extreme natural phenom-ena and become disasters because of the heightened vulnera-bility of the people and places where they occur (Mazurana et al., 2011). Vulnerability refers to the conditions determined by physical, social, economic and environmental factors or processes, which increase the susceptibility of the exposed elements to the impact of hazards (adapted from UN/ISDR, 2004).
Earthquakes (including tsunamis) have killed more peo-ple than all other types of disaster put together, claiming nearly 750 000 lives between 1994 and 2013. Tsunamis were the most deadly sub-type of earthquake, with an average of 79 deaths for every 1000 people affected, compared to four deaths per 1000 for ground movements. This makes tsunamis almost 20 times more deadly than ground move-ments (CRED, 2015).
etc.) and the vulnerability conditions that may exacerbate the tsunami impacts (UNDP, 2011; UNU-EHS, 2009; Villagrán de León, 2008; González-Riancho et al., 2014; Sugimoto et al., 2003; Sato et al., 2003; Koshimura et al., 2006; Jonkman et al., 2008; Strunz et al., 2011; Post et al., 2009; Dwyer et al., 2004; Tinti et al., 2011; Dall’Osso et al., 2009; Cruz et al., 2011; Grezio et al., 2012; Koeri, 2009; Eckert et al., 2012; etc.).
As vulnerability is multi-dimensional, scale dependent and dynamic (Vogel and O’Brien, 2004), according to the scope of their work, various authors focus either on a specific di-mension (i.e. human, ecological, socioeconomic, infrastruc-tural) or on an integrated approach when dealing with cou-pled human and natural systems. Most of the vulnerability assessments are carried out by means of the definition of a set of indices and indicators which are normalized, weighted, aggregated and classified through a variety of methods to geographically represent the information (OECD, 2008; Al-liance Development Works, 2012; Damm, 2010; Eckert et al., 2012; González-Riancho et al., 2014; etc.). The selected vulnerability indicators differ among authors and are based on previous literature, scientific knowledge and advances, lessons learned from tsunami disasters, the study scope and the availability of information. The ideas and concepts mea-sured by all those indicators are, however, very similar.
The aim of this work is to understand whether the scientific community is proposing the right indicators to measure hu-man vulnerability in light of past tsunami impacts. Accord-ingly, it focuses on the analysis of past tsunami events to un-derstand and integrate the vulnerability conditions that wors-ened the tsunami human impacts. The specific objectives of this paper are to (i) compile some of the indicators currently applied to assess human vulnerability to the tsunami haz-ard and, based on them, propose a general scheme to ho-mogenize tsunami human vulnerability concepts and indi-cators; (ii) validate the indicators as far as possible through available data from past tsunami events; and (iii) identify new indicators or approaches through the evidences detected in those past tsunami events.
2 Review of existing tsunami human vulnerability indicators
A comprehensive review of the existing works on tsunami vulnerability assessment based on indicators has been carried out to identify those currently used to assess human vulner-ability. Although the various authors propose and apply dif-ferent indicators according to the scope of their work and the available information, all of the applied exposure and vul-nerability indicators follow specific thematic areas and can be grouped within four main categories and 10 key issues. The four categories are: exposure, warning capacity, evac-uation and emergency capacity and recovery capacity. The 10 key issues are: (i) human exposure, (ii) reception of a
warning message, (iii) understanding of a warning message, (iv) mobility and evacuation speed, (v) safety of buildings, (vi) difficulties in evacuation related to built environment, (vii) society’s coping capacity, (viii) household economic re-sources, (ix) recovery external support and (x) expected im-pacts affecting recovery. Table 1 summarizes the compiled indicators, which are organized within the proposed vulner-ability categories/key issues/indicators scheme, detailing the sources that applied them in previous works.
3 Validation of existing indicators through past tsunami events
To validate the indicators presented in Table 1, the im-pacts generated in several countries (Japan, Chile, Samoa, Sri Lanka and Thailand) by different past tsunami events are evaluated. The events analysed are the 2011 Great To-hoku tsunami, the 2010 Chilean tsunami, the 2009 Samoan tsunami and the 2004 Indian Ocean tsunami; their main char-acteristics are presented in Table 2. The validation is based on the comparison of the tsunami impacts on the population with the available census data of each country previous of each event to understand if the tsunami mortality trends are related to the event itself or to pre-tsunami existing popula-tion patterns and vulnerability characteristics. To do that, the pre- and post-tsunami official censuses are analysed for the various countries (Japan: Japan Statistics Bureau, 2010, and National Police Agency of Japan, 2014; Chile: Instituto Na-cional de Estadísticas de Chile, 2002, and Fiscalía NaNa-cional de Chile, 2011; Samoa: Samoa Bureau of Statistics, 2008, and Government of Samoa, 2010; Sri Lanka: Department of Census and Statistics of Sri Lanka, 2001 and 2004; and Thai-land: Asian Disaster Preparedness Center, 2007). Table 3 summarizes the indicators presented in Table 1 that can be validated in this work based on the information provided by these sources.
Table 1.Review of existing indicators and new framework for tsunami human vulnerability.
Categ. Key issues Review of currently applied tsunami human vulnerability indicators Sources*
Expo- I. Human Number of people exposed [1, 3, 4, 8]
sure exposure Population density [1b, 9]
Housing density [9]
Warning II. Reception of Isolated communities [3]
capacity a warning Early warning system (EWS) [3]
message Access to specific means of communication [7]
III. Age [1, 3, 7]
Understanding Education level [1, 1b, 7]
of a warning Illiteracy [1, 3]
message Immigration [1, 1b]
Language skills [2, 7]
Ethnicity [5]
Social and institutional awareness [3, 7]
Evacuation IV. Mobility Age [1, 1b, 2, 3, 4, 7]
and and evacuation Gender [2, 5, 7]
emergency speed Disability [1b, 2, 3, 4, 7]
capacity Health [7]
Dependency [7]
V. Safety of Type of building [2, 6, 8]
buildings Building materials [3, 4, 5]
Building conditions [4]
Number of floors [3, 4, 6]
Isolate buildings [4]
Elevation [6]
Shoreline distance [6]
VI. Difficulties Distance to safe places: evacuation, isolated communities, access to main roads [3, 7] in evacuation Critical buildings: schools, hospitals, hotels, malls, etc. [1b, 3, 4]
related to Number of people in critical buildings [3]
buil Critical infrastructure: road network [3, 7]
environment Critical infrastructure: hazardous/dangerous infrastructures [3]
Vertical evacuation: number of floors [1, 1b, 3, 7]
VII. Society’s Emergency and health infrastructures [1b, 3]
coping capacity Health capacity: number of hospital beds, density of medics [1b]
Social and institutional awareness [3, 7]
EWS, hazard maps, evacuation routes/drills [3]
Local civil protection commissions, contingency plans, coordination networks, [3] emergency human resources
Recovery VIII. Household Income, savings, poverty [1b, 2, 3, 7, 9]
capacity economic Economic dependency ratio: male dependency [1, 1b]
resources Ownership, tenure: land, housing, car [2, 7]
Employment, type of occupation [1b, 2, 7]
Insurance: health, house [2, 7]
IX. Recovery Basic services availability: water/electricity supply, emergency/health infrastructures [1b, 3] external Access to social networks of mutual help: neighbourhood, family, formal and informal institutions [1b, 2, 7] support Temporary shelters, public funds, catastrophe insurance, medical/public health human resources, [3]
development human resources
X. Expected Human: injuries, degree of damage experienced [2, 7] impacts Socioeconomic: loss of jobs/livelihoods, loss of contribution to GDP/foreign trade, affected [1b, 3, 7] affecting local income source, job diversity
recovery Environmental: loss of sensitive ecosystems and ecosystem services [3] Infrastructures: residence/building damage, cascading impacts related to [2, 3, 5] dangerous/hazardous infrastructures
Cultural: cultural heritage [1b]
Table 2.Description of the past tsunami events used to validate the human vulnerability indicators.
2011 Great T¯ohoku tsunami
2010 Chilean tsunami
2009 Samoan tsunami
2004 Indian Ocean tsunami
Date1 11 Mar 2011 (Friday) 27 Feb 2010 (Saturday) 29 Sep 2009 (Tuesday) 26 Dec 2004 (Sunday)
EQ magnitude1 9.0 Mw 8.8 Mw 8.1 Mw 9.1 Mw
EQ epicentre1 38.30◦N, 142.37◦E (70 km E of Oshika Peninsula, T¯ohoku)
36.12◦S, 72.90◦W (12.5 km from Chilean coast)
15.49◦S, 172.09◦W (190 km S of Apia, Samoa)
3.30◦N, 95.98◦E (250 km SSE of Banda Aceh, Sumatra, Indonesia)
EQ hypocentre1 29 km 22.9 km 18 km 30 km
EQ time1 05:46:24 UTC 06:34:11 UTC 17:48:10 UTC 00:58:53 UTC Countries mainly
affected
Japan, Pacific Rim Chile Samoa, American Samoa, Tonga, French Polynesia, Cook Islands, Fiji, New Zealand
Indonesia, Sri Lanka, India, Thai-land, Maldives, Somalia, Malaysia, Myanmar, Tanzania, Seychelles, Bangladesh, Kenya
Country analysed Japan Chile Samoa Sri Lanka (SL), Thailand (TH)
Regions mainly affected in the country3
Tohoku Region (T): Iwate, Miyagi and Fukushima
Valparaíso, O’Higgins, Maule, Biobío
Poutasi, Saleapaga, Lalomanu, Satitoa, Malaela
SL: Jaffna, Mullaitivu, Trincoma-lee, Batticaloe, Ampara, Hambatota, Matara, Galle; TH: Ranong, Phang Nga, Phuket, Krabi, Trang
EQ LT 14:46:24 JST 03:34:11 CLT 06:48:10 WST 06:28:53 IST (SL) 08:28:53 ICT (TH)
TS arrival time 20 min after the EQ4 30 min after the EQ5 15–20 min after the
EQ7,8 2 h (SL) and 1h (TH) after the EQ
EWS (local warning issued)
Yes No Yes (not enough time)9 No
TS maximum wave height (tide gauges)
7.3 m (Soma,
Fukushima)2 2.61 m (Valparaíso)
1 2.5 m (Pago Pago)7 SL: 3.87 m (Colombo)11 TH: 4.70 m (Ta Phao Noi)13
TS maximum inundation depth (surveys)
10–15 m (Sanriku)4 2.30 m (Constitución)6 Above 5 m9,10 SL: above 10 m (Ampara)12 TH: 6 m (Ban Thale Nok)13
TS maximum run-up
(a.s.l.)2 55.88 m (Iwate)38.56 m (Miyagi), 29 m (Constitución)
2,5 14.45 m (Lepa, Upolu Island)
SL: 12.50 m (Yala)
TH: 19.60 m (Ban Thung Dap)
TS maximum distance travelled inland2
7900 m (Iwate) 4951 m (Miyagi),
1032 m (Playa Purema) 440 m (Salani, Upolu Island)
SL: 500 m (Koggala and Kalkudah) TH: 939 m (Hat Praphat)
Fatalities3 15 884 (T: 15 817) 156 140 SL: 13 391; TH: 5395
Missing3 2633 (T: 2629) 25 4 SL: 799; TH: N/A
Total casualties3 18 517 (T: 18 446) 181 144 SL: 14 190; TH: 5395
Data from USGS Earthquake Hazards Program (http://earthquake.usgs.gov)1; NOAA/WDS Tsunami run-up database (http://www.ngdc.noaa.gov)2; countries’ official reports on tsunami victims3; Mori et al. (2012)4; Fritz et al. (2011)5; Maruyama et al. (2010)6; Robertson et al. (2010)7; UNESCO ITST Samoa (2009)8; UWI-CDEMA (2010)9; Arikawa et al. (2010)10; Pattiaratchi and Wijeratne (2009)11; USGS Sri Lanka ITST (2005) (http://walrus.wr.usgs.gov/tsunami/srilanka05)12; Tsuji et al. (2006)13(EQ=earthquake, TS=tsunami, EWS=early warning system, LT= local time, JST=Japan system time; CLT=Chile standard time; WST=West Samoa time; IST=India system time; ICT=Indochina time; a.s.l.=above sea level; N/A=not available).
10 years. The 2001 census data do not cover the Tamil areas (north and east), which were highly affected by the tsunami, due to the security situation in the country at that time. For this reason, it is not always possible to compare pre-and post-tsunami data about the northern province districts, namely, Jaffna, Killinochchi, Mullativu, Trincomalee and Baticaloe. (5) Regarding Japan, the unknown gender and unknown age victims have been excluded from the total number of deaths in Iwate, Miyagi and Fukushima prefectures by the Japanese authorities responsible. Therefore, 15 331 of a total of 15 817 victims are analysed in this work (97 %).
Despite these limitations, the quality of the databases ap-plied in this work is good enough and helped generate well-founded, conclusive and useful information to validate the various indicators.
3.1 Human exposure
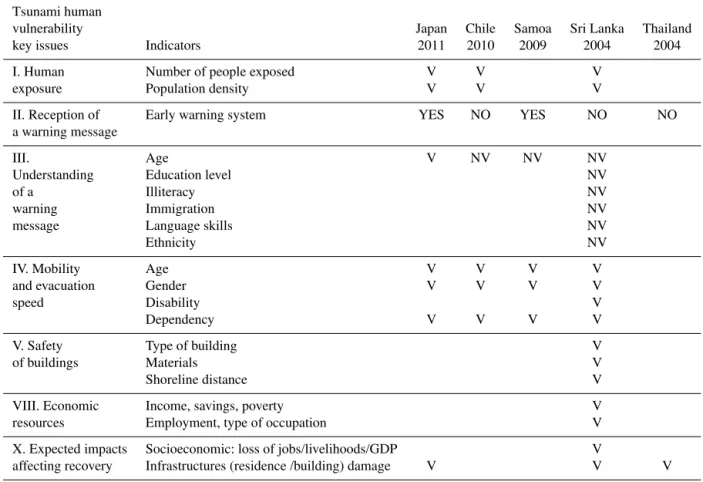
(UNU-Table 3.Indicators validated in this paper based on available information; V: indicators validated, NV: indicators not validated although the information is available, since the countries did not issue a tsunami warning before the first wave reached the coastline.
Tsunami human
vulnerability Japan Chile Samoa Sri Lanka Thailand key issues Indicators 2011 2010 2009 2004 2004 I. Human Number of people exposed V V V
exposure Population density V V V
II. Reception of Early warning system YES NO YES NO NO a warning message
III. Age V NV NV NV
Understanding Education level NV
of a Illiteracy NV
warning Immigration NV
message Language skills NV
Ethnicity NV
IV. Mobility Age V V V V
and evacuation Gender V V V V
speed Disability V
Dependency V V V V
V. Safety Type of building V
of buildings Materials V
Shoreline distance V
VIII. Economic Income, savings, poverty V resources Employment, type of occupation V X. Expected impacts Socioeconomic: loss of jobs/livelihoods/GDP V
affecting recovery Infrastructures (residence /building) damage V V V
EHS, 2009; González-Riancho et al., 2014). When no nu-merical modelling is available, the human exposure assess-ment is usually based on the identification of a site-specific topographic contour line, the area below being assumed to be flooded (Sahal et al., 2013; Eckert et al., 2012; Suharyanto et al., 2012). For both approaches it is common to relate the hu-man exposure to the number of people and population den-sity by administrative unit (e.g. municipality, region).
The comparison between victims ratio (victims by admin-istrative unit/total victims), population ratio (population by administrative unit/total population) and population density in the affected administrative units in Japan, Chile and Sri Lanka, i.e. prefectures, regions and districts, respectively, does not show a specific trend or relationship between these variables (Fig. 1). The correlation (Pearson coefficient,r)
be-tween the number of victims and the total population by anal-ysis unit is 0.37,−0.06 and−0.39 for Japan, Chile and Sri Lanka, respectively, while the correlation between the vic-tims and population density is 0.76, 0.48 and−0.40, respec-tively. Only Japan, where the tsunami travelled up to 10 km inland in some areas (Mori et al., 2012), shows some corre-lation between these variables, whilst being negative or very low for the other events.
More densely populated areas are supposed to have more people potentially affected if the area is exposed to the haz-ard; however, based on the post-tsunami census results it is not possible to connect high density units with potential high number of victims for every event. This would only be valid for events flooding huge coastal areas inland. Instead, popu-lation or popupopu-lation density in the exposed area might be a valid indicator. This statement is reinforced by some of the results provided in this article, such as those related to the distance to the sea. It can thus be asserted that for the identifi-cation of human exposure, some kind of numerical modelling is needed to calculate the potential exposed area, which will vary from one place to another depending on physical char-acteristics of the coastal zone and the hazard itself.
3.2 Receiving and understanding a warning message
Figure 1.Correlation between tsunami victims ratio, population ratio and population density (tsunami events of Japan 2011, Chile 2010 and Sri Lanka 2004).
are age, education level, literacy/illiteracy, immigration, lan-guage skills and ethnicity. However, although all this infor-mation is available for Sri Lanka and the age of the victims also for the other tsunami events, the fact of not having issued a warning in most of the cases cancels the possibility of vali-dating the indicators. A summary of the tsunami warnings in all the analysed tsunami events is presented next.
The 2011 Tohoku earthquake happened at 14:46 JST (LT). The earthquake EWS sent out warnings 1 min before the earthquake was felt in Tokyo and the Japanese Meteorologi-cal Agency (JMA) issued a loMeteorologi-cal tsunami warning 3 min af-ter the quake struck. The tsunami first reached the Japanese mainland 20 min after the earthquake and ultimately affected a 2000 km stretch of Japan’s Pacific coast (Mori et al., 2012). At 15:55 JST, the tsunami was observed flooding Sendai Air-port (Gupta and Gahalaut, 2013). Residents of the hardest-hit areas only had around 15 min of warning (i.e. time left for evacuation), though Tokyo would have had at least 40 min of warning (MIT Technology review, 2015).
The earthquake that triggered the 2010 Chilean tsunami happened at 03:34 LT. An initial tsunami warning was is-sued for Chile by NOAA’s Pacific Tsunami Warning Center 11 min after the earthquake and Chile’s Servicio Hidrográ-fico y OceanográHidrográ-fico de la Armada (SHOA) issued a tsunami warning within the same time frame. SHOA’s warning how-ever was cancelled shortly afterwards. Few coastal residents heard the warning or the cancellation due to widespread power outages and the official warning had little impact on survival (Dengler et al., 2012). This is also because the tsunami arrived within 30 min at many locations, and official evacuations and warnings by local authorities were often not in place prior to the arrival of the tsunami (Fritz et al., 2011). The 2009 Samoan tsunamigenic earthquake happened at 06:48:11 LT, the Pacific Tsunami Warning Center (PTWC) in Hawaii issuing its first alert 16 min after the quake, the government of Samoa enacting then its own early warning protocols (UNESCO ITST Samoa, 2009). By that time the first tidal wave had crashed into villages and resorts in Samoa and American Samoa. Those who survived had already fled to higher land, rattled by powerful earth tremors lasting sev-eral minutes (UWI-CDEMA, 2010).
The earthquake that triggered the 2004 Indian Ocean tsunami happened at 06:28:53 and 08:28:53 in Sri Lanka and Thailand (LT), respectively. The first tsunami wave reached the coast at 08:30–08:45 in Sri Lanka and at 09:30 in Thailand (both LT). On 26 December 2004, there was no tsunami warning communication system in the Indian Ocean. A working tsunami warning system was established only for the Pacific where PTWC had the authority to issue the tsunami information. Unlike the Pacific, there were also very few real-time seismic data and no available sea level data from the Indian Ocean from which to confirm a tsunami and its size (Igarashi et al., 2011). It was then not possible to warn the population living in the coastal areas.
From the tsunami events analysed, Japan was the only country which had a proper early warning system, which helped to warn the population about the approaching tsunami just 3 min after the earthquake happened. This fact, together with the society’s knowledge, awareness and preparedness against tsunami hazards helped to maximize the evacuees (Nakahara and Ichikawa, 2013). Most of those who did not succeed in evacuating in time were living in the hardest-hit areas and had too little time (around 15 min) to reach safe areas. Also, around 66 % of the victims were above 60 years old, which indicates that when an early warning sys-tem properly works, special attention in vulnerability assess-ments must be paid to the elderly due to the difficulties they face in evacuating immediately and quickly. Regarding this age group, the age indicator is also associated with the capac-ity of understanding a warning message; however, the death rate cannot be assumed to be directly linked to this indica-tor. The difficulties found in validating the age in terms of understanding a warning message makes it necessary to rec-ommend its use only as a mobility and evacuation speed in-dicator.
3.3 Mobility and evacuation speed
Figure 2.Age groups analysis (tsunami events of Japan 2011, Chile 2010, Samoa 2009 and Sri Lanka 2004):(a)pre-tsunami census,(b)
tsunami victims. The age of tsunami victims over 30 years old in Sri Lanka is not available disaggregated in ranges of 10 years.
sensitive to a tsunami event in terms of evacuation, this being the case of people with health problems, disabilities, physi-cal/intellectual limitations, the elderly and children, for ex-ample. These persons with greater difficulties in escaping will probably be supported by a family member, this fact be-ing connected to concepts of gender and dependency, since in many countries it is the woman who normally deals with family members who have some type of limitation. This sug-gests that a slower small group of people composed of at least 2 or 3 persons will be generated around mobility hand-icapped people, the intrinsic sensitivity of the latter being transferred to his/her immediate surroundings. Therefore, the slow population is likely to endanger other people trying to help them, as all of them will have less time for evacuation. This should be considered when identifying the vulnerable population. According to this idea, and based on the indica-tors presented in Table 3, age, gender, disability and depen-dency indicators are analysed and validated in this section.
3.3.1 Age
Most of the authors highlight the age groups including the elderly and children as being sensitive to possible tsunami events due to difficulties in both mobility and evacuation speed. The chosen age ranges in the diverse works vary according to the information available for each case study (i.e. census data). Most of the post-tsunami reports (Mazu-rana et al., 2011; government of Japan, 2012; etc.) con-firm higher mortality associated with these groups. Rofi et al. (2006) found that it was primarily people aged 9 years and younger and 60 years and older who were killed in In-donesia’s Aceh Barat and Nagan Raya districts during the tsunami in 2004. UNFPA (2005) stated that the majority of survivors in tsunami-affected villages in Nanggroe Aceh Darussalam province, both male and female, were in the teenage and adult range of 15–45 perhaps because they were physically and mentally strong enough to survive the tsunami and the post-tsunami period. Nakahara and Ichikawa (2013) stated that whereas studies in Indonesia and Sri Lanka
(In-dian Ocean Tsunami 2004) reported higher mortality rates among children, the elderly and women, the 2011 tsunami in Japan is characterized by lower mortality rates among chil-dren, increased mortality rates with age and no mortality dif-ferences between the sexes, perhaps due to the existence of a better tsunami warning system. The higher mortality pattern among the elderly in Aceh province, Indonesia, highlights the difficulties had in evacuating promptly or being able to withstand the force of the tsunami (Doocy et al., 2007).
In order to better understand the real mortality patterns, Fig. 2 jointly analyses the percentage of human losses by age group for the four tsunami events (Fig. 2b), together with the age group structure in the country before each event, based on the immediately preceding census (Fig. 2a). The tsunami victims graph shows higher mortality percentages associated with older people and children. However, mortality percent-ages vary substantially among countries. Focusing on the pre-tsunami census graph, three different country profiles can be distinguished according to their development level. Japan is a developed and aged country with 43.4 % of the popula-tion over 50 years old and 17.9 % below 20 years old; Samoa, as an undeveloped country, has a younger population, with 13.3 % over 50 years old and 49.2 % below 20 years old; and both Chile and Sri Lanka, as developing and “medium-aged” countries, have an intermediate profile with around 19 % over 50 years old and around 35 % below 20 years old.
to the whole profile of the country and the structure of the population before an event.
Figure 3c and Table 4 show the death rate ratios (DRR) by age groups and for the four tsunami events. The DRR is calculated by dividing the percentage of tsunami victims (Fig. 3b) by the percentage of population for each age group (Fig. 3a). The result provided is the factor by which one must multiply the percentage of each population age group, to es-timate the expected percentage of victims in that group. The points located above the DRR with value 1 imply that the death related to these age groups is associated with a higher vulnerability to the tsunami event and not to the pre-event structure of the population. The most vulnerable age groups are those below 10 years old and above 60 years old. Age groups above 60 years old are always, for all the tsunami cases, amplifying their percentage in terms of victims, the DRR increasing with age. The DRR is between 0.96 and 1.60 for the age group 50–59, between 1.35 and 2.88 for the age group 60–69 years old and between 2.84 and 6.88 for people above 70 years old. The DRR of children (0–9 years old) is lower than for the elderly, being between 0.36 and 1.78. For the age groups between 10 and 49 the ratio varies between 0 and 1 for all countries and events, indicating that the per-centage of expected victims in each of these age groups is less than the percentage given by the census, regardless of the development profile of the country.
The percentages of child victims for the four events show a range that goes from 3 % in Japan to 47 % in Samoa. Chil-dren, as a dependent group, are particularly sensitive to the timing of the tsunami as it determines their potential location and company, at school with teachers, at home with family, or playing with other children in the street, for example. Ac-cording to Table 2, the approximate timing of each event was: Friday at 3 p.m. (Japan), Saturday at 3.50 a.m. (Chile), Tues-day at 7.15 a.m. (Samoa), SunTues-day at 8.28 a.m. (Sri Lanka) and Sunday at 9.28 a.m. (Thailand). Only Japan received the tsunami on a weekday during working hours; this may be the reason for the low mortality in children. Nakahara and Ichikawa (2013) corroborates this idea suggesting that the timing of the tsunami might have influenced age–sex mortal-ity patterns. While the 2004 Indian Ocean tsunami hit rural communities on Sunday morning, when children and women were at home but men were working away from home (e.g. engaged in offshore fishing), the 2011 Japan tsunami hit communities in the afternoon on a weekday, when children were attending school or kindergarten. The high tsunami pre-paredness and awareness of the Japanese society indicates that schools might have provided adequate protection and evacuation, justifying the low child mortality rate.
Literature on vulnerability assessments shows that the in-dicators which measure sensitive age groups, specifically children, vary a lot according to the census information available in each case study. Thus, several age groups have been proposed to be considered as sensitive: children be-low 5 years old (Dwyer et al., 2004; Grezio et al., 2012),
below 6 years old (UNU-EHS, 2009), below 10 years old (González-Riancho et al., 2014), etc. However, the analy-sis of child-related age groups, i.e. 0–4 and 5–9 year olds, for the tsunami events studied in this work, does not show a clear pattern when comparing pre- and post-tsunami cen-suses (Fig. 4). The pre-tsunami child population is quite ho-mogeneous, i.e. the four countries having around 50 % of both age groups. The tsunami victims show a homogeneous distribution in Japan and Sri Lanka, this not being the case for Chile and Samoa. Nonetheless it should be acknowledged that the small size of both Chile and Samoa samples (28 and 68 child victims, respectively) could affect the presented re-sult, since Japan and Sri Lanka (466 and 4368 child victims respectively) show similar percentages to the pre-tsunami census. Focusing on the latter, both age groups could be as-sumed to be similarly vulnerable in terms of the number of victims and could jointly be assessed (i.e. 0–9 years) in future vulnerability assessment studies.
3.3.2 Gender
As far as the gender indicator is concerned, the South Asian Disaster Knowledge Network (SADKN) defines the word “gender” as a cultural construct consisting of a set of dis-tinguishable characteristics, roles and tasks associated with each biological sex1.
This term is mainly associated with women in disaster risk management, as women tend to be at a more disadvantageous position in society as compared to men. Several post-tsunami reports in different countries pointed out the higher death rate among women. For the Indian Ocean tsunami (2004), surveys carried out by Oxfam in villages in Aceh Besar and North Aceh districts (Indonesia) confirmed higher mortality rates 4 times higher among females (Oxfam, 2005). Rofi et al. (2006) found that two-thirds of those who died in Indone-sia’s Aceh Barat and Nagan Raya districts (Aceh province) were female. Oxfam (2005) mentions the massive and dis-proportionate toll that the tsunami took on the women of Sri Lanka, cutting across ethnic lines. Regarding the east Japan disaster (earthquake and tsunami), Saito (2012) stated that in the areas that were worst affected by the disaster, women made up 54 % of deaths. In Tohoku, gender roles remain very traditional and women are seen as responsible for taking care of other family members (Saito, 2012). Vil-lagrán de León (2008) stated that, according to Guha-Sapir et al. (2006) and Birkmann (2006), in the case of tsunamis, women, children and elderly persons are more vulnerable than men. According to these results, most of the authors use gender as an indicator for tsunami vulnerability assessments (see Table 1).
Oxfam (2005) explained the gender results in various countries affected by the 2004 Indian Ocean tsunami stating
1http://www.saarc-sadkn.org/theme_social_gender.aspx (last
Figure 3.Analysis of mortality by age group (tsunami events of Japan 2011, Chile 2010, Samoa 2009 and Sri Lanka 2004) according to (a)pre-tsunami census;(b)tsunami victims and(c)tsunami death rate ratio (C=B/A). The age of tsunami victims over 30 years old in Sri
Lanka is not available disaggregated in ranges of 10 years, consequently this age range is not represented in the graph. The mean values for this age range are calculated considering only the other three tsunami events.
Table 4.Tsunami death rate ratios (Japan 2011, Chile 2010, Samoa 2009 and Sri Lanka 2004). The age of tsunami victims over 30 years
old in Sri Lanka is not available (N/A) disaggregated in ranges of 10 years; consequently the mean value for this age range is calculated considering only the other three tsunami events.
Tsunami death rate ratios
Age groups 2011 Japan 2010 Chile 2009 Samoa 2004 Sri Lanka Mean 0–9 0.36 0.95 1.77 1.78 1.21 10-19 0.29 0.43 0.15 0.83 0.43 20–29 0.31 0.66 0.24 0.65 0.46 30–39 0.39 0.58 0.54 N/A 0.51 40–49 0.56 0.53 0.49 N/A 0.53 50–59 0.96 1.60 0.98 N/A 1.18 60–69 1.35 2.88 1.77 N/A 2.00 70 or more 2.84 3.37 6.88 N/A 4.36
that (1) while males were working either fishing far out at sea or out in agricultural fields or markets, women and children stayed at home; (2) the sheer strength needed to stay alive in the torrent was also often decisive in determining who sur-vived; many women and young children were unable to stay on their feet or afloat in the powerful waves and were sim-ply tired and therefore drowned; (3) women clinging to one or more children would have tired even more quickly and (4) the skills that helped people survive the tsunami, espe-cially swimming and tree climbing, are taught to male chil-dren in Sri Lanka to perform tasks that are done nearly ex-clusively by men. These four explanations respond to differ-ent aspects to be considered in future vulnerability assess-ments: probability and vulnerability. On the one hand, the probability of being affected should be analysed for each study area and requires understanding the site-specific
cul-tural traditions to correctly measure the temporal exposure (e.g. women and children at the beach on a Sunday morning while men are working). On the other hand, it is essential to understand the vulnerability of specific sectors of society such as women and children due to their intrinsic characteris-tics (i.e. less physical strength) or to gender-related roles (i.e. family care roles, dependency and specific skills like swim-ming).
Figure 4.Analysis of child age groups (tsunami events of Japan 2011, Chile 2010, Samoa 2009 and Sri Lanka 2004) according to(a)
pre-tsunami census data and(b)data on tsunami victims.
Figure 5.Gender analysis (tsunami events of Japan 2011, Chile 2010, Samoa 2009 and Sri Lanka 2004) according to(a)pre-tsunami census
data and(b)data on tsunami victims.
Chile, even when the population distribution in the country before the tsunami is male-predominant, such as in Samoa. The percentage of female victims is higher when the coun-try is less developed and might be related to dependency and gender roles. However, to understand the reasons condition-ing the higher female mortality, it is essential to analyse this information in an age-disaggregated format. Figure 6 shows the population pyramids for the four countries and both pre-and post-tsunami censuses, illustrating the distribution of age groups by sex.
As far as the age analysis in Fig. 6 is concerned, the pre-tsunami graphs on the left confirm the previous classi-fication of the countries according to development profiles: (i) Japan as an aged country with a contracting pyramid typ-ical of developed countries with negative or no growth, pop-ulation generally older on average, indicating long life ex-pectancy and low death and birth rates; (ii) Chile/Sri Lanka with stationary pyramids typical of developing countries that tend to ageing and have finished their demographic transi-tion; and (iii) Samoa as a young country, with an expand-ing population pyramid that is very wide at the base, in-dicating high birth and death rates, typical of undeveloped countries. The post-tsunami graphs on the right show a co-herent classification pattern: (i) Japan has the highest mortal-ity among the age group of over 60 year olds; (ii) Chile and Sri Lanka show quite a homogeneous distribution among age groups with high mortality among the elderly and children; and (iii) Samoa presents very high mortality among children
and a high mortality among the elderly. These results of age analysis are summarized in Fig. 7 which presents population rates and tsunami mortality rates by age and type of popula-tion pyramid.
Figure 6.Population pyramids (tsunami events of Japan 2011, Chile 2010, Samoa 2009 and Sri Lanka 2004) according to:(a),(c),(e)and (g)pre-tsunami census data, and(b),(d),(f)and(h)data on tsunami victims. The age of tsunami victims over 30 years old in Sri Lanka is
not available disaggregated in ranges of 10 years(h).
Figure 7.Comparison between(a)population rates and(b)tsunami mortality rates by age and type of population pyramid (tsunami events
of Japan 2011, Chile 2010 and Samoa 2009).
cannot statistically back up a conclusion on male mortality or male vulnerability. In Sri Lanka, the high female mortality rate for all the age groups may be related to three aspects, the first two being closely linked: the timing of the tsunami, the
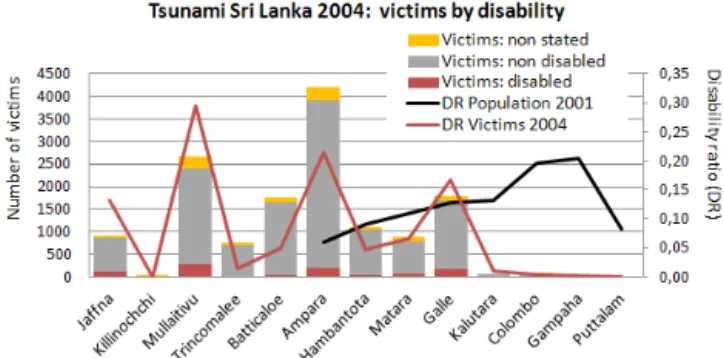
Figure 8. Tsunami disabled victims by age and sex (Sri Lanka tsunami 2004).
3.3.3 Disability
Disability, understood as any physical and/or mental lim-itation affecting the mobility of people and/or the ability to understand a warning message respectively, is referred by several authors (UNU-EHS, 2009; Dwyer et al., 2004; González-Riancho et al., 2014; Grezio et al., 2012; Post et al., 2009) to be a critical factor hindering evacuation. This indicator is analysed and validated here through the tsunami impacts in Sri Lanka in 2004, as no data are available for the other events.
As mentioned before, the 2004 Indian Ocean tsunami hit rural communities on Sunday morning, when children and women were at home or at the beach but men were work-ing away from home (i.e. tsunami timwork-ing and gender issues). Additionally, the analysis of the Sri Lankan disabled victims by sex and age (Fig. 8) shows a higher percentage of female disabled victims (65 %) than male, while the census 2001 shows a male to female disability ratio of 1.3 : 1. Analysing the disabled victims by age group, the percentage of female disability for the 0–18, 19–49 and 50 or older age groups is 51, 68 and 60 % respectively. These disability conditions might have contributed to the higher mortality in women.
The 2001 census states that 2 % of the Sri Lankan pop-ulation were disabled, of which 3 % were affected by men-tal limitations, while 97 % were affected by different phys-ical limitations: 18 % in seeing, 19 % in hearing/speaking, 24 % in hands, 12 % in legs and 24 % other physical disabil-ity. These percentages imply that disability in Sri Lanka is associated with understanding a warning message in 22 % (total mental and hearing/speaking limitations) of cases and to mobility and evacuation speed in 88 % of cases. The 2004 post-tsunami census provided a 7 % of disabled victims (an-other 7 % of the victims had “not stated” disability), of which 30 % corresponds to Mullaitivu, 21 % to Ampara, 17 % to Galle and 13 % to Jaffna, as shown in Fig. 9. The number and distribution of disabled victims is related to the number of victims, not to the disabled population in 2001. In other words, higher numbers of disabled people do not translate into higher numbers of victims.
3.3.4 Dependency
Gender-related roles are highly connected to the concept of dependency in the field of disasters, as women, in many cases
Figure 9.Tsunami victims in Sri Lanka (2004) by disability and
pre-/post-tsunami disability ratios (disability ratio=disabled by
district/total disabled). No data about disabled population in the Tamil districts (Jaffna–Batticaloe) are available in the 2001 census.
and countries, are in charge of caring after the family mem-bers at home, such as children, the elderly, ill and disabled people (Saito, 2012; Villagrán de León, 2008; Guha-Sapir et al., 2006; Birkmann, 2006; Oxfam, 2005; etc.). The depen-dency ratio has been calculated for the four countries as the added population below 10 and above 60 years old (depen-dent population), multiplied by 100 and divided by the pop-ulation between 10 and 59 years old (active poppop-ulation). The dependency ratio has been found to be very high for Japan (65.22) and Samoa (50.77) due to the number of the elderly and children, respectively, and lower for both Chile (38.22) and Sri Lanka (38.09).
Figure 10.Female mortality for different tsunami events and its relationship with the concept of dependency (tsunami events of Japan 2011,
Chile 2012, Samoa 2009 and Sri Lanka 2004). Pre-tsunami censuses appear in light red and tsunami victims in dark red. Panel(a)shows female mortality considering all age groups and panel(b)shows female mortality considering only the active age groups (10–59 years old
for Japan, Chile and Samoa, while 10–49 years old for Sri Lanka due to data availability), assuming that women in this age range may have been in charge of family members (children and the elderly). Higher percentages of female victims in the active age group compared to the pre-tsunami percentages provide the female mortality associated with dependency issues.
The population in Japan has the highest life expectancy in the world and is ageing faster than any other industrialized country. Thus despite the laws designed to help ensure fam-ily support, traditional support that was once guaranteed is no longer assured today (Rickles-Jordan, 2007).
The Survey on Tsunami Evacuation, targeted at people af-fected by the earthquake and tsunami in the Iwate, Miyagi and Fukushima Japanese prefectures (n=521 women, 336 men), and jointly conducted by The Cabinet Office, Fire and Disaster Management Agency and the Japan Meteorologi-cal Agency in July 2011, concluded that almost 30 % of males evacuated alone; women had a stronger connection with their local community than men, as 82 % evacuated in small groups.
3.4 Safety of buildings
The safety of buildings, in terms of their capacity for pro-viding shelter in case of a tsunami event, is analysed here as a human vulnerability indicator through the relationship be-tween the number of victims and the type of damage to build-ings for the different tsunami events, this information being available in the various tsunami censuses analysed. Accord-ing to this relationship, several indicators affectAccord-ing the type of damage (see Table 3) are analysed and validated in this section: type of building, shoreline distance and building ma-terials.
The existing connection between the total number of vic-tims and the number of buildings affected is shown in Fig. 11 for the tsunami events of Japan 2011, Sri Lanka and Thai-land 2004. The Pearson correlation coefficient (r)between
the number of victims and total number of buildings affected is medium–high for the three events analysed, i.e. whereris
0.53 (Japan),ris 0.79 (Sri Lanka) andris 0.99 (Thailand).
Moreover, the analysis of the type of damage in the affected buildings shows a very high correlation between the number of completely damaged buildings (total collapse category for Japan) and the number of victims: 0.88, 0.86 and 0.99 for
Japan, Sri Lanka and Thailand, respectively. In the cases of the Iwate prefecture in Japan, or Mullaitivu and Hambatota districts in Sri Lanka, a higher proportion of victims than affected buildings is identified, maybe due to the fact that a very high percentage of the affected buildings were com-pletely damaged (64 % in Iwate, 91 % Mullaitivu, 60 % in Hambatota) so the population had almost no place for evac-uation or shelter. Considering the completely damaged and partially damaged (unusable) houses as those that did not provide shelter during the tsunami event and that forced the population to escape and search for other shelters, there is a high correlation between these groups of buildings and mor-tality results.
The following analyses try to understand the possible cor-relation patterns between the building’s type of damage and other variables such as distance to the sea, topography, type of building, water depth, building materials or number of storeys. Most of the data used come from the post-tsunami census of Sri Lanka 2004, together with some conclusions from previous publications regarding relevant aspects about the safety of buildings.
3.4.1 Distance to the sea
Figure 11.Correlation between total tsunami victims and affected buildings by type of damage and region (tsunami events of Japan 2011,
Thailand 2004 and Sri Lanka 2004).
buildings and consequently the number of victims. This fac-tor should be considered in future human vulnerability anal-yses.
3.4.2 Coastal topography
As far as coastal topography is concerned, Nakahara and Ichikawa (2013) suggested for Japan that the lower overall mortality rates in Fukushima may be due to the greater ex-panse of flatlands and the larger number of people living in-land, and thus the smaller proportion of people inundated, in contrast to the situation in Iwate and Miyagi, where most of the population live in narrow coastal strips. Suppasri et al. (2013) proved that the damage probabilities for build-ings located on the ria coast (2011 Tohoku tsunami, Ishi-nomaki city results) generally increase more and are higher than those in the plain coast, possibly due to higher veloci-ties associated with the coastal topography. The probability of having buildings (mixed structural material) washed away for different inundation depths and for the plain coast and ria coast, respectively, is as follows: <0.05 and 0.4 (2 m),
0.1 and 0.6 (3 m), 0.5 and 0.8 (5 m) and 1 and 0.9 (9 m). Regarding the impacts of the 2004 Indian Ocean tsunami in Sri Lanka, Wijetunge (2014) stated that shore-connected waterways such as rivers, canals and other water bodies like lakes and lagoons provided a low-resistant path for the tsunami-induced surge to travel upstream into areas further interior in the study zone (southwest coast). Also, he com-pared the impacts on three adjacent coastal stretches (in Hikkaduwa Divisional Secretariat) to understand how differ-ent factors besides the oncoming tsunami amplitude explain the differences in the extent of inundation. Relatively
low-lying onshore terrain, negative landward slopes and, proba-bly to a lesser extent, the type and density of land cover are the main factors that have converged unfavourably to cause greater tsunami impact on one stretch (average inundation distance 1.2 km inland, 81 victims) compared to neighbour-ing stretches (average inundation distance 150 and 350 m in-land, 12 and 19 victims, respectively).
The direct exposure of the Sri Lankan northern and east-ern provinces (Jaffna–Ampara) to the tsunami trajectory, the location of the coastal communities on a flat coastal plain indented every few kilometres by coastal lagoons and local topography-related tsunami effects contributed to the huge death tolls in the area (72 % of the victims).
3.4.3 Type of building
build-Figure 12.Correlation between number of tsunami victims, buildings’ type of damage and distance to the sea (Sri Lanka tsunami 2004).
Figure 13.Analysis of damaged buildings (Sri Lanka tsunami 2004) according to(a)comparison between number of housing units (HU)
and non-housing units (NHU) affected by type of damage;(b)correlation between numbers of tsunami victims, damaged HU and building materials and(c)and(d)correlation between numbers of tsunami victims, buildings’ type of damage and water depths.
ings). The tsunami census carried out by the Sri Lankan government focuses on HU; therefore, the next analyses in Fig. 13 do so as well.
3.4.4 Building materials and water depths
to Ampara show higher percentages of temporary materials and have associated higher numbers of victims. Mullaitivu had 5700 affected HUs (ninth position among the 13 dis-tricts) with 2652 victims representing 19 % of the total vic-tims (second district most affected). This huge human impact can partly be explained by the building materials, as 72 % of the damaged HUs had temporary roofs, 68 % had temporary walls and 65 % had temporary floors; these were the highest percentages among the 13 districts. This result highlights the relevance of materials in the response of buildings to the im-pacts of the tsunami. This is coherent with the result obtained in Fig. 11, where Mullaitivu appears with 77 % of affected buildings as completely damaged.
Figure 13c shows the correlation between type of damage to HUs and water depths. Almost 73 % of the HUs affected by water heights between 2.1 and 3 m in Sri Lanka were crit-ically damaged (completely and partially-unusable), the per-centage increasing up to 92 and 94 % for water heights above 3.1 and 6.1 m, respectively. Fig. 13d shows the correlation between the number of affected HUs with submerged water heights and the number of victims by region. Based on the affected HUs, Jaffna, Ampara and Galle received the highest tsunami waves, with between 101 and 350 HUs having faced waves of more than 9 m.
According to the fragility functions developed for Samoa 2009 by Reese et al. (2011), severe damage and collapse are clearly a result of building type, with residential timber struc-tures the most fragile, followed by masonry residential and reinforced concrete residential structures. Based on residen-tial masonry building data, it was clearly shown that shield-ing reduces, while entrained debris increases, the fragility of structures (i.e. reduces the damage state exceedance proba-bility for a given water depth). These results roughly con-firm the observations made in the aftermath of the 2004 In-dian Ocean tsunami in Banda Aceh (Leone et al., 2011) and of the 2006 Java tsunami where exposed buildings had sus-tained damage levels 2 to 5 times higher than the shielded ones (Reese et al., 2007). The tsunami fragility curves pro-vided by Suppasri et al. (2013) for Japan 2011, showed that reinforced concrete (RC) is the strongest structure against water depth, followed by steel, masonry and wood. All wood buildings and most lightweight buildings were washed away when inundation depth was>10 m while only 50 % or fewer
steel and RC buildings were washed away; these latter ma-terials played therefore a very important role in preventing a building from collapsing or being washed away. The tsunami fragility curves provided by Tinti et al. (2011) for Banda Aceh (Indonesia) 2004 also prove that the damage increases with flow depth for all building materials. Total collapse of buildings occurs to light constructions and reinforced con-crete buildings with flow depths of about 4 m and more than 15 m, respectively.
3.4.5 Number of storeys
According to Suppasri et al. (2013) for the 2011 Tohoku tsunami, buildings of three or more storeys were confirmed to be much stronger than the buildings of one or two storeys under the same inundation depth (results provided for reinforced concrete and wood buildings). The differences in damage probability between one-storey and two-storey buildings were not very large. However, the damage prob-ability is significantly reduced for the case of multi-storey buildings over three floors; the probability of having a RC building washed away was 0.2 for a 10 m inundation depth. According to the UNESCO ITST Samoa (2009), buildings are more likely to survive with less damage if they have ele-vated floor levels, reinforced concrete or core-filled concrete block walls, sound foundations, are shielded and are well constructed.
To sum up the results on safety of buildings, the number of victims is directly related to the number and type of damage to affected buildings, being highly correlated to the number of completely damaged ones. The type of damage depends on the location of the building and the building fragility. The location of the building implies higher or lesser flow depths conditioned by the distance to the sea and the topography, while the building fragility relates to the resistance of the building to the hazard and depends on the building materi-als and the number of storeys. Therefore, it is proposed here to include these two building-related aspects (location and fragility) in future human vulnerability assessments.
3.5 Economic resources
Population groups with lower incomes are more sensitive to the threat due to various reasons, related to living in pre-carious areas, having homes built with non-resistant mate-rials and most likely not having property insured, having less money to recover from the impact (e.g. rebuilding a home, surviving unemployed for a while, economically supporting the family, migrating).
Figure 14.Percentage distribution of completely damaged housing units (left) and number of tsunami victims (right) by reported monthly
income of the housing unit (Sri Lanka tsunami 2004). LKR 5000=EUR 27.71, on 10 July 2014.
Figure 15.Distribution of tsunami victims by employment and district (Sri Lanka tsunami 2004). Panel(a)shows distribution of dead/missing persons by the employment they were engaged in before death/disappearance; panel (b)shows distribution of dead/missing persons by
employment and sex.
the understanding of (i) poverty-related human vulnerabil-ity, (ii) which the most vulnerable livelihoods are in terms of activity location, cultural traditions, the different gender roles by activity, etc.; (iii) which livelihoods struggle after the event due to lack of workers; and (iv) which livelihoods will suffer economic losses with the subsequent impact to households’ and country’s economies.
Figure 14 shows the number of victims and affected build-ings and the percentage distribution of completely damaged HUs, by reported monthly income of the HU. Very high per-centages of low-income profile HUs are found for this type of damage, especially in the northern and eastern provinces (Jaffna–Batticaloe), where 73–95 % of the completely dam-aged HUs had a monthly income of less than LKR 5000 (EUR 27.71, on 10 July 2014). The percentage of HU within this income category is around 50–60 % in the other districts. Figure 15a shows that 32 % of the victims in Sri Lanka were related to the primary sector of the economy (3 %
agri-culture/farming, 29 % fishing), 12 % to the secondary sec-tor (4 % coir industry, 1 % lime stone industry and 7 % other manufacturing industries), 27 % to the tertiary sector (15 % trade, 1 % tourism and 11 % other related services), 9 % to the government sector and 20 % to an unidentified cate-gory (“other”). The victims from the northern and eastern provinces (Jaffna–Batticaloe) are mainly related to fishing, while from Ampara to Galle (southern province) the victims are more related to the government sector, tourism, trade and services, coir and other manufacturing industries.
Table 5.Summary of the conclusions obtained on tsunami vulnerability indicators (where DRR is the death rate ratio, HU is the housing unit and NHU is the non-housing unit).
Conclusions on vulnerability indicators Validated in
Human exposure
Exposure: human exposure is not only related to population density. Important to consider indicators related Japan, Chile, to buildings as well as temporal exposure patterns related to livelihoods, cultural traditions and gender roles. Sri Lanka Hazard modelling essential to identify exposed area and wave depths.
Mobility and evacuation speed
Age: the elderly and children are vulnerable age groups, the former having higher mortality rates. Mortality Japan, Chile, Samoa, of other age groups just related to the population structure before an event. Child age groups (0–4 and Sri Lanka
5–9 years) equally vulnerable in high death toll events. DRR conditioned by country’s development profile (population pyramids), being especially high for age groups above 60 years old and increasing with age.
Sex/gender: female mortality is not always higher. Further considerations needed (population pyramids, Japan, Chile, Samoa, development profile of the country, longevity, gender roles, dependency, cultural traditions etc.). Sri Lanka
Disability: the number and distribution of disabled victims is related to the number of victims, not to the disabled Sri Lanka population in the pre-tsunami census. Higher numbers of disabled people do not translate into higher numbers of
victims.
Dependency: female mortality is not always related to dependency issues (only Samoa and Sri Lanka in this work). Japan, Chile, Samoa, Dependency and gender-related roles seem to be associated, to a greater extent, with undeveloped and developing Sri Lanka
countries.
Safety of buildings
Type of damage: high correlation between affected buildings and number of victims, very high for completely Japan, Samoa,
damaged buildings. Sri Lanka
Building Distance to the sea: distance to the sea is proved to be an important determining factor regarding Sri Lanka location the type of damage in buildings and consequently the number of victims. 72 % of the housing units
within the 200 m boundary line from the shoreline were completely damaged.
Coastal topography: higher mortality rates in narrow coastal strips compared to flatlands. Higher Japan (Nakahara and probability of buildings damage in ria coast compared to plain coast. Greater tsunami impacts on Ichikawa, 2013; shore-connected waterways, low-lying onshore terrain and negative landward slopes. Suppasri et al., 2013)
Sri Lanka (Wijetunge, 2013) Shielding: shielding reduces the fragility of structures. Samoa (Reese et al.,
2011), Java (Reese et al., 2007), Sumatra (Leone et al., 2011)
Building Type of building: not relevant. HU and NHU had similar percentages of type of damage. Sri Lanka fragility
Building materials: high correlation between building materials, type of damage and number Sri Lanka of victims. Affected buildings present higher percentages of temporary materials and have higher
associated numbers of victims.
Water depths: high correlation between water depths, building materials and type of damage. Sri Lanka; Indonesia Almost 73 % of HUs affected by water heights between 2.1 and 3 m in Sri Lanka were critically (Tinti et al., 2011), damaged. Higher percentages of lightweight buildings washed away compared to reinforced Japan (Suppasri et al., buildings under the same inundation depth in Indonesia and Japan. 2013)
Debris: entrained debris increases the fragility of structures. Samoa (Reese et al., 2011)
Storeys: buildings of three or more storeys confirmed to be much stronger than buildings of one Japan (Suppasri et al., or two storeys under the same inundation depth. 2013)
Economic resources
Income/poverty: very high percentages of low-income-profile related to completely damaged housing units. Sri Lanka Vulnerable groups and impacts affecting recovery.
Type of occupation: the activity location (tsunami exposure), its social and economic contribution as well Sri Lanka as gender-related aspects are important to identify vulnerable livelihoods and potential socioeconomic
female activity (96 % female victims). To assess the vulnera-bility of the socioeconomic activities of a study site it is im-portant to acknowledge the location where each activity takes place in terms of tsunami exposure, its social and economic contribution to the community, region or country, as well as gender-related aspects. This will facilitate the promotion of adequate awareness and training campaigns on the various risk reduction measures.
3.6 Summary of major findings
Table 5 summarizes the main results obtained from the anal-yses presented in this work.
4 Conclusions
After several tsunami events with disastrous consequences around the world, coastal countries have realized the need to be prepared, which is conditioned by the existence of early warning systems, the development of tsunami risk assess-ments to identify critical spots and various awareness and training campaigns, among others. Consequently, the inter-national scientific community is striving to develop and val-idate methodologies for tsunami hazard, vulnerability and risk assessments.
A comprehensive review of the existing works on tsunami vulnerability assessment based on indicators has been carried out to identify those currently used to assess human vulner-ability. Most authors agree on some indicators such as age, sex, illiteracy, disability, critical buildings, number of floors etc., and some of them add some more creativity, trying to capture all aspects affecting in some way the preparedness and response to such event, e.g. coordination networks, so-cial awareness, and so on. Although the various authors pro-pose and apply different indicators according to the scope of their work and the available information, all of the ap-plied exposure and vulnerability indicators follow specific thematic areas and have been organized within four main cat-egories and 10 key issues.
To validate the compiled indicators, the impacts gener-ated in several countries (Japan, Chile, Samoa, Sri Lanka and Thailand) by the 2011 Great Tohoku tsunami, the 2010 Chilean tsunami, the 2009 Samoan tsunami and the 2004 In-dian Ocean tsunami are evaluated. The validation is based on the comparison of the pre- and post-tsunami official censuses to understand if the tsunami mortality trends are related to the event itself or to pre-tsunami existing population patterns and vulnerability characteristics. This section demonstrates the most relevant results.
Permanent human exposure, understood as the number of communities/people normally located in the hazard area, is proved to not only be related to population density of the administrative unit (which is the most commonly ap-plied indicator) but also related to the exposed area. Tsunami
hazard modelling is essential to identify the communi-ties at risk. Temporal human exposure is related to site-specific livelihoods, cultural traditions and gender roles, has daily/weekly/monthly variability and requires studying the temporal patterns of the community before proposing vul-nerability indicators. This is the case, for example, for the tsunami impacts in Sri Lanka on Sunday morning, where women and children were at the beach while men were fish-ing.
Focusing on the population-based indicators, age has proved to be important in a vulnerability assessment. Death rate ratios (DRR) by age groups are provided in this work to understand whether the death related to each age group is associated with a higher vulnerability to the tsunami event or to the pre-event structure of the population. The DRR are conditioned by the country’s development profile (population pyramids). The results confirm that the most vulnerable age groups are the elderly and children; however the former have much higher mortality rates than children; the rates are es-pecially high for age groups above 60 years old and increase with age. Mortality of other age groups is just related to the population structure before an event. Child age groups (0– 4 and 5–9 years) are equally vulnerable in high death toll events. Regarding sex/gender issues, it has been found that female mortality is not always higher than male mortality. Consequently, further considerations are needed regarding the development profile of the country and associated pop-ulation pyramid, potential women longevity, gender roles, dependency, cultural traditions, etc. Also, female mortality is not always related to dependency issues (only in Samoa and Sri Lanka in this work). Dependency and gender-related roles seem to be an issue to a greater extent in undeveloped and developing countries. Regarding disability, higher num-bers of disabled people did not translate into higher numnum-bers of victims in the affected districts of Sri Lanka.
Furthermore, based on the overall results obtained, it is clear that mortality is not only related to the characteristics of the population but also to the buildings. In this sense, a high correlation has been found between the affected buildings and the number of victims, being very high for completely damaged buildings. The factors determining the type of dam-age in buildings have been analysed and can be grouped into two categories: building location and building fragility. Re-garding the building location, the distance to the sea has proved to be an important determining factor; it is con-sequently correlated to the number of victims. Regarding the building fragility, building materials and expected water depths have been confirmed to be high correlated to the type of damage, which agrees and reinforces previous works on the topic in different countries (Tinti et al., 2011; Suppasri et al., 2013). The calculation of tsunami water depths requires numerical modelling of the hazard.
well as the expected wave depths; both indicators condition the expected number of victims.
The results and conclusions presented in this paper vali-date, in light of past tsunami events, some of the indicators currently proposed by the scientific community to measure human vulnerability and help define site-specific indicators for future tsunami vulnerability assessments.
Finally, we would like to highlight the excellent work done by the government of Sri Lanka in characterizing the impacts suffered as a result of the Indian Ocean tsunami of 2004 and the great usefulness to science of making this information available and easily accessible to the public.
Acknowledgements. The authors acknowledge the European
Union 7th Framework Programme project ASTARTE (Assessment, Strategy And Risk Reduction for Tsunamis in Europe) in the framework of which this work was performed and funded. Edited by: I. Didenkulova
Reviewed by: A. Armigliato and one anonymous referee
References
ADPC (Asian Disaster Preparedness Center): Thailand – Post Rapid Assessment Report: Dec 26th 2004 Tsunami, available at: http://www.adpc.net/v2007/ikm/ONLINEDOCUMENTS/ downloads/TsunamiRapidAssessmentReport_15Feb.pdf (last access: 1 August 2014), 2007.
Alliance Development Works in collaboration with United Na-tions University and The Nature Conservancy: World Risk Re-port 2012, Alliance Development Works, Berlin, ISBN 978-3-9814495-0-3, 2012.
Álvarez-Gómez, J. A., Aniel-Quiroga, Í., Gutiérrez-Gutiérrez, O. Q., Larreynaga, J., González, M., Castro, M., Gavidia, F., Aguirre-Ayerbe, I., González-Riancho, P., and Carreño, E.: Tsunami hazard assessment in El Salvador, Central America, from seismic sources through flooding numerical models., Nat. Hazards Earth Syst. Sci., 13, 2927–2939, doi:10.5194/nhess-13-2927-2013, 2013.
Arikawa, T., Tatsumi, D., Matsuzaki, Y., and Tomita, T.: Field Sur-vey on 2009 Samoa Islands Tsunami, Technical Note of The Port and airport Research Institute PARI, No. 1211, 2010.
Birkmann, J.: Measuring the un-measurable, UNU-EHS SOURCE 5/2006, Bonn, Germany, 2006.
CRED (Centre for Research on the Epidemiology of Disasters): The human cost of natural disaster, a global perspective, available at: http://emdat.be/human_cost_natdis, last access: 15 May 2015. Cruz, A. M., Krausmann, E., and Franchello, G.: Analysis of
tsunami impact scenarios at an oil refinery, Nat. Hazards, 58, 141–162, doi:10.1007/s11069-010-9655-x, 2011.
Dall’Osso, F., Gonella, M., Gabbianelli, G., Withycombe, G., and Dominey-Howes, D.: Assessing the vulnerability of buildings to tsunami in Sydney, Nat. Hazards Earth Syst. Sci., 9, 2015–2026, doi:10.5194/nhess-9-2015-2009, 2009.
Damm, M.: Mapping Social-Ecological Vulnerability to Flooding, Graduate Research Series, PhD dissertations, Publication Series
of UNU-EHS Vol. 3, United Nations University – Institute for Environment and Human Security (UNU-EHS), Bonn, ISBN: 978-3-939923-46-6, 2010.
Dengler, L., Araya, S., Graehl, N., Luna, F., and Nicolini, T.: Fac-tors that exacerbated or reduced impacts of the 27 February 2010 Chile Tsunami, Earthq. Spectra, 28, S199–S213, 2012.
Department of Census and Statistics of Sri Lanka: Census of Popu-lation and Housing 2001, available at: http://www.statistics.gov. lk/PopHouSat/Pop_Chra.asp (last access: 11 July 2014), 2001. Department of Census and Statistics of Sri Lanka: Census of
Per-sons, Housing Units and Other Buildings affected by Tsunami, 26 December 2004, available at: http://www.statistics.gov.lk/ tsunami/ (last access: 11 July 2014), 2004.
Doocy, S., Rofi, A., Moodie, C., Spring, E., Bradley, S., Burnham, G., and Robinson, C.: Tsunami mortality in Aceh Province, In-donesia, B. World Health Organ., 85, 273–278, 2007.
Dwyer, A., Zoppou, C., Nielsen, O., Day, S., and Roberts, S.: Quantifying Social Vulnerability: A methodology for iden-tifying those at risk to natural hazards, Geoscience Aus-tralia Record 2004/14, available at: http://www.ga.gov.au/image_ cache/GA4267.pdf (last access: 15 December 2014), 2004. Eckert, S., Jelinek, R., Zeug, G., and Krausmann, E.: Remote
sensing-based assessment of tsunami vulnerability and risk in Alexandria, Egypt, Appl. Geogr., 32, 714–723, 2012.
Fiscalía Nacional de Chile: Nómina de fallecidos por el tsunami del 27.02.10 (31 de enero de 2011), available at: http://www. fiscaliadechile.cl/Fiscalia/sala_prensa/noticias_det.do?id=125 (last access: 1 August 2014), 2010 (in Spanish).
Fritz, H. M., Petroff, C. M., Catalán, P., Cienfuegos, R., Winck-ler, P., Kalligeris, N., Weiss, R., Barrientos, S. E., Meneses, G., Valderas-Bermejo, C., Ebeling, C., Papadopoulos, A., Contreras, M., Almar, R., Dominguez, J. C., and Synolakis, C. E.: Field survey of the 27 February 2010 Chile Tsunami, Pure Appl. Geo-phys., 168, 1989–2010, 2011.
González-Riancho, P., Aguirre-Ayerbe, I., García-Aguilar, O., Med-ina, R., González, M., Aniel-Quiroga, I., Gutiérrez, O. Q., Álvarez-Gómez, J. A., Larreynaga, J., and Gavidia, F.: Integrated tsunami vulnerability and risk assessment: application to the coastal area of El Salvador, Nat. Hazards Earth Syst. Sci., 14, 1223–1244, doi:10.5194/nhess-14-1223-2014, 2014.
Goseberg, N. and Schlurmann, T.: Tsunami Hazard Mapping and Risk Assessment for the City Of Padang/West Sumatra, Last-Mile-Evacuation Project, Conference: Disaster Risk Reduction for Natural Hazards: Putting Research into Practice, London, available at: http://www.ucl.ac.uk/drrconference/presentations/ TSchlurmann.pdf (last access: 18 March 2014), 2009.
Government of Japan, Cabinet Office, Gender Equality Bu-reau: Disaster Prevention and Reconstruction from a Gen-der Equal Society Perspective – Lessons from the Great East Japan Earthquake, From the “White Paper on Gender Equality 2012”; available at: http://www.gender.go.jp/english_contents/ index.html (last access: 11 July 2014), 2012.
Government of Samoa: TSUNAMI, Samoa, 29 September 2009, available at: http://www.preventionweb.net/files/27077_ tsunamipublication2wfblanks.pdf (last access: 1 August 2014), 2010.