POTENTIAL APPLICATION OF NOVEL HYPERSPECTRAL LIDAR FOR
MONITORING CROPS NITROGEN STRESS
Shuo Shi a,b,c, *, Wei Gong a,b, Lin Du b,d, Jia Sun b, Jian Yang b a
Collaborative Innovation Center of Geospatial Technology, Wuhan, China - shishuo@whu.edu.cn; weigong@whu.edu.cn b
Key Laboratory of Information Engineering in Surveying, Mapping and Remote Sensing, Wuhan University, Wuhan, China - linyufocus@foxmail.com; sunjia@whu.edu.cn; wind_yang@whu.edu.cn
c
School of Resource and Environmental Sciences, Wuhan University, Wuhan, China d
School of Physics and Technology, Wuhan University, Wuhan, China Commission VIII, WG VIII/8
KEY WORDS: LiDAR, Hyperspectral, Nitrogen stress, Crops, Remote sensing
ABSTRACT:
Precision agriculture has always been the research hotspot around the world. And the optimization of nitrogen fertilization for crops is the core concerns. It is not only to improve the productivity of crops but also to avoid the environmental risks caused by over-fertilization. Therefore, accurate estimation of nitrogen status is crucial for determining an nitrogen recommendation. Remote sensing techniques have been widely used to monitor crops for years, and they could offer estimations for stress status diagnosis through obtaining vertical structure parameters and spectral reflectance properties of crops. As an active remote sensing technology, lidar is particularly attractive for 3-dimensional information at a high point density. It has unique edges in obtaining vertical structure parameters of crops. However, capability of spectral reflectance properties is what the current lidar technology lacks because of single wavelength detection. To solve this problem, the concept of novel hyperspectral lidar (HSL), which combines the advantages of hyperspectal reflectance with high 3-dimensional capability of lidar, was proposed in our study. The design of instrument was described in detail. A broadband laser pulse was emitted and reflectance spectrum with 32 channels could be detected. Furthermore, the experiment was carried out by the novel HSL system to testify the potential application for monitoring nitrogen stress. Rice under different levels of nitrogen fertilization in central China were selected as the object of study, and four levels of nitrogen fertilization (N1-N4) were divided. With the detection of novel lidar system, high precision structure parameters of crops could be provided. Meanwhile, spectral reflectance properties in 32 wavebands were also obtained. The high precision structure parameters could be used to evaluate the stress status of crops. And abundant spectral information in 32 wavebands could improve the capacity of lidar system significantly. The results demonstrate that it is more effective for HSL system to distinguish different levels of nitrogen fertilization. Overall, HSL allows for probing not only high precision structure parameters but also spectral reflectance properties of crops. Compared with other approaches, the novel HSL has the potential to provide more comprehensive information of crops which can be assessed remotely in the application of precision agriculture.
* Corresponding author
1. INTRODUCTION
The photosynthesis plays a significant role in the yields of crops production, which is also the key procedure of energy and carbon balance in the ecosystem (Zheng Niu et al., 2015). The effectivity of photosynthesis is greatly related with canopy chlorophyll, nitrogen (N) and water content (Goetz & Prince, 1996; Running, 1990). Since N is a key element in chlorophyll of crops, N shortage will result in non-optimal photosynthesis, which makes the monitoring of N content and management of N fertilizer important for the precision agriculture. Quantity of N fertilizer will influence the N and chlorophyll content in crops. Different level of N stress will bring about different level of field production. So figuring out the relationship between N fertilizer, N content and field production is the research hotspot in the field of remote sensing.
As for the traditional management technologies in agriculture, soil and plant testing methods have been successfully applied in monitoring N content and the N fertilizer effectivity (Liu et al., 2003; Chen et al., 2004, 2006). However these methods are time consuming and sensitive to conditions of laboratory.
During the past decades, the foliar biochemical concentration estimation by hyperspectral remote sensing methods has been developed greatly (Curran & Kupiec, 1995; Peterson & Hubbard, 1991; Howarth & Treitz, 1999; Wessman, 1994), which has become a popular, fast and non-destructive technology to determine N status during the crop growing seasons (Bronson et al., 2003; Gislum et al., 2004; Clay et al., 2006).
The spectrum of crop leaf obtained by hyperspectral remote sensing method is helpful for estimating the status of crops and the determination of drops of N fertilizer in seasons (Raun et al., 2002; Jia et al., 2004). The strong absorption of incident laser will happen because of the chlorophyll in plant in blue and red bands, which determines the reflectance spectral shape in these bands. And the red-edge is also an important feature to estimate the chlorophyll content (Dash and Curran, 2004; Delegido et al., 2010; Gitelson et al., 2005), which can also be derived by analysing the reflectance spectrum obtained by hyperspectral remote sensing method. Hyperspectral remote sensing is a relatively mature way to assess biochemical properties of crops, but there are also many disadvantages, i.e., data redundancy, The International Archives of the Photogrammetry, Remote Sensing and Spatial Information Sciences, Volume XLI-B8, 2016
interference of external light and disability to detect the canopy structure of crops (Dalponte et al., 2013; Schlemmer et al., 2013).
Different from hyperspectral remote sensing technology, LiDAR (Light Detection And Ranging) is one of the active remote sensing method. It has been developed for decades and been applied in some different fields, especially as a novel active remote sensing technology in obtaining the vegetation parameters (Wehr and Lohr, 1999; Kotchenovaet al., 2004; Moorthy et al., 2011). LiDAR can determines the distance from the laser to the target with time of flight of laser pulses. The spatial structure of vegetation can be modelled by these distance information, which can be used to estimate the growing status of vegetation (Harding et al., 2001; Morsdorf et al., 2006). Unfortunately, LiDAR with just single wavelength is lack of spectral properties of the crops, which makes it difficult to assess precisely nitrogen contents than passive hyperspectral remote sensing. Hence, trying to combine these two kinds of remote sensing technologies to obtain spectral and spatial properties at the same time is a research hotspot in the field of remote sensing. Some attempts have been employed and primary results are presented in some studies (Tan and Narayanan, 2004; Koetz et al., 2007; Gong et al., 2012; Chen et al., 2010).
However, there are some limitation to this technology in practical application, such as the laser sources and sensors selection according to the detection goals, the integration of different types of instruments (Nevalainen et al., 2013). These problems have not been solved until a supercontinuum laser source with a spectrum range from about 600 nm to 2000 nm was put forward (Kaasalainen et al. 2007). This laser source generated laser from a nonlinear optical fiber and it has facilitated the idea of a hyperspectral LiDAR (HSL). The existing HSL system has wide emission bands and a multi-channel detector for receiving echo signals, up to 32 multi-channels by now (Du Lin et al., 2016; Wang Li et al., 2016). This HSL system possesses the high 3-dimensional and abundant spectral properties capability, which has been applied in many practical fields. Especially in the vegetation biochemical parameter estimation, it has showed considerable advantages and potential (Hakala et al., 2012; Li et al., 2014; Puttonen et al., 2015; Nevalainen et al., 2014).
In this paper, (1) a novel HSL system with supercontinuum laser source and 32-channel photosensitive detector array was introduced. (2) Rice under different nitrogen fertilization levels was employed by HSL to demonstrate the potential of this novel system in monitoring nitrogen stress of rice.
2. INSTRUMENT AND EXPERIMENT
2.1 Description of the instrument
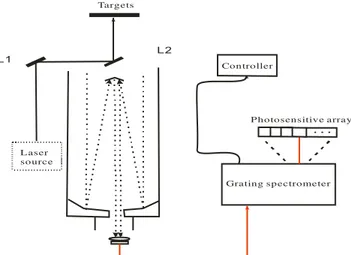
Figure. 1 is the optical diagram of HSL system. The laser emission component of HSL is a wide-band “white” laser with a frequency of 20–40 k Hz and a pulse duration of 1–2 ns. The spot diameter of this laser is about 10 mm and the divergence angle is less than 3 mrad when it is transmitted to the target. A 2-dimension rotation platform is employed to achieve target scanning. Scattering echoes are collected by an achromatic telescope whose focal length and diameter are 400 mm, 200 mm. With collimating and focusing, the echo signals are guided into a grating spectrometer which is used for separating light echoes and then be converted to electrical signal by a
32-channels photosensitive array (with the spectral response being 300–920 nm). The wavelength range of the HSL system is 538-910 nm. More details can be found in the study of Lin Du et al. (Lin et al., 2016).
. . .
Grating spectrometer L aser
source
P hotosensitive array
L1 L2
Controller Targets
Figure 1 The optical diagram of the 32-channel HSL system 2.2 Design of the experiments
The samples are collected from an agricultural production base located in SuiZhou city (113°13 26.52 E, 31°39 0.94 N), Hubei province of China. Rice varieties is Yongyou 4949 which is transplanted into experiment fields cultivated into different fertilized levels. Samples were collected on July 16, 2014 and August 1, 2014.
Spectrum of rice leaf were collected by using HSL system in laboratory. The laser beam perpendicularly illuminate onto the leaf surface with a distance of 4 m. A white reference panel with a size of 10 cm × 10 cm (>99% reflectance, Spectralon, Labsphere, Inc., North Sutton, NH) is first captured to weaken the influence instrument’s dark current. The reflectance factor of each samples is described as
leaf
white panel
R
R
R
_
(1)where Rleaf = leaf radiance at wavelength λ
Rwhite_panel = reference panel radiance at wavelength
λ.
Eitel et al. (Eitel et al., 2014) used a novel dual-wavelength laser system to estimate plant leaf nitrogen content and they found that spectrum with mixed targets such as ground and crops was different. In addition, they pointed that the inverse distance of light could effect the accuracy of the system. Thus, the laser spot in this study resides on the leaf surface completely and a black foam sheet with same thickness as the white reference panel is pasted back to samples to make sure the distance from the target is a constant. Three separate spectra from different position of the leaf surface are measured, and at each position, there are five spectral scans. Thus, fifteen spectra are measured on each leaf sample, which will be averaged as the characteristic spectrum of samples. After doing this, the total nitrogen contents of each sample is measured by a chemical extraction solvent method called Kjeldahl analysis. The values of nitrogen content are ranging from 2.0 mg/g to 3.8 The International Archives of the Photogrammetry, Remote Sensing and Spatial Information Sciences, Volume XLI-B8, 2016
mg/g, and according to nitrogen fertilizer levels we separate these samples into four nitrogen levels, N1 – N4 (listed in Table 1).The rice sample size in this experiment is 120. Each nitrogen level contains 30 samples. Eighty percent of these samples are randomly divided chose the (24 × 4) as training data set and the remaining 24 as a testset.
Nitrogen level Nitrogen content (mg/g)
N1 <2.9
N2 <3.2
N3 <3.6
N4 <3.8
Table 1 Nitrogen content levels measured by Kjeldahl analysis method in this study
3. RESULTS AND DISCUSSION
Reflectance spectra collected by HSL can be used to represent the different status of rice because they are related to properties of chlorophyll absorption to the incident laser. Many researchers pointed that properties of rice reflectance spectra will be different under various nitrogen levels (Broge and Leblanc, 2001; Zhu et al., 2008). The results of this study confirm that this HSL system is credible and accurate. Figure 2 shows the spectra of rice leaf measured using this HSL system. These four spectra are under different nitrogen levels in a increasing order of N1 to N4.
Figure 2 The spectra of rice leaf measured using HSL system and ASD under different nitrogen levels.
The tendency of the reflectance spectrum in figure 2 is consistent with that measured with a spectrometer (Analysis Spectral Devices Inc., Boulder, USA), especially near the red-edge. In the visible band, the reflectance is negatively correlated with nitrogen content, whereas positive in near infrared band.
Using these credible reflectance spectra under different nitrogen levels, this study aims to demonstrate that it has high potential for HSL system to distinguish different levels of nitrogen fertilization. The classification method is support vector machines (SVMs). SVM is a novel intelligent analysis method. It is based on the statistical learning theory of Vapnick (Vapnick, 1998). SVM can work well despite of the limited size and quality of training samples (Foody and Mathur, 2004; Tarabalka et al., 2010).
Channel number
1 2 3 4 5 6 7 8
Central wavelength (nm)
538 550 562 574 586 598 610 622
Channel number
9 10 11 10 13 14 15 16
Central wavelength (nm)
634 646 658 670 682 694 706 718
Channel number
17 18 19 20 21 22 23 24
Central wavelength (nm)
730 742 754 766 778 790 802 814
Channel number
25 26 27 28 29 30 31 32
Central wavelength (nm)
826 838 850 862 874 886 898 910
Table 2 Centre wavelengths of this HSL system. Table 2 is the centre wavelength of the 32-channel HSL system used in this study. By employed a feature weighting ( R. Huang and M. He, 2005), these wavelengths are high nitrogen-sensitive, which can be represent the nitrogen status of the rice leaf samples. Using all of these 32 centre wavelengths to classify different leaf samples, the accuracy can be more than 0.83% (20/24), showed in Figure 3. Concretely, among total 24 validation samples, there are only 4 wrongly classified samples. Three from the N1 and N2 have been distributed into N3, and the one from N3 was labeled with N1. All this results demonstrate that this novel HSL system has high potential in crops monitoring, especially in distinguishing different nitrogen fertilization levels.
Figure 2 The real and classified nitrogen levels by using SVMs. The points located near the diagonal in figure are the correctly
classified nitrogen levels.
In this experiment, fifteen separate scans are made on one leaf samples, which are then averaged as the characteristic spectra of this leaf. This spectra are used to classify different nitrogen levels which are measured in biochemical laboratory called total nitrogen contents. As we all known, nitrogen in plant has various forms, including organic and inorganic nitrogen. Thus, a up-scaling method maybe necessary to determine how many separate scans are needed to descript the total nitrogen with a characteristic spectrum.
Although nitrogen has linked to chlorophyll closely, the reflectance spectrum represents the interaction between the incident laser and chlorophyll after all. Hence, better results could been obtained by using spectra collected with HSL to estimate chlorophyll content first. And then relationship can be founded between nitrogen and chlorophyll content. In this way, capability of HSL in nitrogen content of crops may be improved significantly.
Moreover, a radiative model, such as the PROSPECT (Gastellu-Etchegorry et al., 2001), linked these biochemistry parameters with spectrum may be a good choice to estimate and validate the HSL potential in crops nutrition analysis especially the nitrogen.
4. CONCLUSION
In this study, a novel HSL system has been introduced. This HSL system has a wide-band laser source which make it more accurate and effective in monitoring crops nitrogen stress than the LiDAR used single wavelength. The results demonstrate that the HSL system with 32 channels can distinguish different nitrogen fertilization levels with a accuracy of 83%. Thus, HSL will a high potential active remote sensing method in various of application fields, especially in crops nutrition monitoring.
ACKNOWLEDGEMENTS
This work was supported by National Natural Science Foundation of China (Grant No. 41611130114), Natural Science Foundation of Hubei Province, China(Grant No. 2015CFA002), the Fundamental Research Funds for the Central Universities Grant No. 2042016kf0008 , and the Open Research Fund of State Key Laboratory of Information Engineering in Surveying, Mapping and Remote Sensing (Grant No. 15R01).
REFERENCES
Broge N. H. and E. Leblanc, 2001. Comparing prediction power and stability of broadband and hyperspectral vegetation indices for estimation of green leaf area index and canopy chlorophyll density, Remote sensing of environment, 76, pp. 156-172. Bronson, K.F., Chua, T.T., Booker, J.D., Keeling, J.W., Lascano, R.J., 2003. In season nitrogen status sensing in irrigated cotton. II. Leaf nitrogen and biomass. Soil Sci. Soc. Am. J. 67, 1439–1448.
Chen P., D. Haboudane, N. Tremblay, J. Wang, P. Vigneault, and B. Li, 2010. New spectral indicator assessing the efficiency of crop nitrogen treatment in corn and wheat, Remote Sensing of Environment, 114, pp. 1987-1997.
Chen, X.P., Zhou, J.C., Wang, X.R., Blackmer, A.M., Zhang, F.S., 2004. Optimal rates of nitrogen fertilization for a winter wheat-corn cropping system in northern China. Commun. Soil Sci. Plant Anal. 35, 583–597.
Chen, X.P., Zhang, F.S., Ro¨mheld, V., Horlacher, D., Schulz, R., Bo¨ningZilkens, M., Wang, P., Claupein, W., 2006. Synchronizing N supply from soil and fertilizer and N demand of winter wheat by an improved Nminmethod. Nutr. Cycl. Agroecosys. 74, 91–98.
Clay, D.E., Kim, K.I., Chang, J., Clay, S.A., Dalsted, K., 2006. Characterizing water and nitrogen stress in corn using remote sensing. Agron. J. 98, 579–587.
Curran P J, Kupiec J A, 1995. Imaging spectrometry: a new tool for ecology[M]. John Wiley & Sons: Chichester, UK.
DaMatta F. M., R. A. Loos, E. A. Silva, and M. E. Loureiro, 2002. Limitations to photosynthesis in Coffea canephora as a result of nitrogen and water availability," Journal of Plant Physiology, 159, pp. 975-981.
Delegido J., L. Alonso, G. González, and J. Moreno, 2010. Estimating chlorophyll content of crops from hyperspectral data using a normalized area over reflectance curve (NAOC), International Journal of Applied Earth Observation and Geoinformation, 12, pp. 165-174.
Dalponte M., H. O. Orka, T. Gobakken, D. Gianelle, and E. Næsset, 2013. Tree species classification in boreal forests with hyperspectral data, Geoscience and Remote Sensing, IEEE Transactions on, 51, pp. 2632-2645.
Eitel J. U., T. S. Magney, L. A. Vierling, and G. Dittmar, 2014. Assessment of crop foliar nitrogen using a novel dual-wavelength laser system and implications for conducting laser-based plant physiology, ISPRS Journal of Photogrammetry and Remote Sensing, 97, pp. 229-240.
Gastellu-Etchegorry, J.P., Bruniquel-Pinel, V., 2001. A modeling approach to assess the robustness of spectrometric predictive equations for canopy chemistry. Remote Sens. Environ. 76 (1), pp. 1–15.
Gislum, R., Micklander, E., Nielsen, J.P., 2004. Qualification of nitrogen concentration in perennial ryegrass and red fescue using near-infrared reflectance spectroscopy (NIRS) and chemometrics. Field Crops Res. 88, 269–277.
Gitelson A., A. Vina, V. Ciganda, D. C. Rundquist, and T. J. Arkebauer, 2005. Remote estimation of canopy chlorophyll content in crops, Geophysical Research Letters, 32 (8).
Goetz S J, Prince S D, 1996. Remote sensing of net primary production in boreal forest stands[J]. Agricultural and Forest Meteorology, , 78(3): 149-179.
Hakala T., J. Suomalainen, S. Kaasalainen, and Y. Chen, 2012. Full waveform hyperspectral LiDAR for terrestrial laser scanning, Optics express, 20, pp. 7119-7127.
Harding D., M. Lefsky, G. Parker, and J. Blair, 2001. Laser altimeter canopy height profiles: Methods and validation for closed-canopy, broadleaf forests, Remote Sensing of Environment, vol. 76, pp. 283-297.
Howarth P, Treitz P., 1999. Hyperspectral remote sensing for estimating biophysical parameters of forest ecosystems[J]. Progress in Physical Geography, , 23(3), pp. 359-390.
Jia, L.L., Buerkert, A., Chen, X.P., Ro¨mheld, V., Zhang, F.S., 2004. Low altitude aerial photography for optimum N fertilization of winter wheat on the North China Plain. Field Crops Res. 89, 389–395.
Koetz B., G. Sun, F. Morsdorf, K. J. Ranson, M. Kneubühler, K. Itten, et al., 2007. Fusion of imaging spectrometer and LIDAR The International Archives of the Photogrammetry, Remote Sensing and Spatial Information Sciences, Volume XLI-B8, 2016
data over combined radiative transfer models for forest canopy characterization, Remote Sensing of Environment, vol. 106, pp. 449-459.
Kotchenova S. Y., X. Song, N. V. Shabanov, C. S. Potter, Y. Knyazikhin, and R. B. Myneni, 2004. Lidar remote sensing for modeling gross primary production of deciduous forests," Remote Sensing of Environment, 92, pp. 158-172.
L. Du, G. Wei, S. Shuo, Y. Jian, S. Jia, Z. Bo, et al., 2016. Estimation of rice leaf nitrogen contents based on hyperspectral LIDAR, International Journal of Applied Earth Observation and Geoinformation, vol. 44, pp. 136-143.
Li Fei, B. Mistele, Y. Hu, X. Chen, and U. Schmidhalter, 2014. Reflectance estimation of canopy nitrogen content in winter wheat using optimised hyperspectral spectral indices and partial least squares regression, European Journal of Agronomy, 52, pp. 198-209.
Moorthy I., J. R. Miller, J. A. J. Berni, P. Zarco-Tejada, B. Hu, and J. Chen, 2011. Field characterization of olive (Olea europaea L.) tree crown architecture using terrestrial laser scanning data, Agricultural and Forest Meteorology, 151, pp. 204-214.
Morsdorf F., B. Kötz, E. Meier, K. Itten, and B. Allgöwer, 2006. Estimation of LAI and fractional cover from small footprint airborne laser scanning data based on gap fraction, Remote Sensing of Environment, 104, pp. 50-61.
Nevalainen O., T. Hakala, J. Suomalainen, R. Mäkipää, M. Peltoniemi, A. Krooks, et al., 2014. Fast and nondestructive method for leaf level chlorophyll estimation using hyperspectral LiDAR, Agricultural and Forest Meteorology, 198, pp. 250-258. Nevalainen O., T. Hakala, J. Suomalainen, and S. Kaasalainen, 2013. Nitrogen concentration estimation with hyperspectral LiDAR," ISPRS Annals of Photogrammetry, Remote Sensing and Spatial Information Sciences, vol. II-5/W2, pp. 205-210. Peterson D L, Hubbard G S, 1992. Scientific issues and potential remote-sensing requirements for plant biochemical content[J]. Journal of Imaging Science and Technology, 36 (5), pp. 446-456.
Puttonen E., T. Hakala, O. Nevalainen, S. Kaasalainen, A. Krooks, M. Karjalainen, et al., 2015. Artificial target detection with a hyperspectral LiDAR over 26-h measurement, Optical Engineering, 54, pp. 013105-013105.
Raun, W.R., Solie, J.B., Johnson, G.V., Stone, M.L., Mullen, R.W., Freeman, K.W., Thomason, W.E., Lukina, E.V., 2002. Improving nitrogen use efficiency in cereal grain production with optical sensing and variable rate application. Agron. J. 94, 815–820.
R. Huang and M. He, 2005. Band selection based on feature weighting for classification of hyperspectral data, Geoscience and Remote Sensing Letters, IEEE, pp. 156-159.
Running S W, 1990. Estimating terrestrial primary productivity by combining remote sensing and ecosystem simulation[M] Remote sensing of biosphere functioning. Springer New York, 65-86.
Schlemmer M., A. Gitelson, J. Schepers, R. Ferguson, Y. Peng, J. Shanahan, et al., 2013. Remote estimation of nitrogen and chlorophyll contents in maize at leaf and canopy levels, International Journal of Applied Earth Observation and Geoinformation, 25, pp. 47-54.
S. Kaasalainen, T. Lindroos, and J. Hyyppa, 2007. Toward hyperspectral lidar: measurement of spectral backscatter intensity with a supercontinuum laser source, Geoscience and Remote Sensing Letters, IEEE, 4, pp. 211-215.
Tan S. and R. M. Narayanan, 2004. Design and performance of a multi-wavelength airborne polarimetric lidar for vegetation remote sensing, Applied optics, 43, pp. 2360-2368.
Wehr A. and U. Lohr, 1999. Airborne laser scanning—an introduction and overview, ISPRS Journal of Photogrammetry and Remote Sensing, 54, pp. 68-82.
Wessman C A. 1994. Remote Sensing and the Estimation of Ecosystem Parameters and Functions[M] Imaging Spectrometry
—a Tool for Environmental Observations. Springer Netherlands, 39-56.
W. Gong, S. Shalei, Z. Bo, S. Shuo, L. Faquan, and C. Xuewu, 2012. Multi-wavelength canopy LiDAR for remote sensing of vegetation: Design and system performance, ISPRS Journal of Photogrammetry and Remote Sensing, 69, pp. 1-9, 2012. W. Li, Z. Niu, G. Sun, S. Gao, and M. Wu, 2016. Deriving backscatter reflective factors from 32-channel full-waveform LiDAR data for the estimation of leaf biochemical contents, Optics Express, 24, pp. 4771-4785.
Wulder M. 2001. Optical remote-sensing techniques for the assessment of forest inventory and biophysical parameters[J]. Cadernos De Saúde Pública, 17(3):651-660.
Zhang, J.H., Wang, K., Bailey, J.S., Wang, R.C., 2006. Predicting nitrogen status of rice using multispectral data at canopy scale. Pedosphere 16, 108–117.
Zhu Y., X. Yao, Y. Tian, X. Liu, and W. Cao, 2008. Analysis of common canopy vegetation indices for indicating leaf nitrogen accumulations in wheat and rice, International Journal of Applied Earth Observation and Geoinformation, 10, pp. 1-10. Zheng Niu, Z. Xu, G. Sun, W. Huang, L. Wang, M. Feng, et al., 2015. Design of a New Multispectral Waveform LiDAR Instrument to Monitor Vegetation. IEEE Geoscience and Remote Sensing Letters, 12(7), pp. 1506-1510.