ABSTRACT:The nitrogen use efficiency (NUE) is defined as the capacity of a given genotype in take advantage of the applied nitrogen (N) and transform it in biomass and grains. The objective of this study was to evaluate 12 wheat cultivars as to the NUE and its components. The experiment was conducted in a controlled environment, in a randomized block design with three replications. Twelve wheat cultivars were submitted to four N supply levels (0, 80, 160 and 240 kg of N∙ha–1). The data were submitted to analysis of variance, means multiple comparison, polynomial regression, and path analysis. The nitrogen remobilization efficiency (NRE) was the
SOIL AND PLANT NUTRITION -
Article
Nitrogen use efficiency in modern
wheat cultivars
Matheus Henrique Todeschini, Anderson Simionato Milioli, Diego Maciel Trevizan, Elesandro Bornhofen, Taciane Finatto, Lindolfo Storck, Giovani Benin*
Universidade Tecnológica Federal do Paraná - Pato Branco (PR), Brazil.
*Corresponding author: [email protected]
Received: Aug. 17, 2015 – Accepted: Nov. 21, 2015
main NUE component of the evaluated cultivars, in both low and high conditions of nitrogen fertilization. In the cultivars average, the nitrogen utilization efficiency (NUtE) presented reduction tendency as the N supply was increased, tending to stabilization at the dose of 231 kg of N∙ha–1. The wheat cultivars Mirante, TBIO Itaipu, BRS Parrudo, and TBIO Iguaçu were the most efficient on the N use, and the first two were also efficient in remobilizing the N from the phytomass to the grains.
INTRODUCTION
Nitrogen (N) is the most limiting nutrient for the production of wheat (Pan et al. 2006). Due to this fact and the possible environmental problems related to its use, the Nitrogen use efficiency (NUE) plays a fundamental role in sustainable grain production (Asplund et al. 2014). NUE is given by the ratio between grain yield (GY) and the amount of nutrient provided by the fertilizer (Moll et al. 1982; Cormier et al. 2013; Dai et al. 2013).
The mineral N fertilizer represents a significant cost in wheat production and may cause negative impacts on the environment through leaching and N2O emissions
(Cui et al. 2014). Management practices to help farmers increase productivity and reduce production costs should be studied to ensure agricultural sustainability (Kaneko et al. 2010). In this sense, studies indicate that the development and use of wheat cultivars with higher NUE can contribute to reduce the applied N amounts without decreasing GY (Barraclough et al. 2014; Gaju et al. 2014).
Cultivars that use N more efficiently is one of the main objectives of wheat breeding programs (Sadras and Lemaire 2014). The main components of NUE are N uptake efficiency (NUpE), N utilization efficiency (NUtE), and N remobilization efficiency (NRE) (Le Gouis et al. 2000). The NUpE is the ability of plants to absorb the N available in soil. The NUtE is the relationship between crop yield and total N absorbed by the plant (N in grain + N in phytomass), indicating the GY obtained from each unit of N absorbed by the plant. The NRE is the ability of plants to translocate the N after anthesis from the shoot to the grains. Cultivars with higher NRE tend to accelerate the senescence process and increase N levels in grains (Gaju et al. 2014).
In wheat, the NUE is smaller than 60% (Haile et al. 2012; Hawkesford 2012; Duan et al. 2014). Rahman et al. (2011) indicated values between 28.8 and 40.0 kggrains
per kgNapplied that depended on the genotype and N levels effect, which ranged from 80 to 120 kg N∙ha–1. The
variability of modern cultivars response to NUE has been attributed to NUpE (Sadras and Lemaire 2014), NUtE (Barraclough et al. 2010), and NRE (Kichey et al. 2007; Pask et al. 2012; Guo et al. 2014). The accumulation of phytomass (Giambalvo et al. 2010) and leaf chlorophyll content (Wani et al. 2011; Silva et al. 2014) are traits that
have been linked to NUE and can, therefore, be applied for indirect selection of cultivars that use this nutrient more efficiently.
The first research stations investigating wheat crops date back to 1919 (Caierão et al. 2014) and were responsible for the development of pioneering cultivars, important for the Brazilian wheat. Beche et al. (2014) evaluated several Brazilian cultivars developed from 1940 to 2010 and observed that modern cultivars use N more efficiently and are more tolerant to low N availability compared to pioneer cultivars. In this study, we evaluated modern wheat cultivars regarding NUE and their components to establish the existence of genetic variability, useful for leveraging greater genetic progress in future breeding cycles.
MATERIAL AND METHODS
The experiment was conducted in a greenhouse from May to October 2013.The 12 wheat cultivars used in this study were obtained from different breeding programs and were sown over an extensive area in the 2012 and 2013 harvest years in southern Brazil: BRS Gaivota (Embrapa Trigo – 2012), BRS Gralha Azul (Embrapa Trigo – 2012), BRS Parrudo (Embrapa Trigo – 2013), BRS Tangará (Embrapa Trigo – 2007), CD 150 (Coodetec – 2009), Fcep Cristalino (CCGL Fcep – 2006), Fcep Raízes (CCGL Fcep – 2007), Mirante (OR/Biotrigo Genética – 2009), TBIO Iguaçu (Biotrigo Genética – 2011), TBIO Itaipu (Biotrigo Genética – 2010), TBIO Mestre (Biotrigo Genética – 2013), and Topázio (OR Sementes – 2012).
Four N levels were evaluated: 0 (control), 3.7 (medium supply), 7.5 and 11.3 (higher supply) g N per pot. These levels represent, respectively, 0, 80, 160 and 240 kg N∙ha–1.
The experiment was performed in a factorial (12 cultivars × 3 N levels + control) completely randomized block design with three replications. Each experimental unit consisted of two pots of 20 L (35 × 30 cm) with 30 homogeneous plants each. Table 1 shows soil physicochemical characteristics. The soil pH was corrected with dolomitic limestone (TNRP 85%) to obtain a base saturation value close to 70%. Similarly, the soil was corrected with 60 kg∙ha–1 of potassium and
The N was applied in three phenological stages: I – 1.4 g N per pot at the base for all treatments except control; II – 65% of the remaining N at the start of tillering (Z 22; Zadoks et al. 1974); and III — 35% at the end of tillering (Z 39; Zadoks et al. 1974). Urea (45% N), diluted with water, was the N source. The control of pests and diseases followed the recommendations for wheat crop.
Measurements of a*, b* and a + b* chlorophyll contents were held in Z 6.5 (Zadoks et al. 1974) of each cultivar, using the handheld ClorofiLOG CFL 1030-Falker. The readings were performed on the center of the flag leaf in 20 plants per experimental unit.
At the time of anthesis (Z 60), three plants per experimental unit were randomly collected to determine the N accumulated in the straw. At physiological maturity (Z 90), the other plants were harvested. The grain fractions and phytomass (shoots) were manually separated. The grain mass was measured, and the humidity, standardized to 13% to determine GY. The fractions of phytomass were dried at 40 °C for 48 h and grounded in a Wiley mill. Subsequently, samples of phytomass and kernels were subjected to chemical analysis in order to determine the N concentration following the Kjeldahl method (Tedesco et al. 1995).
Total N in the grains, in phytomass at anthesis an d i n phy s i ol o g i c a l m atu r it y w a s m e a s u re d by multiplying the N concentration (%) of the fraction by the phytomass production. The NUE measurements were calculated according to Moll et al. (1982), Guarda et al. (2004) and Foulkes et al. (2009): NUE (g∙g−1) = GY/NS, where GY is the grain
yield (g) and NS is the N supplied by the fertilizer (g); N Up E ( g ∙ g− 1) = ( N G + N P M ) / N S , w h e re N G
is the amount of N in grains (g) and NPM is the amount of N in phytomass at physiological maturity (g); NUtE (g∙g−1) = GY/(NG + NPM); and
NRE (%) = NPM − (NPM − NG)/Nanthesis, where Nanthesis
is the total NitrogenN at anthesis (g).
The data were tested for normal distribution (Kolmogorov-Smirnov test, p ≤ 0.05; Sprent and Smeeton
2007). Subsequently, the data were submitted to analysis of variance, considering the effects of cultivars, N levels and interaction as fixed. As a measure of experimental precision, selective accuracy was estimated (SA = √1 – 1/Fc), following Resende and Duarte (2007), for the main effects of N and cultivars. The effect of N levels was measured by polynomial regression analysis tested up to cubic degree. Since no significant interaction was observed, the regression analysis was performed for the means of the cultivars, which were compared by Scott-Knott hierarchical clustering algorithm (p = 0.05) in general and within each N level (low and high N supply). Additionally, after checking the multicollinearity between the explanatory variables (Montgomery and Peck 1981), path analysis was carried out (Wright 1921) to identify the direct and indirect effects of the measured traits on GY and NUE. These analyses were performed by the Genes software (Cruz 2013).
RESULTS AND DISCUSSION
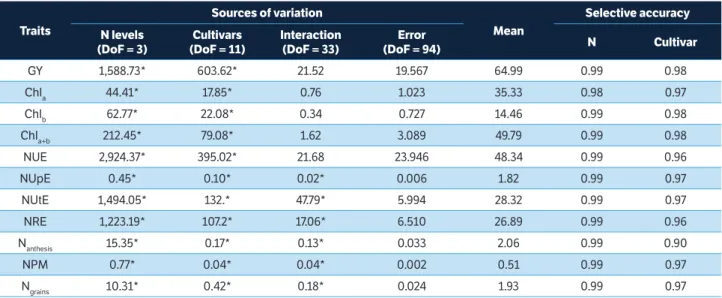
All traits were significant (p < 0.01) for the cultivar effect and N levels (Table 2). The NUpE, NUtE, NRE, Nanthesis, NPM and Ngrains values were also affected by the
cultivar versus N level interaction, indicating differences in the responses of the cultivars to the different N levels. The experimental precision related to the effects of N and cultivar, assessed by the magnitude of SA, is very high (SA > 0.90) according to the criterion established by Resende and Duarte (2007) for all traits. This precision favors the discrimination among cultivars.
To compare the means of the cultivars within the N levels (Table 3), these were grouped into two classes: low (between 0 and 80 kg N∙ha–1) and high (between
160 and 240 kg N∙ha–1) supply. Still, in this table, for
the traits that showed no interaction, the means of cultivars were compared by the average of the four N levels.
Table 1. Chemical analysis results of the soil used in the experiment.
pH = Hydrogen potential; H + Al = Soil acidity potential; Al+3 = Aluminum; Ca+2 = Calcium; Mg+2 = Magnesium; K+ = Potassium; P = Phosphorus; OM = Organic matter; V = Base saturation; M = Aluminum saturation.
pH H + Al Al+3 Ca+2 Mg+2 K+ P OM V M
(CaCl2) (cmolc∙dm–3) (mg∙dm–3) (g∙dm–3) (%)
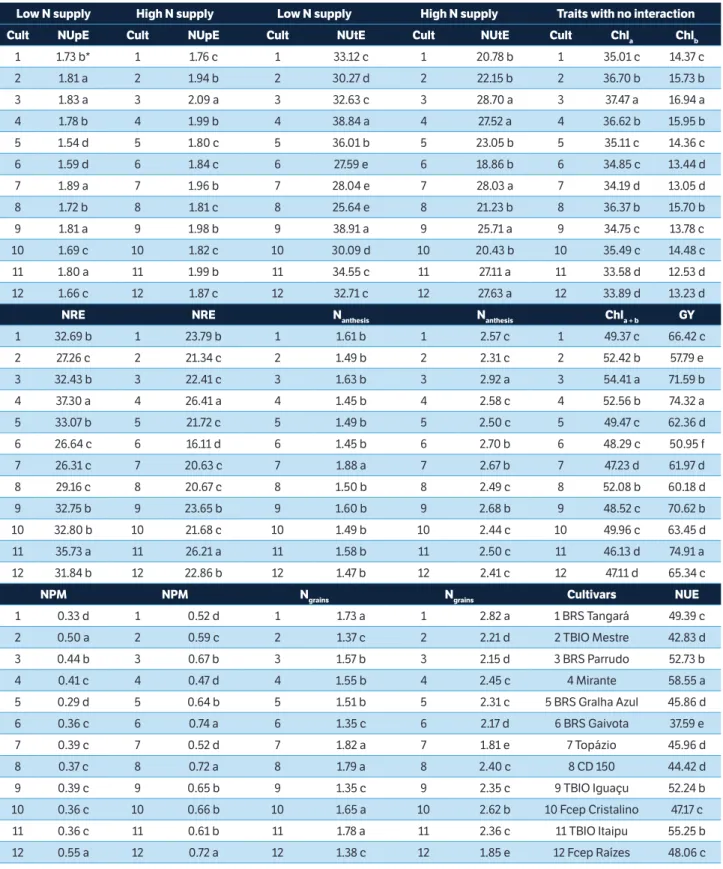
The NUpE, NUtE, NRE, Nanthesis, NPM and Ngrains
values differed among the cultivars for low and high N supply (Table 3), indicating the presence of several mechanisms responsible for the increase in NUE. Five cultivars (Topázio, BRS Parrudo, TBIO Iguaçu, TBIO Mestre, and TBIO Itaipu) were observed in the group with higher NUpE and low N supply. However, under high N supply, only one of these five cultivars (BRS Parrudo) remained in the group with the highest NUpE, showing efficient N uptake in both supply levels. NUpE had low amplitude variation among cultivars (1.54 to 1.89 g∙g–1
for low N supply and 1.76 to 2.09 g∙g–1 for high N supply),
corroborating Haile et al. (2012). NUpE depends on the cultivar ability to recover the N applied. This possibly happened because the investigated cultivars are elite genotypes, with efficient N uptake.
Regarding total N in phytomass at physiological maturity (NPM), only the Fcep Raízes cultivar remained in the best cultivar group for both N supply levels. Under high N supply, the BRS Gaivota and CD 150 are among the best genotypes and under low N supply; they represent intermediate cultivars for the NPM. The behavioral differences of cultivars in low and high N supply are also observed for NUtE, Nanthesis and Ngrains.
Overall, the cultivar BRS Parrudo had the highest NUpE, NUtE and Nanthesis for high N supply and greater NUpE
in low N supply.
NUE was higher for the cultivar Mirante (58.55 g∙g–1),
followed by TBIO Itaipu (55.25 g∙g–1), BRS Parrudo
(52.73 g∙g–1), and TBIO Iguaçu (52.24 g∙g–1), and lower
for the BRS Gaivota (37.59 g∙g–1) (Table 3). The variation
range of chlorophyll a* (Chla: 33.6 to 37.5), b* (Chlb: 12.5
to 16.9) and total a + b* (Chla+b: 46.1 to 54.4) indicated
genetic variability for these traits. The highest chlorophyll levels were observed in BRS Parrudo (Chla: 37.5; Chlb:
16.9; and Chla+b: 54.4). The cultivar Mirante had high
levels of chlorophyll (Chla: 36.6; Chlb: 15.9; and Chla+b:
52.6), the highest GY (74.3 g) and NUE (58.5 g∙g–1).
The NUtE ranged between 25.64 and 38.91 g∙g–1
for low N supply and between 18.86 and 28.70 g∙g–1 for
high N supply. The highest values were observed for the cultivars Mirante and TBIO Iguaçu (low N supply) and cultivars Mirante, TBIO Iguaçu, BRS Parrudo and TBIO Itaipu (high N supply); these cultivars also had high NUE (Table 3).
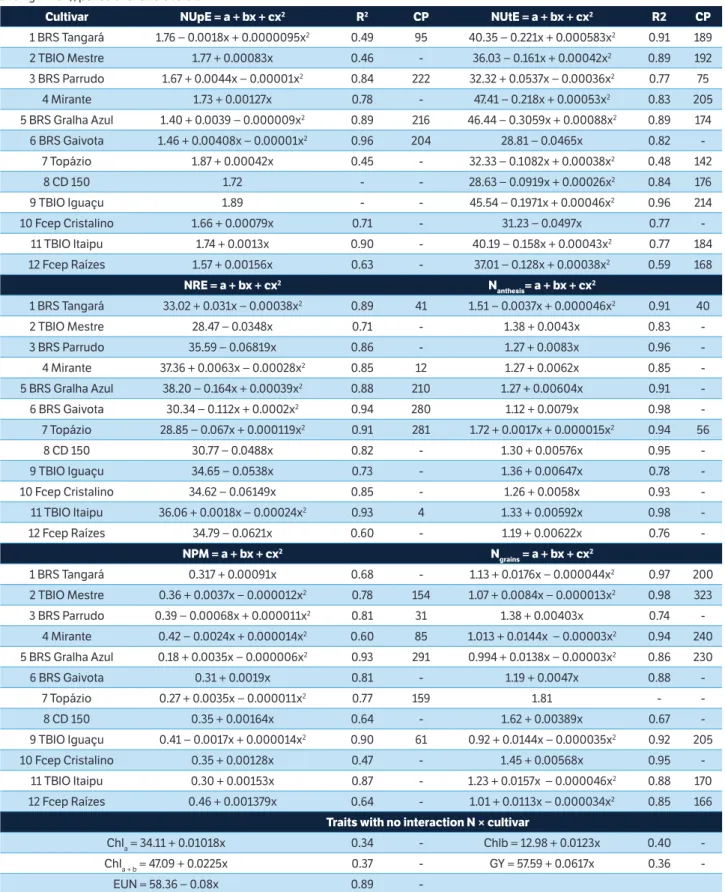
Table 4 shows the variation range of the results based on four N levels, per cultivar (traits with interaction) and overall. The data fitted polynomial regression models since the coefficients of determination (R2) are high for each
cultivar and low for overall. NUpE displayed increasing linear behavior for six cultivars and quadratic for four ones, with a maximum point within the limits studied. The critical point (CP, max) of the NUpE was observed at 222, 216, and 204 kg N∙ha–1 for the cultivars BRS Parrudo,
Traits
Sources of variation
Mean
Selective accuracy
N levels (DoF = 3)
Cultivars (DoF = 11)
Interaction (DoF = 33)
Error
(DoF = 94) N Cultivar
GY 1,588.73* 603.62* 21.52 19.567 64.99 0.99 0.98 Chla 44.41* 17.85* 0.76 1.023 35.33 0.98 0.97
Chlb 62.77* 22.08* 0.34 0.727 14.46 0.99 0.98 Chla+b 212.45* 79.08* 1.62 3.089 49.79 0.99 0.98
NUE 2,924.37* 395.02* 21.68 23.946 48.34 0.99 0.96 NUpE 0.45* 0.10* 0.02* 0.006 1.82 0.99 0.97 NUtE 1,494.05* 132.* 47.79* 5.994 28.32 0.99 0.97 NRE 1,223.19* 107.2* 17.06* 6.510 26.89 0.99 0.96
Nanthesis 15.35* 0.17* 0.13* 0.033 2.06 0.99 0.90
NPM 0.77* 0.04* 0.04* 0.002 0.51 0.99 0.97
Ngrains 10.31* 0.42* 0.18* 0.024 1.93 0.99 0.97
Table 2. Analysis of variance including mean square values of the effects of Nitrogen, cultivars, interaction and experimental error, with respective degrees of freedom, mean and selective accuracy for 11 plant traits of 12 modern wheat cultivars, under different N levels.
Low N supply High N supply Low N supply High N supply Traits with no interaction
Cult NUpE Cult NUpE Cult NUtE Cult NUtE Cult Chla Chlb
1 1.73 b* 1 1.76 c 1 33.12 c 1 20.78 b 1 35.01 c 14.37 c 2 1.81 a 2 1.94 b 2 30.27 d 2 22.15 b 2 36.70 b 15.73 b 3 1.83 a 3 2.09 a 3 32.63 c 3 28.70 a 3 37.47 a 16.94 a 4 1.78 b 4 1.99 b 4 38.84 a 4 27.52 a 4 36.62 b 15.95 b 5 1.54 d 5 1.80 c 5 36.01 b 5 23.05 b 5 35.11 c 14.36 c 6 1.59 d 6 1.84 c 6 27.59 e 6 18.86 b 6 34.85 c 13.44 d 7 1.89 a 7 1.96 b 7 28.04 e 7 28.03 a 7 34.19 d 13.05 d 8 1.72 b 8 1.81 c 8 25.64 e 8 21.23 b 8 36.37 b 15.70 b 9 1.81 a 9 1.98 b 9 38.91 a 9 25.71 a 9 34.75 c 13.78 c 10 1.69 c 10 1.82 c 10 30.09 d 10 20.43 b 10 35.49 c 14.48 c 11 1.80 a 11 1.99 b 11 34.55 c 11 27.11 a 11 33.58 d 12.53 d 12 1.66 c 12 1.87 c 12 32.71 c 12 27.63 a 12 33.89 d 13.23 d
NRE NRE Nanthesis Nanthesis Chla + b GY
1 32.69 b 1 23.79 b 1 1.61 b 1 2.57 c 1 49.37 c 66.42 c 2 27.26 c 2 21.34 c 2 1.49 b 2 2.31 c 2 52.42 b 57.79 e 3 32.43 b 3 22.41 c 3 1.63 b 3 2.92 a 3 54.41 a 71.59 b 4 37.30 a 4 26.41 a 4 1.45 b 4 2.58 c 4 52.56 b 74.32 a 5 33.07 b 5 21.72 c 5 1.49 b 5 2.50 c 5 49.47 c 62.36 d 6 26.64 c 6 16.11 d 6 1.45 b 6 2.70 b 6 48.29 c 50.95 f 7 26.31 c 7 20.63 c 7 1.88 a 7 2.67 b 7 47.23 d 61.97 d 8 29.16 c 8 20.67 c 8 1.50 b 8 2.49 c 8 52.08 b 60.18 d 9 32.75 b 9 23.65 b 9 1.60 b 9 2.68 b 9 48.52 c 70.62 b 10 32.80 b 10 21.68 c 10 1.49 b 10 2.44 c 10 49.96 c 63.45 d 11 35.73 a 11 26.21 a 11 1.58 b 11 2.50 c 11 46.13 d 74.91 a 12 31.84 b 12 22.86 b 12 1.47 b 12 2.41 c 12 47.11 d 65.34 c
NPM NPM Ngrains Ngrains Cultivars NUE
1 0.33 d 1 0.52 d 1 1.73 a 1 2.82 a 1 BRS Tangará 49.39 c 2 0.50 a 2 0.59 c 2 1.37 c 2 2.21 d 2 TBIO Mestre 42.83 d 3 0.44 b 3 0.67 b 3 1.57 b 3 2.15 d 3 BRS Parrudo 52.73 b 4 0.41 c 4 0.47 d 4 1.55 b 4 2.45 c 4 Mirante 58.55 a 5 0.29 d 5 0.64 b 5 1.51 b 5 2.31 c 5 BRS Gralha Azul 45.86 d 6 0.36 c 6 0.74 a 6 1.35 c 6 2.17 d 6 BRS Gaivota 37.59 e 7 0.39 c 7 0.52 d 7 1.82 a 7 1.81 e 7 Topázio 45.96 d 8 0.37 c 8 0.72 a 8 1.79 a 8 2.40 c 8 CD 150 44.42 d 9 0.39 c 9 0.65 b 9 1.35 c 9 2.35 c 9 TBIO Iguaçu 52.24 b 10 0.36 c 10 0.66 b 10 1.65 a 10 2.62 b 10 Fcep Cristalino 47.17 c 11 0.36 c 11 0.61 b 11 1.78 a 11 2.36 c 11 TBIO Itaipu 55.25 b 12 0.55 a 12 0.72 a 12 1.38 c 12 1.85 e 12 Fcep Raízes 48.06 c
Table 3. Means for the traits of 12 modern wheat cultivars submitted to low (0 and 80 kg N∙ha–1) and high (160 and 240 kg N∙ha–1) N supply.
*Means with different letters differ by the Scott-Knott test (p = 0.05). Cult = Cultivars; NUpE = N uptake efficiency – g N in straw and grains per g N supplied (g∙g–1); NUtE = N utilization efficiency – g grains per g N in the straw and grains (g∙g–1); Chl
Cultivar NUpE = a + bx + cx2 R2 CP NUtE = a + bx + cx2 R2 CP 1 BRS Tangará 1.76 − 0.0018x + 0.0000095x2 0.49 95 40.35 − 0.221x + 0.000583x2 0.91 189
2 TBIO Mestre 1.77 + 0.00083x 0.46 - 36.03 − 0.161x + 0.00042x2 0.89 192
3 BRS Parrudo 1.67 + 0.0044x − 0.00001x2 0.84 222 32.32 + 0.0537x − 0.00036x2 0.77 75
4 Mirante 1.73 + 0.00127x 0.78 - 47.41 − 0.218x + 0.00053x2 0.83 205
5 BRS Gralha Azul 1.40 + 0.0039 − 0.000009x2 0.89 216 46.44 − 0.3059x + 0.00088x2 0.89 174
6 BRS Gaivota 1.46 + 0.00408x − 0.00001x2 0.96 204 28.81 − 0.0465x 0.82
-7 Topázio 1.87 + 0.00042x 0.45 - 32.33 − 0.1082x + 0.00038x2 0.48 142
8 CD 150 1.72 - - 28.63 − 0.0919x + 0.00026x2 0.84 176
9 TBIO Iguaçu 1.89 - - 45.54 − 0.1971x + 0.00046x2 0.96 214
10 Fcep Cristalino 1.66 + 0.00079x 0.71 - 31.23 − 0.0497x 0.77 -11 TBIO Itaipu 1.74 + 0.0013x 0.90 - 40.19 − 0.158x + 0.00043x2 0.77 184
12 Fcep Raízes 1.57 + 0.00156x 0.63 - 37.01 − 0.128x + 0.00038x2 0.59 168
NRE = a + bx + cx2 N
anthesis= a + bx + cx 2
1 BRS Tangará 33.02 + 0.031x − 0.00038x2 0.89 41 1.51 − 0.0037x + 0.000046x2 0.91 40
2 TBIO Mestre 28.47 − 0.0348x 0.71 - 1.38 + 0.0043x 0.83 -3 BRS Parrudo 35.59 − 0.06819x 0.86 - 1.27 + 0.0083x 0.96 -4 Mirante 37.36 + 0.0063x − 0.00028x2 0.85 12 1.27 + 0.0062x 0.85
-5 BRS Gralha Azul 38.20 − 0.164x + 0.00039x2 0.88 210 1.27 + 0.00604x 0.91
-6 BRS Gaivota 30.34 − 0.112x + 0.0002x2 0.94 280 1.12 + 0.0079x 0.98
-7 Topázio 28.85 − 0.067x + 0.000119x2 0.91 281 1.72 + 0.0017x + 0.000015x2 0.94 56
8 CD 150 30.77 − 0.0488x 0.82 - 1.30 + 0.00576x 0.95 -9 TBIO Iguaçu 34.65 − 0.0538x 0.73 - 1.36 + 0.00647x 0.78 -10 Fcep Cristalino 34.62 − 0.06149x 0.85 - 1.26 + 0.0058x 0.93 -11 TBIO Itaipu 36.06 + 0.0018x − 0.00024x2 0.93 4 1.33 + 0.00592x 0.98
-12 Fcep Raízes 34.79 − 0.0621x 0.60 - 1.19 + 0.00622x 0.76
-NPM = a + bx + cx2 N
grains = a + bx + cx 2
1 BRS Tangará 0.317 + 0.00091x 0.68 - 1.13 + 0.0176x − 0.000044x2 0.97 200
2 TBIO Mestre 0.36 + 0.0037x − 0.000012x2 0.78 154 1.07 + 0.0084x − 0.000013x2 0.98 323
3 BRS Parrudo 0.39 − 0.00068x + 0.000011x2 0.81 31 1.38 + 0.00403x 0.74
-4 Mirante 0.42 − 0.0024x + 0.000014x2 0.60 85 1.013 + 0.0144x − 0.00003x2 0.94 240
5 BRS Gralha Azul 0.18 + 0.0035x − 0.000006x2 0.93 291 0.994 + 0.0138x − 0.00003x2 0.86 230
6 BRS Gaivota 0.31 + 0.0019x 0.81 - 1.19 + 0.0047x 0.88 -7 Topázio 0.27 + 0.0035x − 0.000011x2 0.77 159 1.81 -
-8 CD 150 0.35 + 0.00164x 0.64 - 1.62 + 0.00389x 0.67 -9 TBIO Iguaçu 0.41 − 0.0017x + 0.000014x2 0.90 61 0.92 + 0.0144x − 0.000035x2 0.92 205
10 Fcep Cristalino 0.35 + 0.00128x 0.47 - 1.45 + 0.00568x 0.95 -11 TBIO Itaipu 0.30 + 0.00153x 0.87 - 1.23 + 0.0157x − 0.000046x2 0.88 170
12 Fcep Raízes 0.46 + 0.001379x 0.64 - 1.01 + 0.0113x − 0.000034x2 0.85 166
Traits with no interaction N × cultivar
Chla = 34.11 + 0.01018x 0.34 - Chlb = 12.98 + 0.0123x 0.40
-Chla + b = 47.09 + 0.0225x 0.37 - GY = 57.59 + 0.0617x 0.36
-EUN = 58.36 − 0.08x 0.89
-Table 4. Polynomial regression analysis for 11 plant traits of 12 modern wheat cultivars submitted to four Nitrogen levels (x, between 0 and 240 kg N∙ha–1), per cultivar and overall.
NUpE = N uptake efficiency – g N in straw and grains per g N supplied (g∙g–1); CP = Critical point (maximum or minimum); NUtE = N utilization efficiency – g grains per g N in the straw and grains (g∙g–1); NRE = N remobilization efficiency (%); N
BRS Gralha Azul and BRS Gaivota, respectively. The NUpE decreased with increasing N supply for the cultivar BRS Tangará, while CD 150 and TBIO Iguaçu did not change. Guarda et al. (2004) and Asplund et al. (2014) also reported increasing NUpE for increasing N supply levels.
The NUtE decreased linearly for the cultivars BRS Gaivota and Fcep Cristalino. Also, it showed quadratic response with minimum point (at the levels indicated in the table) for BRS Tangará, TBIO Mestre, Mirante, BRS Gralha Azul, Topázio, CD 150, TBIO Iguaçu, TBIO Itaipu and Fcep Raízes and maximum point (N = 75 kg N∙ha–1) for BRS Parrudo. The
means of the cultivars showed a tendency to reduce the NUtE as the N supply level increased, stabilizing at 231 kg N∙ha–1
(minimum CP). The differential behavior of cultivars with different N supply levels, regarding the NUtE, is important when defining the management and choosing the cultivar.
The NRE displayed a decreasing linear behavior for six cultivars and quadratic responses for the others. Maximum CPs were obtained for lower N supply for the cultivars BRS Tangará (41 kg N∙ha–1), Mirante
(12 kg N∙ha–1) and TBIO Itaipu (4 kg N∙ha–1). Furthermore,
maximum CP was observed close to the highest N supply for the cultivars BRS Gralha Azul, BRS Gaivota and Topázio. The high N levels caused the Nanthesis to increase, and the
cultivars were unable to remobilize the N at the same rate when N supply was high compared to low supply. Barbottin et al. (2005) and Kichey et al. (2007) also reported that the NRE depends on the N level, and the highest remobilization rates occurred for lower N supply.
The Nanthesis is the main source of N to the grains (Gaju
et al. 2014). The highest protein concentrations in the grain are related to the higher remobilization of post-anthesis N (Barraclough et al. 2014; Bogard et al. 2010). According to Kichey et al. (2007), much of the N found in grains comes from the remobilization of N stored in the shoots and roots of the plant before anthesis. It is noteworthy that, as the N supply increases, most cultivars respond positively, demonstrating an average Nanthesis increase of 0.0063% per kg
of N applied. NPM and Ngrains also responded positively to
an increasing N supply. For Ngrains, the means of the cultivars
showed a quadratic response, with CP of 224 kg N∙ha–1 (data
not shown).
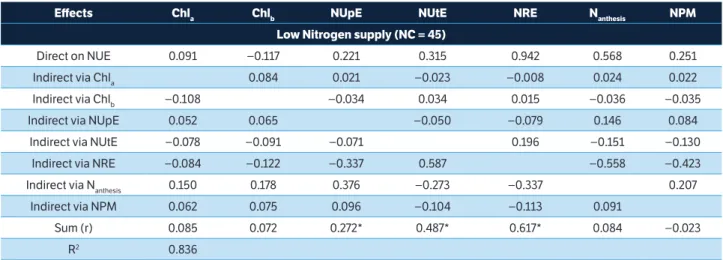
The direct and indirect effects of the seven traits on the NUE (Table 5) and GY (Table 6) were examinated by path analysis. It was observed a direct effect (DE) with sign and magnitude similar to the correlation coefficient (r) of the NRE over the NUE under low (DE = 0.94, r = 0.617) and high (DE = 0.65, r = 0.721) N supply, corroborating the studies of Barraclough et al. (2014), Guo et al. (2014) and Le Gouis et al. (2000). Although NUtE has been associated with the NUE (r = 0.487 and r = 0.516), this was mainly due to indirect effects (IE) of NRE (IE = 0.587) under low N supply. This result indicates that, for a group of modern cultivars, using the available N is linked to the ability of the cultivars to remobilize the nutrient toward the grains. In addition, under low N supply, the Nanthesis affected directly the NUE (DE = 0.568) due to the
DE of NREs with opposite sign canceling the correlation. This DE was not observed for high N supply (DE = 0.006).
Effects Chla Chlb NUpE NUtE NRE Nanthesis NPM
Low Nitrogen supply (NC = 45)
Direct on NUE 0.091 −0.117 0.221 0.315 0.942 0.568 0.251 Indirect via Chla 0.084 0.021 −0.023 −0.008 0.024 0.022 Indirect via Chlb −0.108 −0.034 0.034 0.015 −0.036 −0.035
Indirect via NUpE 0.052 0.065 −0.050 −0.079 0.146 0.084 Indirect via NUtE −0.078 −0.091 −0.071 0.196 −0.151 −0.130 Indirect via NRE −0.084 −0.122 −0.337 0.587 −0.558 −0.423 Indirect via Nanthesis 0.150 0.178 0.376 −0.273 −0.337 0.207
Indirect via NPM 0.062 0.075 0.096 −0.104 −0.113 0.091
Sum (r) 0.085 0.072 0.272* 0.487* 0.617* 0.084 −0.023 R2 0.836
Table 5. Direct and indirect effects of chlorophyll a, chlorophyll b, Nitrogen uptake efficiency, Nitrogen utilization efficiency, Nitrogen remobilization efficiency, total Nitrogen at anthesis and total Nitrogen at physiological maturity traits on Nitrogen use efficiency for low (0 and 80 kg N∙ha–1) and high (160 and 240 kg N∙ha–1) Nitrogen supply, Pearson correlation coefficient (r) and model coefficient of
determination (R2).
Effects Chla Chlb NUpE NUtE NRE Nanthesis NPM High Nitrogen supply (NC = 19)
Direct on NUE −0.183 0.205 0.027 0.155 0.654 0.006 0.023 Indirect via Chla −0.159 −0.040 0.006 0.002 −0.019 −0.003
Indirect via Chlb 0.178 0.040 −0.007 −0.003 0.031 0.016 Indirect via NUpE 0.006 0.005 0.010 −0.003 0.012 0.000 Indirect via NUtE −0.005 −0.005 0.057 0.086 −0.011 −0.070
Indirect via NRE −0.007 −0.008 −0.072 0.362 −0.411 −0.327 Indirect via Nanthesis 0.001 0.001 0.003 0.000 −0.004 0.001
Indirect via NPM 0.000 0.002 0.000 −0.010 −0.011 0.005
Sum (r) −0.011 0.041 0.015 0.516* 0.721* −0.387* −0.360* R2 0.551
Table 5. Continuation...
*Correlation (r) significant by t-test (p < 0.05); Chla = Chlorophyll a (Falker Index); Chlb = Chlorophyll b (Falker Index); NUpE = N uptake efficiency; NUtE = N utilization efficiency; NRE = N remobilization efficiency (%); Nanthesis = Total N at anthesis (%); NPM = Total N at physiological maturity (%); NUE = N use efficiency; NC = Number of condition (collinearity).
*Correlation (r) significant by t-test (p < 0.05). NUE = N use efficiency; Chla = Chlorophyll a (Falker Index); Chlb = Chlorophyll b (Falker Index); NUpE = N uptake efficiency; NUtE = N utilization efficiency; NRE = N remobilization efficiency (%); Nanthesis = Total N at anthesis (%); NPM = Total N at physiological maturity (%); GY = Grain yield; NC = Number of condition (collinearity).
Table 6. Direct and indirect effects of chlorophyll a, chlorophyll b, Nitrogen uptake efficiency, Nitrogen utilization efficiency, Nitrogen remobilization efficiency, total Nitrogen at anthesis and total Nitrogen at physiological maturity traits on grain yield for low (0 and 80 kg N∙ha–1)
and high (160 and 240 kg N∙ha–1) Nitrogen supply, Pearson correlation coefficient (r) and model coefficient of determination (R2).
Effects Chla Chlb NUpE NUtE NRE Nanthesis NMP
Low Nitrogen supply (NC = 45)
Direct on GY −0.052 0.084 0.051 −0.038 1.058 0.987 0.309 Indirect via Chla −0.048 −0.012 0.013 0.005 −0.014 −0.013
Indirect via Chlb 0.078 0.025 −0.024 −0.011 0.026 0.025 Indirect via NUpE 0.012 0.015 −0.012 −0.018 0.034 0.020 Indirect via NUtE 0.009 0.011 0.009 −0.024 0.018 0.016 Indirect via NRE −0.095 −0.137 −0.378 0.659 −0.627 −0.475 Indirect via Nanthesis 0.260 0.308 0.653 −0.474 −0.585 0.360
Indirect via NPM 0.076 0.092 0.118 −0.128 −0.139 0.113
Sum (r) 0.290* 0.326* 0.465* −0.004 0.286* 0.538* 0.241* R2 0.945
High Nitrogen supply (NC = 19)
Direct on GY −0.001 −0.028 0.093 0.052 1.321 0.930 0.381 Indirect via Chla −0.001 0.000 0.000 0.000 0.000 0.000 Indirect via Chlb −0.024 −0.006 0.001 0.000 −0.004 −0.002 Indirect via NUpE 0.020 0.018 0.034 −0.010 0.043 0.000
Indirect via NUtE −0.002 −0.002 0.019 0.029 −0.004 −0.024 Indirect via NRE −0.014 −0.017 −0.145 0.731 −0.831 −0.661 Indirect via Nanthesis 0.096 0.141 0.433 −0.065 −0.585 0.189
Indirect via NPM 0.007 0.030 −0.001 −0.172 −0.191 0.077
This is explained by the linear increase of Nanthesis in most cultivars, with increasing N levels (Table 4); thus, high N supply results in high amount of Nanthesis, and the RNE is presented as a measure of the highest association with NUE (DE = 0.654) (Table 5).
The association between Nanthesis and GY results from the DE on the GY, under low (DE = 0.987) and high (DE = 0.930) N supply (Table 6). Accordingly, under low N supply, it is possible to select cultivars with greater NUE from the indirect selection on NRE or Nanthesis. Under high N supply, N saturation probably occurs, and the NUE is then explained by the cultivars’ ability to remobilize N from the straw to the grains, resulting in a higher grain quality and higher GY. Under low N supply, Beche et al. (2014) observed high DE of the NRE on GY while, under high N supply, they observed higher effect of NUtE and NUpE. This divergence in results might be explained by the different set of cultivars used in that study, characterized by pioneering and modern cultivars, whereas, in this study, we used only modern cultivars.
The Chla, Chlb, and Chla + b parameters are dependent
on the cultivar (Table 3) and the N level applied (Table 4). However, the results in Tables 5 e 6 showed no important IE and DE on the NUE and GY. For low N supply, the correlation of GY with Chla and Chlb is significant due to the IE of the
Nanthesis. Thus, in this study, the evaluation of Chla, Chlb and
Chla + b was important to estimate the NUE.
CONCLUSION
The efficient use of Nitrogen by the evaluated cultivars resulted especially from the highly efficient way these cultivars were able to remobilize the absorbed Nitrogen to grain production. It is possible to select wheat cultivars with increased Nitrogen use efficiency from the indirect selection on Nitrogen remobilization efficiency or total Nitrogen at flowering. The Mirante, TBIO Itaipu, BRS Parrudo, and TBIO Iguaçu wheat cultivars are the most efficient in Nitrogen use, and the first two are the most efficient in Nitrogen remobilization.
REFERENCES
Asplund, L., Bergkvist, G. and Weih, M. (2014). Proof of concept:
nitrogen use efficiency of contrasting spring wheat varieties grown
in greenhouse and field. Plant Soil, 374, 829-842. http://dx.doi. org/10.1007/s11104-013-1895-6.
Barbottin, A., Lecomte, C., Bouchard, C. and Jeuffroy, M. H. (2005).
Nitrogen remobilization during grain filling in wheat: genotypic and
environmental effects. Crop Science Society of America, 45,
1141-1150. http://dx.doi.org/10.2135/cropsci2003.0361.
Barraclough, P. B., Howarth, J. R., Jones, J., Lopez-Bellido, R.,
Parmar, S., Shepherd, C. E. and Hawkesford, M. J. (2010). Nitrogen
efficiency of wheat: genotypic and environmental variation and
prospects for improvement. European Journal of Agronomy, 33,
1-11. http://dx.doi.org/10.1016/j.eja.2010.01.005.
Barraclough, P. B., Lopez-Bellido, R. and Hawkesford, M. J. (2014).
Genotypic variation in the uptake, partitioning and remobilization
of nitrogen during grain-filling in wheat. Field Crops Research. 156,
242-248. http://dx.doi.org/10.1016/j.fcr.2013.10.004.
Beche, E., Benin, G., Bornhofen, E., Dalló, S. C., Sassi, L. H. and
Oliveira, R. (2014). Eficiência de uso de Nitrogênio em cultivares
de trigo pioneiras e modernas. Pesquisa Agropecuária Brasileira,
49, 948-957. http://dx.doi.org/10.1590/S0100-04X2014001200005.
Bogard, M., Allard, V., Brancourt-Hulmel, M., Heumez, E., Machet, J.
M., Jeuffroy, M. H., Gate, P., Martre, P. and Le Gouis, J. (2010). Deviation
from the grain protein concentration-grain yield negative relationship is
highly correlated to postanthesis N uptake in winter wheat. Journal of
Experimental Botany, 61, 4303-4312. http://dx.doi.org/10.1093/jxb/erq238.
Caierão, E., Scheeren, P. L., Silva, M. S. and Castro, R. L. (2014).
History of wheat cultivars released by Embrapa in forty years of
research. Crop Breeding and Applied Biotechnology, 14, 216-223.
http://dx.doi.org/10.1590/1984-70332014v14n4a34.
Cormier, F., Faure, S., Dubreuil, P., Heumez, E., Beauchêne, K.,
Lafarge, S., Praud, A. and Le Gouis, J. (2013). A multi-environmental
study of recent breeding progress on nitrogen use efficiency in
wheat (Triticum aestivum L.). Theoretical and Applied Genetics,
126, 3035-3048. http://dx.doi.org/10.1007/s00122-013-2191-9.
Cruz, C. D. (2013). GENES — a software package for analysis in
experimental statistics and quantitative genetics. Acta Scientiarum.
Agronomy, 35, 271-276. http://dx.doi.org/10.4025/actasciagron.v35i3.21251.
Cui, Z., Wang, G., Yue, S., Wu, L., Zhang, F. and Chen, X. (2014).
Closing the N-use efficiency gap to achieve food and environmental
security. Environmental Science and Technology, 48, 5780-5787.
Dai, X., Zhou, X., Jia, D., Xiao, L., Kong, H. and He, M. (2013).
Managing the seeding rate to improve nitrogen-use efficiency of
winter wheat. Field Crops Research, 154, 100-109. http://dx.doi. org/10.1016/j.fcr.2013.07.024.
Duan, Y., Shi, X., Li, S., Sun, X. and He, X. (2014). Nitrogen use
efficiency as affected by phosphorus and potassium in long-term
rice and wheat experiments. Journal of Integrative Agriculture, 13,
588-596. http://dx.doi.org/10.1016/S2095-3119(13)60716-9.
Foulkes, M. J., Hawkesford, M. J., Barraclough, P. B., Holdsworth,
M. J., Kerr, S., Kightley, S. and Shewry, P. R. (2009). Identifying traits
to improve the nitrogen economy of wheat: recent advances and
future prospects. Field Crops Research, 114, 329-342. http://dx.doi. org/10.1016/j.fcr.2009.09.005.
Gaju, O., Allard, V., Martre, P., Le Gouis, J., Moreau, D., Bogard, M.,
Hubbart, S. and Foulkes, M. J. (2014). Nitrogen partitioning and
remobilization in relation to leaf senescence, grain yield and grain
nitrogen concentration in wheat cultivars. Field Crops Research,
155, 213-223. http://dx.doi.org/10.1016/j.fcr.2013.09.003.
Giambalvo, D., Ruisi, P., Miceli, G. D., Frenda, A. S. and Amato, G.
(2010). Nitrogen use efficiency and nitrogen fertilizer recovery of
durum wheat genotypes as affected by interspecific competition.
Agronomy Journal, 102, 707-715. http://dx.doi.org/10.2134/ agronj2009.0380.
Guarda, G., Padovan, S. and Delogu, G. (2004). Grain yield,
nitrogen-use efficiency and baking quality of old and modern Italian
bread-wheat cultivars grown at different nitrogen levels. European Journal
of Agronomy, 21, 181-192. http://dx.doi.org/10.1016/j.eja.2003.08.001.
Guo, Z., Zhang, Y., Zhao, J., Shi, Y. and Yu, Z. (2014). Nitrogen
use by winter wheat and changes in soil nitrate nitrogen levels
with supplemental irrigation based on measurement of moisture
content in various soil layers. Field Crops Research, 164, 117-125.
http://dx.doi.org/10.1016/j.fcr.2014.05.016.
Haile, D., Nigussie, D. and Ayana, A. (2012). Nitrogen use efficiency
of bread wheat: effects of nitrogen rate and time of application.
Journal of Soil Science and Plant Nutrition, 12, 389-409. http:// dx.doi.org/10.4067/S0718-95162012005000002.
Hawkesford, M. J. (2012). The diversity of nitrogen use efficiency
for wheat varieties and the potential for crop improvement. Better
Crops, 96, 10-12.
Kaneko, F. H., Arf, O., Gitti, D. D. C., Arf, M. V., Chioderoli, C. A. and
Kappes, C. (2010). Manejo do solo e do Nitrogênio em milho
cultivado em espaçamentos reduzido e tradicional. Bragantia, 69,
677-686. http://dx.doi.org/10.1590/S0006-87052010000300020.
Kichey, T., Hirel, B., Heumez, E., Dubois, F. and Le Gouis, J. (2007).
In winter wheat (Triticum aestivumL.), post-anthesis nitrogen
uptake and remobilization to the grain correlates with agronomic
traits and nitrogen physiological markers. Field Crops Research,
102, 22-32. http://dx.doi.org/10.1016/j.fcr.2007.01.002.
Le Gouis, J., Beghin, D., Heumez, E. and Pluchard, P. (2000). Genetic
differences for nitrogen uptake and nitrogen utilization efficiencies
in winter wheat. European Journal of Agronomy, 12, 163-173. http:// dx.doi.org/10.1016/S1161-0301(00)00045-9.
Moll, R. H., Kamprath, E. J. and Jackson, W. A. (1982). Analysis and
interpretation of factors which contribute to efficiency of nitrogen
utilization. Agronomy Journal, 74, 562-564. http://dx.doi.org/10.2134/ agronj1982.00021962007400030037x.
Montgomery, D. C. and Peck, E. A. (1981). Introduction to linear
regression analysis. New York: John Wiley.
Pan, J., Zhu, Y., Jiang, D., Dai, T., Li, Y. and Cao, W. (2006). Modeling
plant nitrogen uptake and grain nitrogen accumulation in wheat.
Field Crops Research, 97, 322-336. http://dx.doi.org/10.1016/j. fcr.2005.11.006.
Pask, A. J. D., Sylvester-Bradley, R., Jamieson, P. D. and Foulkes,
M. J. (2012). Quantifying how winter wheat crops accumulate and
use nitrogen reserves during growth. Field Crops Research, 126,
104-118. http://dx.doi.org/10.1016/j.fcr.2011.09.021.
Rahman, M. A., Sarker, A. Z., Amin, M. F., Jahan, H. S. and Akhter,
M. M. (2011). Yield response and nitrogen use efficiency of wheat
under different doses and split application of nitrogen fertilizer.
Bangladesh Journal of Agricultural Research, 36, 231-240. http:// dx.doi.org/10.3329/bjar.v36i2.9249.
Resende, M. D. V. and Duarte, J. B. (2007). Precisão e controle de
qualidade em experimentos de avaliação de cultivares. Pesquisa
Agropecuária Tropical, 37, 182-194.
Sadras, V. O. and Lemaire, G. (2014). Quantifying crop nitrogen
status for comparisons of agronomic practices and genotypes.
Field Crops Research, 164, 54-64. http://dx.doi.org/10.1016/j. fcr.2014.05.006.
Silva, C. L., Benin, G., Bornhofen, E., Beche, E., Todeschini, M. H.
and Milioli, A. S. (2014). Nitrogen use efficiency is associated with
chlorophyll content in Brazilian spring wheat. Australian Journal
Sprent, P. and Smeeton, N. C. (2007). Applied nonparametric
statistical methods. 4. ed. Boca Raton: Chapman & Hall.
Tedesco, M. J., Gianello, C., Bissani, C. A., Bohnen, H. and Volkweiss,
S. J. (1995). Análise de solo, plantas e outros materiais, 2. ed. Porto
Alegre: UFRGS.
Wani, B. A., Ram, M., Yasin, A. and Singh, E. (2011). Physiological
traits in integration with yield and yield components in wheat
(Triticum aestivum L.) Study of their genetic variability and correlation.
Asian Journal of Agricultural Research, 5, 194-200. http://dx.doi. org/10.3923/ajar.2011.194.200.
Wright, S. (1921). Correlation and causation. Journal of Agricultural
Research, 20, 557-585.
Zadoks, J. C., Chang, T. T. and Konzac, C. F. (1974). A decimal code