Large Cohorts of Never Smokers: The Smoke Scales
Maria Misailidi1,2,3, Manolis N. Tzatzarakis4, Mathaios P. Kavvalakis4, Yiannis Koutedakis2,5, Aristidis M. Tsatsakis4, Andreas D. Flouris1*
1FAME Laboratory, Centre for Research and Technology Hellas, Trikala, Greece,2Department of Exercise Sciences, University of Thessaly, Trikala, Greece,3Regional Directorate of Primary and Secondary Education of Western Greece, Patras, Greece,4Centre of Toxicology Science and Research, Medical School, University of Crete, Iraklio, Greece,5School of Sports, Performing Arts and Leisure, University of Wolverhampton, Walsall, United Kingdom
Abstract
The objectives of this study were to: (i) to develop questionnaires that can identify never-smoking children and adults experiencing increased exposure to secondhand smoke (SHS+), (ii) to determine their validity against hair nicotine, and (iii)
assess their reliability. A sample of 191 children (85 males; 106 females; 7–18 years) and 95 adult (23 males; 72 females; 18– 62 years) never-smokers consented to hair nicotine analysis and answered a large number of questions assessing all sources of SHS. A randomly-selected 30% answered the questions again after 20–30 days. Prevalence of SHS+in children and adults
was 0.5260.07 and 0.6760.10, respectively (p,0.05). The Smoke Scale for Children (SS-C) and the Smoke Scale for Adults (SS-A) were developed via factor analysis and included nine questions each. Positivity criteria for SS-C and SS-A via receiver operating characteristics curve analysis were identified at .16.5 and .16, respectively. Significant Kappa agreement (p,0.05) was confirmed when comparing the SS-C and SS-A to hair nicotine concentration. Reliability analyses demonstrated that the SS-C and SS-A scores obtained on two different days are highly correlated (p,0.001) and not significantly different (p.0.05). Area under the curve and McNemar’s Chi-square showed no pair-wise differences in sensitivity and specificity at the cutoff point between the two different days for SS-C and SS-A (p.0.05). We conclude that the SS-C and the SS-A represent valid, reliable, practical, and inexpensive instruments to identify children and adult never-smokers exposed to increased SHS. Future research should aim to further increase the validity of the two questionnaires.
Citation:Misailidi M, Tzatzarakis MN, Kavvalakis MP, Koutedakis Y, Tsatsakis AM, et al. (2014) Instruments to Assess Secondhand Smoke Exposure in Large Cohorts of Never Smokers: The Smoke Scales. PLoS ONE 9(1): e85809. doi:10.1371/journal.pone.0085809
Editor:Keitaro Matsuo, Kyushu University Faculty of Medical Science, Japan ReceivedJuly 12, 2013;AcceptedDecember 3, 2013;PublishedJanuary 21, 2014
Copyright:ß2014 Misailidi et al. This is an open-access article distributed under the terms of the Creative Commons Attribution License, which permits unrestricted use, distribution, and reproduction in any medium, provided the original author and source are credited.
Funding:These authors have no support or funding to report.
Competing Interests:The authors have declared that no competing interests exist. * E-mail: [email protected]
Introduction
Despite a multitude of anti-smoking campaigns being active worldwide, the number of smokers is currently larger than at any other time in human history [1,2]. As a consequence, secondhand smoke (SHS) remains a major threat to public health [1,3] due to its adverse health effects in both children [4,5] and adults [2,6]. While it was previously believed that only daily SHS exposure for years (e.g., living with a smoker) can influence health, recent evidence has shown that even brief SHS exposures can contribute to disease pathogenesis [7–9]. Thus, it is now unanimously acknowledged that there is no safe level of exposure to SHS [10,11].
An essential first step towards minimizing the health effects of SHS is to accurately assess the exposure level of individuals [12]. To date, this has been accomplished primarily through question-naires [13–15], and to a lesser extent by measuring biomarkers (e.g., nicotine) in body fluids [16–18] and secondary measurement [19,20]. The popularity of questionnaires stems from their practicality and low cost, especially when testing large cohorts [12,21]. Despite these advantages, most of the existing question-naires aiming to assess SHS exposure have not been validated against a referenced standard [12]. For those questionnaires that have undergone validation, the reference standard adopted was
Methods
Ethics Statement
The study was conducted according to the principles expressed in the Declaration of Helsinki and was approved by the University of Thessaly Ethics Review Board (protocol no. 201) as well as the Regional Directorate of Primary and Secondary Education of Western Greece.
Participants
Particular attention was given during the recruitment proce-dures to ensure that the participants represented socioeconomic, ethnic, and urban or rural groups of never-smokers as they occur in the Greek population. Specifically, measurements were conducted in the city of Patras (214,000 inhabitants; Greece’s 3rdlargest urban area) and the surrounding areas. The locations selected for data collection represented equally urban and rural areas, as well as a variety of socioeconomic and ethnic groups as they exist in Greece. Children participants were recruited at four elementary and two high schools located in Patras and in its surrounding areas. All 280 students of these schools were invited to participate in the study, and 191 children (106 females; 85 males; age range 7–18 years) agreed. Adult participants were recruited at the city center, as well as at suburban and rural areas surrounding the city. A total of 130 adults were invited to participate, and 95 of them (72 females; 23 males; age range 18–62 years) agreed. Written informed consent was obtained from all 286 volunteers (i.e., 191 children and 95 adults) and their parents (for children) after full oral and written explanation of the experimental procedures. The only exclusion criterion adopted in the study was current or previous smoking.
Collection Period and SHS-related Legislation
We used a relatively short data collection period to eliminate the effect of altering seasons on SHS exposure characteristics. All data were collected during February and March 2010. In Greece, this represents the end of the winter period, when people still spend a major part of their time indoors as environmental temperatures remain relatively low. The SHS-related legislation in Greece at the time the data was collected was quite lenient and largely ineffective offering only partial protection (i.e., non-smoking areas) to nonsmokers in public settings. At the same period, Australia, Canada, Ireland, New Zealand, Singapore, South Africa, UK, and USA had a total smoking ban in all workplaces and public places. In Finland, France, Italy, Latvia, Malta, Sweden, Slovenia, and The Netherlands, smoking in public places was allowed only in separate smoking rooms. The other EU countries (including Greece) offered a partial protection to nonsmokers in public settings [42] while no SHS-related legislation was actively enforced in the remaining countries in the world. Therefore, the SHS exposure conditions for nonsmokers in Greece at the time the data were collected represents very effectively those conditions faced by the vast majority of nonsmokers across the world.
Experimental Protocol
The data were collected in two stages. During the first stage, participants completed the questionnaires which included a total of 51 questions for children and 67 questions for adults pertaining to all relevant sources of SHS exposure (i.e., home, occupational, social, and transportation; children’s questionnaires did not include occupational exposure questions) and gave a sample of hair from the back of their head as previously described [35]. During the second stage (i.e., 20–30 days following stage 1), a randomly-selected 30% of the participants completed the
ques-tionnaires again to assess reliability and the two quesques-tionnaires for each of these participants were randomly termed forms 1 and 2. All measurements were conducted at approximately the same time of the day and by the same trained investigators. For the completion of the questionnaires, a researcher read each question clearly and provided explanations to ensure that the participants understood what was requested. Thereafter, the participants selected one of the possible answers according to what they felt was true for them. The same procedure was followed for all questions, and no time limits were set for completing the questionnaires.
SHS Questionnaires
The questionnaires that were initially developed for children and adults included a total of 48 and 64 questions, respectively, pertaining to all relevant sources of SHS exposure (i.e., SHS exposure at the home, workplace, public areas, and in the car), and contained both objective (e.g., how many members of your family smoke?) and subjective (e.g., how much do you think you are exposed to tobacco smoke at home?) questions. This approach was adopted to ensure that the questionnaires would capture both the time that someone spends with smokers (an objective proxy of SHS exposure) as well as his/her perceived exposure to SHS (a subjective proxy of SHS exposure) since individuals subjected to SHS for years may underestimate their exposure [32,43]. The questions for each source of SHS (SHS exposure at the home, workplace, public areas, and in the car) are outlined in the Online Data Supplement (File S1).
Hair Nicotine Analysis
A sample of hair 100–150 mg from the root at the back of the participants’ head was obtained as previously described [35]. Each hair sample was placed in a separate envelope and kept in a dry room at 22–25uC. When all hair samples were collected, they were washed to remove any external contamination and digested for 90 min at 60uC in 2 ml of 1 M NaOH. Hair samples extracted mechanically twice with 3 ml dichloromethane and the organic phases were separated, combined and evaporated to dryness. Analysis was performed using a liquid chromatography-mass spectrometry (Shimadzu LCMS–2010 EV) system equipped with an APCI interface. The column was a Discovery C18 HPLC column (25 cm64.6 mm, 5mm). Thirty ml from each extracted
sample were entered in the column at temperature 45uC. A gradient of 50 mM ammonium acetate, pH = 5.1, (solvent A) and an acetonitrile (solvent B) were selected for routine use. The detection was done in SIM mode using ion fragments with m/z 163, 204 for nicotine and m/z 177, 218 for cotinine.
Statistical Analysis
the variables and, hence, the suitability for structure detection (p,0.05 values suggest that the factor analysis results are useful). An eigenvalue.1 was used as ana prioricriterion to determine the number of factors to be extracted from the data. Generally, factor loadings of r$0.7 and r#0.4 are considered high and low, respectively [44,45]. In the factor analysis for children we excluded items that loaded with r,0.6 on any factor. In the factor analysis for adults we excluded items that loaded with r,0.7 on any factor since a large part of the variance was explained with factors of high loading (see Results section). For both analyses, items with weak loadings (i.e., r,0.4) and items that were highly correlated (indicating item redundancy) were discarded.
The aim of the second data analysis was to determine the validity of the children and adult questionnaires (short version) towards identifying individuals that experience increased SHS against hair nicotine. Two Receiver Operating Characteristics (ROC) curve analyses (one for children and one for adults) were applied to define cutoff points for the two short-version questionnaires using hair nicotine concentration as a reference standard. For this purpose, a positive diagnosis of high SHS exposure (SHS+) was assigned when hair nicotine was.0.87 and
.0.42 ng/mg in children and adults, respectively, based on data collected from 31 countries [46]. The area under the ROC curve was estimated using the Delong non-parametric method [21,47]. Calculated sensitivity and specificity with corresponding 95% confidence intervals (CI95%) were used to determine cutoff points that would allow a correct diagnosis for SHS+. Sensitivity was defined as the proportion of individuals diagnosed as SHS+using the ROC results who demonstrated hair nicotine concentrations above the international health standards. Specificity was defined as the proportion of individuals diagnosed as disease free (i.e., SHS-) using the ROC results who demonstrated hair nicotine concen-trations below the international health standards. Cohen’s Kappa statistic was used to evaluate the agreement between questionnaire diagnosis and the reference standard test (i.e., hair nicotine concentration).
The aim of the third data analysis was to assess the reliability of the children and adult short-version questionnaires using data from the randomly-selected 30% of the participants who completed them twice (20–30 days apart). For this purpose, the two questionnaires for each of these participants were randomly termed forms 1 and 2. As previously suggested [48,49], reliability was assessed using correlation coefficients (Kendall’s Tau-b) and Wilcoxon signed ranks tests followed by 95% limits of agreement and percent coefficient of variation to quantify the amount of test-retest error. Finally, ROC curves were calculated using data from forms 1 and 2. Pair-wise differences in sensitivity and specificity at the cutoff point between forms 1 and 2 in SS-C and SS-A were examined with McNemar’s Chi-square method [50] for matched, potentially correlated dichotomous (binary) tests. Pair-wise differ-ences in the area under the ROC curve between forms 1 and 2 in SS-C and SS-A were examined with the non-parametric method developed by Zhou et al. [51]. Data were analyzed with SPSS (version 19, SPSS Inc., Chicago, Illinois) and NCSS 2007 (Number Cruncher Statistical Systems, Utah, USA) statistical software packages. The level of significance was set at p,0.05.
Results
Questionnaire Development (Analysis 1)
In children, the required factoring criteria were satisfied (KMO = 0.71; Bartlett’s testx2= 3553; p,0.001). Factor analysis of the initial 51 questions suggested that 3 factors explained 76% of the variance (factor loadings from each item appear in Table 1).
The factors could also be seen as three subscales, with two items related to home SHS exposure (31% of variance), five items related to general SHS exposure (26% of variance), and two items related to social SHS exposure (19% of variance), as shown in Table 1. The final scale (short version of questionnaire) was termed Smoke Scale for Children (SS-C) and contained 9 items (see Table 1). The obtainable score range for the SS-C was 0–50.4, with higher numbers reflecting higher SHS exposure.
In adults, the required factoring criteria were satisfied (KMO = 0.67; Bartlett’s testx2= 2829; p,0.001). Factor analysis of the initial 67 questions suggested that 3 factors explained 71% of the variance (factor loadings from each item appear in Table 1). The factors could also be seen as three subscales, with five items related to social SHS exposure (32% of variance), three items related to occupational SHS exposure (24% of variance), and one item related to home SHS exposure (15% of variance), as shown in Table 1. The final scale (short version of questionnaire) was termed Smoke Scale for Adults (SS-A) and contained nine items (see Table 1). The obtainable score range for the SS-A was 0–49.8, with higher numbers reflecting higher SHS exposure.
Validity Assessment (Analysis 2)
The results for hair nicotine and the prevalence rates for SHS+
and SHS- in children and adult never-smokers appear in Table 2. Using the hair nicotine results, chi-square demonstrated that the prevalence of SHS+ in children (52.167.1%) was significantly lower than in adults (67.169.8%) (x2= 5.47, p = 0.019). ROC curve analyses revealed that the most appropriate cutoffs for SHS+
in SS-C and SS-A were ‘‘16.5’’ and ‘‘16’’, respectively. Relevant univariate statistics and ROC curve analyses for the designated cutoffs appear in Table 3 and Figure 1:A and B. Hair nicotine analysis suggested that 99 children and 59 adults were SHS+. The SS-C and the SS-A diagnosed 73 children and 38 adults as SHS+, respectively. Cohen’s Kappa statistic demonstrated significant agreement with the hair nicotine measurement for both the SS-C (z = 5.22, p,0.001) and the SS-A (z = 2.961, p = 0.003).
Reliability Assessment (Analysis 3)
The reliability results in children are presented in Table 4 and Figure 1:C. The SS-C scores of forms 1 and 2 were highly correlated (tau-b = 0.90, p,0.001), and a Wilcoxon signed ranks test demonstrated no statistically significant differences between them [z =21.85, p = 0.07]. The 95% limits of agreement indicated that a score of 20 on one day can be as high as 23 or as low as 18.84 on another day. The calculated ROC curves in SS-C demonstrated similar results at the cutoff of 16.5. Specifically, comparisons of sensitivities and specificities for each form with McNemar’s chi square test for binary tests and matched data demonstrated no statistically significant differences (p.0.05). Pair-wise comparison in the area under the ROC curve between forms 1 and 2 demonstrated no statistically significant differences (z =21.4, p = 0.16).
1 and 2 demonstrated no statistically significant differences (z =20.45, p = 0.652).
Discussion
Since hair nicotine concentration can provide an accurate assessment of SHS exposure for the preceding three months in both children and adults [34–39], our goal was to develop questionnaires able to identify children and adult never-smokers that experience increased SHS as well as to determine their validity and reliability against hair nicotine. To construct the questionnaires, we asked a series of 51 and 67 questions in children and adults, respectively, pertaining to all relevant sources of SHS
exposure (i.e., SHS exposure at the home, workplace, public areas, and in the car) and including both objective (e.g., how many members of your family smoke?) and subjective (e.g., how much do you think you are exposed to tobacco smoke at home?) questions. We adopted this approach to ensure that the questionnaires would capture both the time that someone spends with smokers (an objective proxy of SHS exposure) as well as his/her perceived exposure to SHS (a subjective proxy of SHS exposure) since individuals subjected to SHS for years may underestimate their exposure [32,43]. Factor analysis was used, thereafter, to examine possible factor structures and identify specific questions to create short versions of the questionnaires reflecting the main sources of SHS exposure. We adopted this methodology instead of conduct-ing factor analyses only on the items that were moderately/highly correlated with hair nicotine concentration because, based on relevant guidelines [45], our goal was to reduce the data while retaining as much of the original measures’ total variance as possible. The value of this approach was confirmed when we attempted to construct brief questionnaires by selecting items that were believed to provide accurate SHS+ diagnosis. For instance, an attempt to use the visual analogue scale items pertaining to the perceived exposure to SHS at home, the workplace, and when socializing resulted reduced sensitivity in children and no significant agreement with hair nicotine in adults. In this light, the resulting SS-C and SS-A questionnaires are the first to accurately reflect the true exposure of an individual to SHS, and not just that occurring during the past few days.
Our factor analysis demonstrated that social SHS exposure is most prevalent in children, followed closely by home SHS exposure. Indeed, the resulting Smoke Scale for Children (SS-C) included six questions pertaining to social SHS exposure (explaining,40% of the variance) and three questions pertaining
to home SHS exposure (explaining,36% of the variance). These
Table 1.Factor loadings for the Smoke Scale in children and adults.
CHILDREN ADULTS
Item Question Factors Item Question Factors
1 2 3 1 2 3
1 How much do you think you are exposed to tobacco smoke at home? (VAS)
20.63 0.62 1 How many times per week do you usually go out to socialize?
0.89
2 How many members of your family smoke inside your home?
20.60 0.63 2 When you go out to bars, how many hours do you usually stay?
0.75
3 How much do you think you are exposed to tobacco smoke when you go out to socialize? (Likert)
0.80 3 How many times per week do you usually go out to coffee shops?
0.74
4 How many times per week do you usually go out to socialize?
0.68 4 When you go out to coffee shops, how many hours do you usually stay?
0.74
5 How much do you think you are exposed to tobacco smoke at home? (Likert)
0.67 5 How many times per week do you usually go out to bars?
0.74
6 When you go out to coffee shops, how many hours do you usually stay?
0.62 6 How many cigarettes does each of your smoker co-workers usually smoke at work per day?
0.78
7 How many times per week do you usually go out to bars?
20.61 7 How much do you think you are exposed to tobacco smoke at work? (VAS)
0.77
8 How many people smoke inside the bars you usually go to?
20.60 8 At work, how many hours per day do you usually spend with smoker co-workers?
0.70
9 How many people smoke inside the taverns/restaurants you usually go to?
0.60 9 How much do you think you are exposed to tobacco smoke at home? (Likert)
0.74
Note: VAS = 10 cm visual analogue scale; Likert = 5-level likert scale (not at all, somewhat, moderately, a lot, extremely). doi:10.1371/journal.pone.0085809.t001
Table 2.Results (median6interquartile range) for hair nicotine and prevalence rates (695% confidence interval) for SHS+and SHS- in children and adult never-smokers.
Hair nicotine
(ng/mg) SHS+ SHS–
Children Sample 0.9262.69 0.5260.07{ 0.4860.07{
Boys 0.9363.19 0.5260.11 0.4860.11 Girls 0.9062.20 0.5260.09 0.4860.09 Adults Sample 0.7761.70 0.6760.10*{ 0.3360.10*{
Men 1.2063.11 0.7060.20* 0.3060.20* Women 0.7461.66 0.6660.11* 0.3460.11* Note: * =x2significant difference (p,0.05) between SHS+and SHS–.
{=
x2significant difference (p,0.05) between children and adults. Key: SHS+= positive diagnosis of SHS exposure using the forms; SHS– = negative diagnosis of SHS exposure using the forms.
results are in line with the results of the Global Youth Tobacco Survey [52] conducted in 151 countries and territories during 2000–2007 which showed that 42.5% of never smokers were exposed to SHS at home and 55.1% were exposed in public places. These results together with the SHS exposure conditions for nonsmokers in Greece at the time the data were collected (as described above) confirm that our sample is representative of the vast majority of children never-smokers across the world.
Factor analysis of the initial 67 questions in adults revealed that social SHS exposure is most prevalent in this subgroup, followed by occupational and home SHS exposure. The resulting Smoke Scale for Adults (SS-A) included five questions pertaining to social exposure (explaining 32% of the variance), three questions pertaining to occupational SHS exposure (explaining 24% of the variance), and one question pertaining to home SHS exposure (explaining 15% of the variance). These results are in reasonable agreement with the results of the Global Adults Tobacco Survey
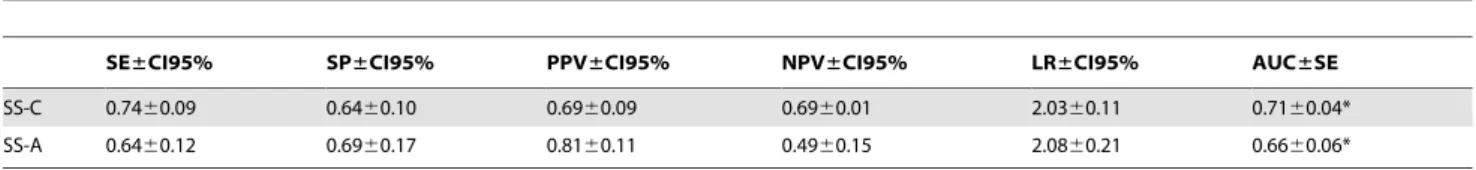
Table 3.Results for ROC curve and McNemar Chi-Square analyses for the designated cutoffs for SHS+in SS-C and SS-A.
SE±CI95% SP±CI95% PPV±CI95% NPV±CI95% LR±CI95% AUC±SE
SS-C 0.7460.09 0.6460.10 0.6960.09 0.6960.01 2.0360.11 0.7160.04*
SS-A 0.6460.12 0.6960.17 0.8160.11 0.4960.15 2.0860.21 0.6660.06*
Note: * = AUC test statistically significant (p,0.05) from 0.5 (i.e., no diagnostic ability).
Key: ROC = receiver operating characteristics; SE = sensitivity; SP = specificity; PPV = positive predicted value; NPV = negative predicted value; LR = likelihood ratio; AUC = area under the ROC curve; CI95% = 95% confidence interval; SE = standard error.
doi:10.1371/journal.pone.0085809.t003
[53] conducted in 17 countries since 2007 which has shown that 45.2% of never smokers are exposed to SHS in public places, 44.5% are exposed to SHS at home, and 37.7% are exposed in the workplace. Thus, it is reasonable to assume that our sample is representative of the vast majority of adult never-smokers across the world.
The English versions of the SS-C and the SS-A, their scoring manuals, and the adopted translation methodology have been included as Online Data Supplements (Files S1, S2, and S3). The total score of all questions in each questionnaire was used to establish positivity criteria for children and adults using hair nicotine concentration as a reference standard and international exposure limits (i.e., .0.87 and .0.42 ng/mg hair nicotine in children and adults, respectively) of,2500 nonsmoking children
and adults in 31 countries [46] for a positive diagnosis of high SHS exposure (SHS+). While adopting different cutoffs would have affected the validity of SS-C and SS-A, we selected these cutoffs as they were proposed by the most wide-spread study to be published during the past decade. The optimal cutoff point in establishing each positivity criterion was determined by selecting a score that retained a low frequency of both, false-positive and false-negative, rates. This conservative approach is considered appropriate since SHS+is a serious health threat but it does not require immediate medical attention. Further, this approach in selecting positivity criteria limits both needless lifestyle modifications as a form of intervention positive) and harmful SHS exposure (false-negative) for an individual that would have, otherwise, benefited from an early SHS+diagnosis.
The ROC curve analyses demonstrated that children and adults reporting SS-C and SS-A scores above 16.5 and 16, respectively, are considered to have a high probability for SHS+and should be referred to a health specialist for further testing. The validity results for SS-C and SS-A demonstrated high sensitivity and specificity as well as significant agreement with hair nicotine concentration. Furthermore, both forms showed adequate reli-ability. Despite capturing some individuals with high scores for reasons other than SHS, the SS-C and SS-A appear to identify the majority of SHS+individuals demonstrating significant agreement with the reference standard hair nicotine concentration. According to the sensitivity and specificity obtained, in a hypothetical population of 2000 equally distributed children and adults, the SS-C and SS-A would identify correctly 385/520 and 429/670 individuals, respectively. Therefore, more than 2 out of 3 children and adults who are exposed to SHS above safety limits can be detected simply by answering a set of nine questions. Moreover, hair nicotine analysis would be required to confirm a diagnosis of SHS+ in 809 individuals of the total 2000. As the total cost of screening such a large population using hair nicotine would reach
a minimum ofJ46,000 [54], the use of the SS-C and SS-A would
reduce the total cost for SHS+screening by 60%.
The SS-C and SS-A have been standardized against hair nicotine, a biomarker that has shown an improved capacity to discriminate SHS exposure status compared to urinary cotinine [34,55]. While the validity of hair nicotine to detect levels of chronic SHS exposure has been repeatedly demonstrated in both children and adults [32–39], it is important to note that this method does not allow for the determination of nicotine sources; that is, nicotine directly deposited on the hair from the environment and nicotine incorporated in the hair through SHS. Hair treatment methods such as preliminary washing (adopted in the current study) can remove the majority of the nicotine deposited on the hair exterior. However, some residual nicotine remains, causing external contamination [56]. In our study, we feel that this external contamination was minimal, since all our subjects were never-smokers.
Future research should aim to further increase the validity of the SS-C and, primarily, the SS-A. It is important to note that 27% of the children and 36% of the adults with SHS+will not be detected using the SS-C and SS-A, respectively. This limits the degree to which intervention programs would be made available to these individuals. However, hair nicotine analysis is neither practical nor cost-effective. It requires trained staff, specialized equipment, and cost approximately J23 per sample [54]. Furthermore, since
testing can be conducted only on an individual basis, it is not possible to conduct mass screenings over short time periods. As a result, individuals and/or organizations often object to time consuming screenings due to interference with daily routines. Hence, it seems reasonable to assume that screening procedures are not available to the majority of the populations around the world due to financial and logistic reasons. The SS-C and SS-A allow for mass screenings that can be conducted in very short periods of time with a minimum budget. Therefore, despite the missed screening of a small number of individuals, the majority of SHS+children and adults, who would otherwise escape screening, receive referral to a health specialist. Based on the evidence presented herein, we conclude that the SS-C and the SS-A represent valid, reliable, practical, and inexpensive instruments to identify children and adult never-smokers exposed increased SHS.
Supporting Information
File S1 Online Data Supplement.A supplement containing the questions for each source of SHS (SHS exposure at the home, workplace, public areas, and in the car), the adopted translation methodology, as well as the scoring manuals for the SS-C and the SS-A.
(DOCX)
Table 4.Reliability results for SS-C and SS-A.
Form Median±IR 95% LoA %CV SE±CI95% SP±CI95% PPV±CI95% NPV±CI95% AUC±SE
SS-C 1 17.90610.80 0.962.08 5.23 0.7960.15 0.4860.20 0.7060.15 0.5960.22 0.6760.08*
2 18.8069.30 0.8160.16 0.5760.22 0.7560.14 0.6760.20 0.6960.08*
SS-A 1 18.73611.72 0.862.78 7.94 0.5460.27 0.6460.28 0.6460.28 0.5460.27 0.6260.12*
2 17.60611.55 0.4660.27 0.6460.28 0.6060.30 0.5060.26 0.6360.12*
Note: * = AUC test statistically significant (p,0.05) from 0.5 (i.e., no diagnostic ability).
Key: IR = interquartile range; 95%LoA = 95% limits of agreement; %CV = percent coefficient of variation; SE = sensitivity; SP = specificity; PPV = positive predicted value; NPV = negative predicted value; LR = likelihood ratio; AUC = area under the ROC curve; CI95% = 95% confidence interval; SE = standard error.
File S2 Smoke Scale for Children Questionnaire. The English version of the SS-C questionnaire.
(DOCX)
File S3 Smoke Scale for Adults Questionnaire. The English version of the SS-A questionnaire.
(DOCX)
Author Contributions
Conceived and designed the experiments: MM MNT YK AMT ADF. Performed the experiments: MM MNT MPK ADF. Analyzed the data: MM MNT MPK ADF. Contributed reagents/materials/analysis tools: MNT YK AMT ADF. Wrote the paper: MM MNT YK AMT ADF.
References
1. O¨ berg M, Woodward A, Jaakkola MS, Peruga A, Pru¨ss-Ustu¨n A (2010) Global estimate of the burden of disease from second-hand smoke. Geneva, Switzerland: World Health Organisation.
2. Flouris AD (2009) Acute health effects of passive smoking. Inflamm Allergy Drug Targets 8: 319–320.
3. Dinas PC, Koutedakis Y, Flouris AD (2011) Effects of active and passive tobacco cigarette smoking on heart rate variability. Int J Cardiol.
4. Flouris AD, Faught BE, Klentrou P (2008) Cardiovascular disease risk in adolescent smokers: evidence of a ‘smoker lifestyle’. J Child Health Care 12: 217–227.
5. Metsios GS, Flouris AD, Koutedakis Y (2009) Passive smoking, asthma and allergy in children. Inflamm Allergy Drug Targets 8.
6. Faught BE, Flouris AD, Cairney J (2009) Epidemiological evidence associating secondhand smoke exposure with cardiovascular disease. Inflamm Allergy Drug Targets 8.
7. Flouris AD, Metsios GS, Carrillo AE, Jamurtas AZ, Gourgoulianis K, et al. (2009) Acute and short-term effects of secondhand smoke on lung function and cytokine production. Am J Respir Crit Care Med 179: 1029–1033. 8. Flouris AD, Metsios GS, Jamurtas AZ, Koutedakis Y (2010) Cardiorespiratory
and immune response to physical activity following exposure to a typical smoking environment. Heart 96: 860–864.
9. Flouris AD, Metsios GS, Carrillo AE, Jamurtas AZ, Stivaktakis PD, et al. (2012) Respiratory and immune response to maximal physical exertion following exposure to secondhand smoke in healthy adults. PLoS One 7: e31880. 10. World Health Organisation (2011) Report on the global tobacco epidemic:
warning about the dangers of tobacco.: World Health Organisation. 11. Flouris AD, Vardavas CI, Metsios GS, Tsatsakis AM, Koutedakis Y (2010)
Biological evidence for the acute health effects of secondhand smoke exposure. Am J Physiol Lung Cell Mol Physiol 298: L3–L12.
12. Misailidi M, Flouris AD (2012) Long-term exposure to environmental tobacco smoke: assessment and contributing factors. Arch Hell Med 29: 174–186. 13. Eisner MD, Balmes J, Katz PP, Trupin L, Yelin EH, et al. (2005) Lifetime
environmental tobacco smoke exposure and the risk of chronic obstructive pulmonary disease. Environ Health 4: 7.
14. Pitsavos C, Panagiotakos DB, Chrysohoou C, Skoumas J, Tzioumis K, et al. (2002) Association between exposure to environmental tobacco smoke and the development of acute coronary syndromes: the CARDIO2000 case-control study. Tob Control 11: 220–225.
15. Jaakkola MS, Jaakkola JJ (1997) Assessment of exposure to environmental tobacco smoke. Eur Respir J 10: 2384–2397.
16. U.S. Environmental Protection Agency (1992) Respiratory Health Effects of Passive Smoking: Lung Cancer and Other Disorders. Washington, DC: Report of the U.S Environmental Protection Agency, 1992 EPA/600/6-90/006F, Monograph 4; 44, 270, 232.
17. Jarvis MJ, Russell MA, Benowitz NL, Feyerabend C (1988) Elimination of cotinine from body fluids: implications for noninvasive measurement of tobacco smoke exposure. Am J Public Health 78: 696–698.
18. Bernert JT, Jr., McGuffey JE, Morrison MA, Pirkle JL (2000) Comparison of serum and salivary cotinine measurements by a sensitive high-performance liquid chromatography-tandem mass spectrometry method as an indicator of exposure to tobacco smoke among smokers and nonsmokers. J Anal Toxicol 24: 333–339.
19. Eisner MD, Katz PP, Yelin EH, Hammond SK, Blanc PD (2001) Measurement of environmental tobacco smoke exposure among adults with asthma. Environ Health Perspect 109: 809–814.
20. O’Connor TZ, Holford TR, Leaderer BP, Hammond SK, Bracken MB (1995) Measurement of exposure to environmental tobacco smoke in pregnant women. Am J Epidemiol 142: 1315–1321.
21. Flouris AD, Bouziotas C, Christodoulos AD, Koutedakis Y (2008) Longitudinal preventive-screening cutoffs for metabolic syndrome in adolescents. Int J Obes (Lond) 32: 1506–1512.
22. Emmons KM, Abrams DB, Marshall R, Marcus BH, Kane M, et al. (1994) An evaluation of the relationship between self-report and biochemical measures of environmental tobacco smoke exposure. Prev Med 23: 35–39.
23. Boyd NR, Windsor RA, Perkins LL, Lowe JB (1998) Quality of measurement of smoking status by self-report and saliva cotinine among pregnant women. Matern Child Health J 2: 77–83.
24. Sandhu S, Humphris G, Whitley S, Cardozo A, Sandhu A (2004) Smoking habits in patient’s who have been treated for an oral cancer: validation of self-report using saliva cotinine. Oral Oncol 40: 576–578.
25. Olivieri M, Poli A, Zuccaro P, Ferrari M, Lampronti G, et al. (2002) Tobacco smoke exposure and serum cotinine in a random sample of adults living in Verona, Italy. Arch Environ Health 57: 355–359.
26. Caraballo RS, Giovino GA, Pechacek TF, Mowery PD (2001) Factors associated with discrepancies between self-reports on cigarette smoking and measured serum cotinine levels among persons aged 17 years or older: Third National Health and Nutrition Examination Survey, 1988–1994. Am J Epidemiol 153: 807–814.
27. Nondahl DM, Cruickshanks KJ, Schubert CR (2005) A questionnaire for assessing environmental tobacco smoke exposure. Environ Res 97: 76–82. 28. Callais F, Momas I, Roche D, Gauvin S, Reungoat P, et al. (2003)
Questionnaire or objective assessment for studying exposure to tobacco smoke among asthmatic and healthy children: The French VESTA Study. Prev Med 36: 108–113.
29. Britton GR, Brinthaupt J, Stehle JM, James GD (2004) Comparison of self-reported smoking and urinary cotinine levels in a rural pregnant population. J Obstet Gynecol Neonatal Nurs 33: 306–311.
30. Webb DA, Boyd NR, Messina D, Windsor RA (2003) The discrepancy between self-reported smoking status and urine continine levels among women enrolled in prenatal care at four publicly funded clinical sites. J Public Health Manag Pract 9: 322–325.
31. Metsios GS, Flouris AD, Jamurtas AZ, Carrillo AE, Kouretas D, et al. (2007) A brief exposure to moderate passive smoke increases metabolism and thyroid hormone secretion. J Clin Endocrinol Metab 92: 208–211.
32. Pichini S, Garcia-Algar O, Munoz L, Vall O, Pacifici R, et al. (2003) Assessment of chronic exposure to cigarette smoke and its change during pregnancy by segmental analysis of maternal hair nicotine. J Expo Anal Environ Epidemiol 13: 144–151.
33. Brajenovic N, Karaconji IB, Mikolic A, Stasenko S, Piasek M (2013) Tobacco smoke and pregnancy: segmental analysis of nicotine in maternal hair. Arch Environ Occup Health 68: 117–122.
34. Nafstad P, Botten G, Hagen JA, Zahlsen K, Nilsen OG, et al. (1995) Comparison of three methods for estimating environmental tobacco smoke exposure among children aged between 12 and 36 months. Int J Epidemiol 24: 88–94.
35. Tzatzarakis MN, Vardavas CI, Terzi I, Kavalakis M, Kokkinakis M, et al. (2012) Hair nicotine/cotinine concentrations as a method of monitoring exposure to tobacco smoke among infants and adults. Hum Exp Toxicol 31: 258–265. 36. Koren G, Blanchette P, Lubetzky A, Kramer M (2008) Hair nicotine:cotinine
metabolic ratio in pregnant women: a new method to study metabolism in late pregnancy. Ther Drug Monit 30: 246–248.
37. Florescu A, Ferrence R, Einarson TR, Selby P, Kramer M, et al. (2007) Reference values for hair cotinine as a biomarker of active and passive smoking in women of reproductive age, pregnant women, children, and neonates: systematic review and meta-analysis. Ther Drug Monit 29: 437–446. 38. Florescu A, Ferrence R, Einarson T, Selby P, Soldin O, et al. (2009) Methods for
quantification of exposure to cigarette smoking and environmental tobacco smoke: focus on developmental toxicology. Ther Drug Monit 31: 14–30. 39. Llaquet H, Pichini S, Joya X, Papaseit E, Vall O, et al. (2010) Biological matrices
for the evaluation of exposure to environmental tobacco smoke during prenatal life and childhood. Anal Bioanal Chem 396: 379–399.
40. Benowitz NL (1996) Cotinine as a biomarker of environmental tobacco smoke exposure. Epidemiol Rev 18: 188–204.
41. Benowitz NL, Hukkanen J, Jacob P, 3rd (2009) Nicotine chemistry, metabolism, kinetics and biomarkers. Handb Exp Pharmacol: 29–60.
42. Directorate General Health and Consumers (2010) Special Eurobarometer 332/ Wave 72.3– TNS Opinion & Social: Tobacco. Brussels, Belgium: European Commission.
43. Carrillo AE, Metsios GS, Flouris AD (2009) Effects of secondhand smoke on thyroid function. Inflamm Allergy Drug Targets 8.
44. Gorsuch RL (1983) Factor Analysis. Hillsdale, NJ: Erlbaum.
45. Preacher KJ, MacCallum RC (2003) Repairing Tom Swift’s electric factor analysis machine. Underst Stat 2: 13–43.
46. Kim SR, Wipfli H, Avila-Tang E, Samet JM, Breysse PN (2009) Method validation for measurement of hair nicotine level in nonsmokers. Biomed Chromatogr 23: 273–279.
47. DeLong ER, DeLong DM, Clarke-Pearson DL (1988) Comparing the areas under two or more correlated receiver operating characteristic curves: a nonparametric approach. Biometrics 44: 837–845.
49. Flouris AD, Metsios GS, Koutedakis Y (2005) Enhancing the efficacy of the 20 m multistage shuttle run test. Br J Sports Med 39: 166–170.
50. Dwyer AJ (1991) Matchmaking and McNemar in the comparison of diagnostic modalities. Radiology 178: 328–330.
51. Zhou X, Obuchowski NA, McClish DK (2002) Statistical Methods in Diagnostic Medicine. NY Wiley and Sons: 185.
52. Warren CW, Jones NR, Peruga A, Chauvin J, Baptiste JP, et al. (2008) Global youth tobacco surveillance, 2000–2007. MMWR Surveill Summ 57: 1–28. 53. Giovino GA, Mirza SA, Samet JM, Gupta PC, Jarvis MJ, et al. (2012) Tobacco
use in 3 billion individuals from 16 countries: an analysis of nationally representative cross-sectional household surveys. Lancet 380: 668–679.
54. Woodruff SI, Conway TL, Elder JP, Hovell MF (2007) Pilot study using hair nicotine feedback to reduce Latino children’s environmental tobacco smoke exposure. Am J Health Promot 22: 93–97.
55. Al-Delaimy WK, Crane J, Woodward A (2002) Is the hair nicotine level a more accurate biomarker of environmental tobacco smoke exposure than urine cotinine? J Epidemiol Community Health 56: 66–71.