Vicente de Paulo Nicolau
Emeritus Member, ABCM
vicente @emc.ufsc.br
Alessandro Pedro Dadam
[email protected] Universidade Federal de Santa Catarina – UFSC Departamento de Engenharia Mecânica 88040-900 Florianópolis, SC, BrazilNumerical and Experimental Thermal
Analysis of a Tunnel Kiln used in
Ceramic Production
The available technology for tunnel kilns in Brazil is practically empirical and there is a lack of fundamental studies developed as an aid for the design of new kilns or for the retrofit of old ones. Here, a thermal model of a tunnel kiln is developed allowing the numerical simulation of kilns and dryers aiming toward a more efficient and less energy consuming design. The model is then systematically applied in the design of a new kiln to be used for firing clay tiles, bricks and similar products, with natural gas and sawdust as fuels. The results include the three-dimensional temperature distribution within the walls, gas and load along the kiln and a complete thermal energy balance including all energy fluxes related to the process. The strategies for kiln design are discussed and the advantages of combining the low cost of the wood sawdust and the ease of adjustment and quality of the natural gas combustion are evidenced.
Keywords: tunnel kiln, energy efficiency, thermal simulation, natural gas, bioenergy
Introduction
1The requirements of the global market for energy economy and
environmental control have been growing in recent years, and as a consequence the industry faces new challenges to adjust itself to the reality of this niche. This adjustment includes a complete rearrangement of the production processes of companies, from the preparation of the raw material to the delivery of products, with the adoption of new technologies and updating of existing equipment.
In the case of ceramics, the kilns, elements of essential importance in the production process, are generally designed, implemented and adjusted in an empirical form, without a detailed knowledge of their behavior and the effect on performance of possible changes in the operation parameters.
In the specific case of the tunnel kiln, the technology is very well developed in European countries, with important developments regarding the control, regulation and adequacy of new projects. The modern tunnel kilns are designed and built with better thermal isolation on the walls, and also using lighter support materials on the car floor, reducing the thermal inertia of the set. In this way, faster cycles of firing can be programmed, always considering the restrictions imposed by the particular features of each raw material of the load.
In this regard, this study addresses the development of a thermal analysis model and a numerical tool to aid in the thermal design and operation of tunnel kilns. Other authors have also carried out studies to model complete kilns, which are described below.
Abbakumov and Mociu (1981) proposed a model that considers the energy and mass conservation equations applied to gases and to the load, only in the firing zone of the kiln. Yu (1994) presented a model that describes the dynamic processes in the tunnel. The model is based on equations of energy and mass, and considers the transient conduction of heat occurring in the load and cars, in the three zones of the kiln. In Yu’s approach the dynamic processes of a tunnel kiln are controlled exactly by the two-dimensional transient conduction in the load and cars. The model considers a load input rate, calculated for the time interval in which one car, loaded with products not yet fired, is pushed into the kiln while simultaneously another car, loaded with fired products, is pushed out of the kiln. The gas temperature profiles and oxygen concentration in the firing zone are known for each product to be manufactured and vary according to the type and dimensions of the kiln, as with the model of Abbakumov and Mociu (1981).
Paper accepted May, 2009. Technical Editor: Demetrio Bastos Neto
Santos (2001) considered a tunnel kiln used to fire bricks based on sawdust combustion. Later, the kiln was adapted to consume natural gas. A numerical algorithm was developed to simulate the thermal behavior, including energy consumption and heat flow paths. The numerical results have been compared with experimental data, presenting a good agreement. In his study, Santos (2001), in contrast to Yu (1994), could apply the appropriate amount of fuel and air for combustion to attain the programmed temperature curve for the gases and load. At the end, the energy destination can be determined, including the wall heat losses, the energy associated with the flue gas and the energy conveyed by the exiting load. In the kiln operation, a steady-state regime prevails, as is usual in tunnel kilns. As a result of the simulations, some modifications were discussed and implemented, such as more insulation around the kiln envelope, and a 10 meter addition to the length of the cooling zone, resulting in a satisfactory reduction in the fuel consumption and in greater productivity. Experimental data were collected and compared to simulation results, presenting a good agreement.
In the work of Santos (2001) it was noted that a better understanding of the internal and external heat transfer in the load is important for the correct prediction of the load temperatures. Following his work, a heat transfer model for a tunnel kiln is here developed, addressing the three-dimensional internal (within) and external heat transfer in the load and in the kiln walls through the mechanisms of conduction, surface convection and surface radiation exchange. The tunnel kiln is focused in the study here presented, and the thermal and fluid flow model is described, and the numerical algorithm used is discussed. The results are then presented and analyzed, followed by the conclusions.
Nomenclature
A = area, m²
Aint = ratio between the load element internal area and external area, m²/m²
cp = specific heat, J/kg.K
h = convective heat transfer coefficient, W/m².K
k = thermal conductivity, W/m.K
m& = mass flux, kg/s
m&reactions= mass flux associated with clay reactions, kg/s
Qreactions = energy rate associated with clay reactions, J/kg T = temperature, K
x, y, z = dimensions in x, y and z directions, respectively, m
Greek Symbols
ε = surface emissivity
σ = Stefan-Boltzmann constant, W/m2.K4
ρ = specific mass, kg/m3
δ = kiln base thickness, m
Subscripts
e load element
ee load element external area fe frontal face of a load element g gases circulating inside kiln ie load element internal area in inlet flow of the control volume
ix,iy,iz generic element of the kiln: x, y and z directions le load element lateral area
out outlet flow of the control volume ref reference
rfe element frontal area involved in radiation exchange rle element lateral area involved in radiation exchange rse element top area involved in radiation exchange se top surface of a load element
The Tunnel Kiln
A tunnel kiln is a steady-state kiln, considering the operation regime, and has been introduced recently into Brazil and other South American countries. Many small industries still use transient kilns, with variable capacity and conception. The transition to the tunnel kilns is progressive, and may take some time. The difference between these two conceptions is considerable in terms of the organization of the activities within the plant. Industrial production with transient kilns requires a lot of units and each one needs to be filled, warmed-up, fired and finally discharged. The load displacement is more complex, as one unit succeeds another one in a different position in the factory layout. However, the most important difference is with regard to the energy consumption. Even though the firing process can be the same, as both of them can reach final products with identical properties and the load can be subject to similar time cycles, the equipment involved is very different.
In the tunnel kiln the structure is heated only at the kiln start-up and keeps operating for a long period of time. The load (bricks, roof tiles, tiles) assumes the temperature as it moves inside the tunnel, and the firing cycle is completed when the material leaves the kiln. The structure remains hot and an adequate insulation allows a reduction in the heat loss through the walls. The load and the car can keep the kiln at a satisfactory temperature, as the residual energy can be removed in the cooling zone. All the removed energy associated with the cooling air flow can be used to heat the combustion air or be used in the drying process.
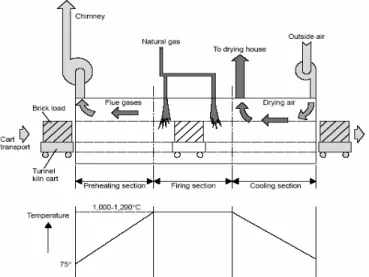
A sketch with the main components of this kiln is shown in Fig. 1, as presented in Caddet (1993). The complete kiln is divided into three zones, according to the thermal treatment to which the load is subjected: preheating, firing and cooling zone. Besides the movement of the load, the scheme shows the flows of gases after combustion and the cooling air, as well as a schematic diagram showing the temperature distribution through the entire kiln.
The dimensional features of the kiln are presented in Table 1, corresponding to the dimensions of a kiln designed and constructed in an industrial ceramic plant located in Criciúma, State of Santa Catarina, Brazil. Although a single case is analyzed here, the model could also been applied to other data or different-sized kilns, given the generality of the equations.
Modeling
The model is based on the application of the mass and energy conservation equations in the integral form, for a three-dimensional geometry. The domain was discretized into finite volumes and the equations where applied to each volume following a finite volume methodology (Maliska, 1995).
Figure 1. Schematic diagram of a tunnel kiln (Caddet, 1993).
Table 1. Dimensional characteristics of the kiln [m].
Useful width of the load 0.68
Useful height of the load 0.85
Kiln length 63.30
Length of the preheating zone 14.70
Length of the firing zone 21.85
Length of fast cooling zone 3.55
Length of normal cooling zone 23.20
Wall thickness in the preheating zone 0.65
Wall thickness in the firing zone 0.85
Wall thickness in the cooling zone 0.50
The numerical code was implemented using FORTRAN language. A single numerical mesh extending over the kiln walls, floor and ceiling, and the load and cars inside the kiln, with circulating volumes of combustion gases and air (a single domain approach), is used. The mesh is static, as the kiln structure and the elements related to the load, cars, gases and air are also static. Within this static mesh, air and load flow, following an imposed external mass flow rate.
The energy resulting from fuel combustion has four main destinations, when steady-state is attained:
- Load and car: energy associated with the load and car flow in the end of the tunnel; energy necessary to evaporate the residual humidity in the preheating zone; energy associated with chemical and physical reactions inside the raw material during the process; - Exhaustion chimney: energy associated with the flue gases; - Heat loss: energy conveyed to the environment by conduction through the kiln envelope, followed by convection and radiation of the lateral walls and ceiling and conduction of the base;
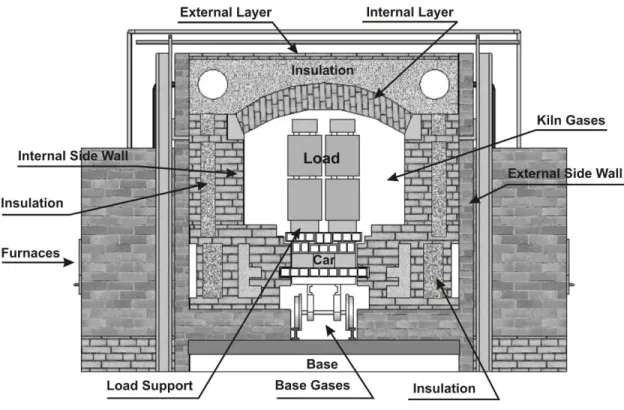
The sketch in Fig. 2 is related to the transversal section of the kiln in the firing zone. This figure can be used to show the various heat transfer processes occurring inside and outside the kiln. The combustion process generates high temperature gases, flowing into the tunnel. As a consequence, a series of energy transfer processes are considered in the following list:
- Conduction and radiation between load elements; - Conduction and radiation between load and car elements; - Conduction between car elements;
- Radiation between external load elements and internal surface of the kiln structure;
- Convection inside and outside the load elements with combustion gases;
- Radiation between car surface and kiln base;
- Convection between car and air cushion over the kiln base; - Conduction inside kiln wall;
- Convection between internal wall surfaces and gases flowing inside tunnel;
- Convection and radiation between external wall surfaces and environment.
Equations based on the energy conservation law were established for each element of the kiln, delimited by a particular mesh. For example, for a particular load element, a general equation can be established, as in Eq. (1). The heat fluxes through the element borders are represented by the three first terms, conduction, convection and radiation, respectively (Incropera and De Witt, 2003). Each heat flux is multiplied by the related area, depending on the interface. For an inner element, six interfaces are involved. For
an external element, four or five interfaces are considered for conduction and radiation toward neighboring elements. Longitudinal conduction inside solids is neglected, given the small temperature gradient in this direction, compared to other directions. One or two interfaces are used to calculate external radiation and convection. As the load element is not a massive body, such as ceramic blocks in general, the material can be considered porous to a certain degree, with gas circulation inside the channels. Some circulation also occurs between the blocks, and convection takes place inside the load itself. The fourth term represents the energy transport associated with the mass displacement at the inlet or outlet of the control volume. This occurs specifically for the load, car and gas elements. The fifth and last term represents the energy generation rate, depending on the physical or chemical reactions.
0
=
+
+
⋅
′′
+
⋅
′′
+
⋅
′′
k c c r r g reactionsk
A
q
A
q
A
E
E
q
&
&
(1)For a particular element inside the load, Eq. (1) can be developed in a more detailed form, presented in Eq. (2), using the finite volume technique (Maliska, 1995). Conduction heat transfer is represented in the first four terms, including temperatures of lateral neighboring elements. The fifth and sixth terms consider the convection exchange with circulating gas, inside and outside the element. The following six terms simulate the radiation heat transfer between adjacent elements, similarly to two parallel surfaces with emissivity ε. The thirteenth and fourteenth terms represent inlet and outlet transport of energy, respectively, associated with solid mass transport. The last term considers the reactions inside the element.
(
) (
(
)
)
(
) (
(
)
(
)
)
(
) (
(
)
)
(
)
(
) (
(
)
(
)
)
(
)
(
( )
(
)
)
(
)
(
( )
(
)
)
( ) ( ) )
(
)
(
(
(
)
(
)
)
( ) ( ) )
(
)
(
(
(
)
(
)
)
( ) ( ) )
(
)
(
(
(
)
(
)
)
( ) ( ) )
(
)
(
(
(
)
(
)
)
( ) ( ) )
(
)
(
(
(
)
(
)
)
( ) ( ) )
(
)
(
(
(
)
(
)
)
(
)
(
(
)
)
(
)
(
(
)
)
(
ix
,
iy
,
iz
)
Q
(
ix
,
iy
,
iz
)
m
T
iz
,
iy
,
ix
T
C
iz
,
iy
,
ix
m
T
iz
,
iy
,
ix
T
C
iz
,
iy
,
ix
m
iz
,
iy
,
ix
T
iz
,
iy
,
ix
T
A
iz
,
iy
,
ix
T
iz
,
iy
,
ix
T
A
iz
,
iy
,
ix
T
iz
,
iy
,
ix
T
A
iz
,
iy
,
ix
T
iz
,
iy
,
ix
T
A
iz
,
iy
,
ix
T
iz
,
iy
,
ix
T
A
iz
,
iy
,
ix
T
iz
,
iy
,
ix
T
A
iz
,
iy
,
ix
T
iz
Tg
.
A
.
iz
,
iy
,
ix
h
iz
,
iy
,
ix
T
iz
T
.
A
.
iz
,
iy
,
ix
h
iz
,
iy
,
ix
T
iz
,
iy
,
ix
T
.
X
A
.
K
iz
,
iy
,
ix
T
iz
,
iy
,
.
ix
T
.
X
A
.
k
iz
,
iy
,
ix
T
iz
,
iy
,
ix
T
.
Y
A
.
k
iz
,
iy
,
ix
T
.
Y
A
.
k
reactions reactions ref e pe out ref e pe in e e Rie e e Rie e e Rie e e Rie e e Rse e e Rse e ee ee e g ie e e e e ie e e e e ie e e e e se e e e se e&
&
&
+
−
⋅
⋅
−
−
−
⋅
⋅
+
−
+
⋅
−
+
⋅
+
−
−
⋅
−
+
⋅
+
−
+
⋅
−
+
⋅
+
−
−
⋅
−
+
⋅
+
−
+
⋅
−
+
⋅
+
−
−
⋅
−
+
⋅
+
−
+
−
+
−
+
+
−
−
+
−
+
+
−
=
1
1
1
1
1
1
1
1
1
1
1
1
1
1
1
1
1
1
1
1
1
1
1
1
1
1
1
1
1
0
4 4 4 4 4 4 4 4 4 4 4 4ε
ε
σ
ε
ε
σ
ε
ε
σ
ε
ε
σ
ε
ε
σ
ε
ε
σ
(2)A series of equations was developed similar to those in Eq. (2), including all the elements used to solve the problem. Some routines, listed in Fig. 3, are also attached to the main program and represent auxiliary tools in specific calculations like Combustion Routine. In this case, the mass flow and temperature of combustion gases are estimated based on information such as fuel consumption and composition, air flow rate and respective inlet temperature.
Initial Parameters
Combustion
Routine CoefficientsConvection
Gas Flow
Estimate Main Program Property Values
Thermal Reactions
Geometry Results
Energy Balance
Figure 3. Flowchart of numerical code.
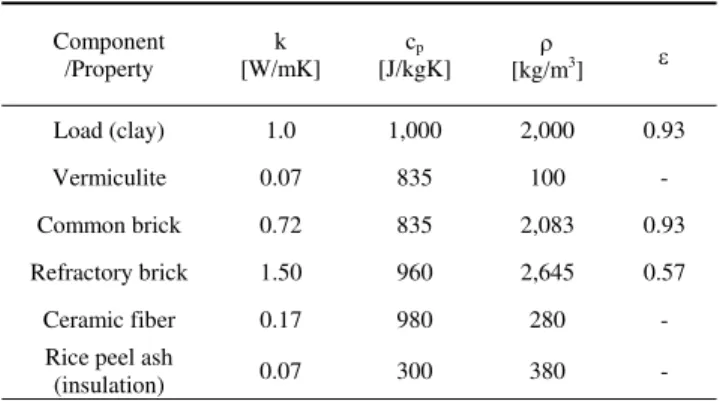
In this analysis it is possible to vary all parameters of the kiln, that is, thermal insulation of the walls, load flow or kiln production, dimensions of the kiln and its components, air injections and withdrawal of gases, fuel consumption and so forth. Thus, it is possible to use the code to simulate a new operational load temperature distribution along the tunnel called the “firing curve”, or to simulate a new kiln during the design stage. With the inlet data of the kiln established, the levels of fuel and combustion air are selected, resulting in a particular firing curve. Other results are also available: longitudinal temperature distribution for the circulating gas in the firing and preheating zone and air in the cooling zone; heat loss through the walls, energy fluxes associated with flue gases, and with the cooling air; energy delivered by the load and cars at the tunnel exit. The transversal gradients of temperature inside the load can alsobe analyzed in order to reduce them, avoiding operational problems during the firing process. Property values for structural elements, load and insulation, used in the simulation, are listed in Table 2. In the kiln analyzed herein, the thermal insulation in the preheating and cooling zones is formed by a filling of rice peel ash, while in warmer areas vermiculite and ceramic fiber are used together with refractory bricks.
Table 2. Property values used in the simulation.
Component
/Property [W/mK] k [J/kgK] cp [kg/mρ 3] ε
Load (clay) 1.0 1,000 2,000 0.93
Vermiculite 0.07 835 100 -
Common brick 0.72 835 2,083 0.93
Refractory brick 1.50 960 2,645 0.57
Ceramic fiber 0.17 980 280 -
Rice peel ash
(insulation) 0.07 300 380 -
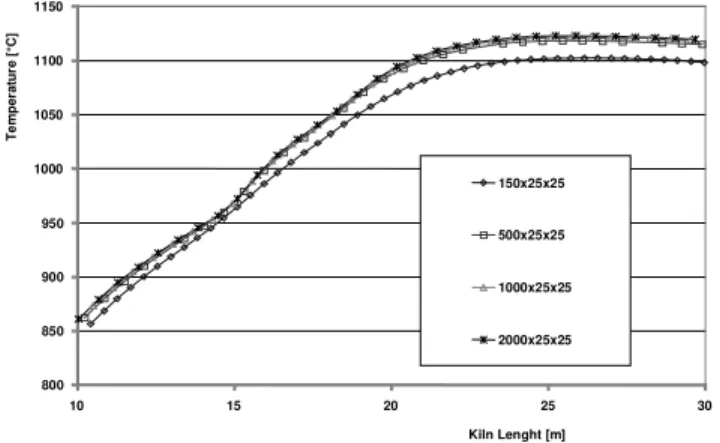
Figure 4 shows the temperature for a point inside the load in the heating and firing regions. Uniform grids with different numbers of elements, from 150 to 2,000 in the longitudinal direction, are used. The results indicate a similar behavior for grids with 500 or more elements, with no substantial changes for a finer grid. As a consequence, the grid with 500 longitudinal elements was adopted. A similar analysis was carried out in the transversal directions inside the load, resulting in a 25 x 25 element grid. Such a grid required an execution time of 1.3 hours using an AMD 2.0 GHz processor with 1.0 GB RAM. The finest grid represents a calculation time of 12.2 hours. This long calculation time represents a restriction in the discretization of the domain, especially when different materials are used lengthwise.
Kiln Thermal Analysis
800 850 900 950 1000 1050 1100 1150
10 15 20 25 30
Kiln Lenght [m]
T
e
m
p
er
atur
e [
°C
]
150x25x25
500x25x25
1000x25x25
2000x25x25
Figure 4. Temperature within the load for the central part of the tunnel kiln for different numbers of grid elements.
Table 3. Some operational conditions used in the kiln simulations.
Production [m2/day] 500 750 1,000 1,250 1,500
Production [kg/s] 0.13 0.19 0.25 0.31 0.38
Natural gas - NG [Nm3/h] 6.84 7.02 7.02 7.02 7.56
Air excess - NG 1.65 1.65 1.65 1.65 1.65
Sawdust [kg/s] 0.065 0.070 0.110 0.130 0.155
Air excess -
Sawdust 1.65 1.65 1.65 1.65 1.65
Percentage - NG [%] 12.1 11.6 7.7 6.6 6.0
Figure 5 shows the temperature distribution, simulated for the load core, for different production rates, according to the data from Table 3. The 500 m2/day curve represents the lowest daily
production. The material suffers a rapid heating and consequently a very fast cooling process. This is a consequence of the low speed displacement of the car and load inside the kiln combined with the time necessary to exchange heat with combustion gases and with air. The performance at the highest production rate of 1,500 m2/day
shows that the temperature does not increase very fast at the beginning, and decreases to a lower rate during the cooling process, remaining at a certain temperature level at the end. This high level of temperature indicates that some energy needs to be recovered from the load and from the car and used in another process. Intermediate temperature curves are also shown in Fig. 5, and all of them show the essential influence of the convective heat transfer, conveying energy toward the kiln entrance. In the cooling zone the energy is carried to the kiln exit, and air is used to recover this energy for use with other equipment. There are practical limits to the heating and cooling velocity, imposed by the material, in order to prevent failures and losses, and to provide the time necessary for firing and promoting the associated reactions. A critical point in the cooling process is at around 573 °C, where a quartz phase transformation occurs inside the material, imposing a slower velocity, in order to prevent piece collapses.
The sketch in Fig. 6 shows the temperature distribution inside the load, 60 m from the kiln entrance, at the end of the cooling zone, for a production rate of 750 m2/day. The central region has a
temperature of around 130 °C and the surface is colder, with temperatures of around 60 °C. Some distance to the end still remains, and it is necessary to recover all of the energy associated
with the material and the car. In order to reduce the temperature gradient inside the load, some additional injection point of air can be provided. Also, a more ventilated load, with more space between pieces, can be adopted.
The temperature gradients shown in Fig. 5 and 6 must be quantified to prevent failures inside the kiln, resulting in a poor quality material after the firing process. A different and even worse consequence occurs when material failure reaches the load stability – the stack can collapse total or partially, blocking the car movement. The gradient limit supported by load elements must be tested previously in a laboratory, according to the clay used.
0 200 400 600 800 1000 1200
0 10 20 30 40 50 60
Kiln length [m]
Te
m
p
e
ra
tu
re [
°C]
1500 m2
1250 m2
1000 m2
750 m2
500 m2
Figure 5. Load temperatures for several daily production rates.
Temperature [°C]
60 69 78 86 95 104 113 121 130
Figure 6. Temperature distribution inside the load in the cooling zone end (production rate of 750 m2
/day).
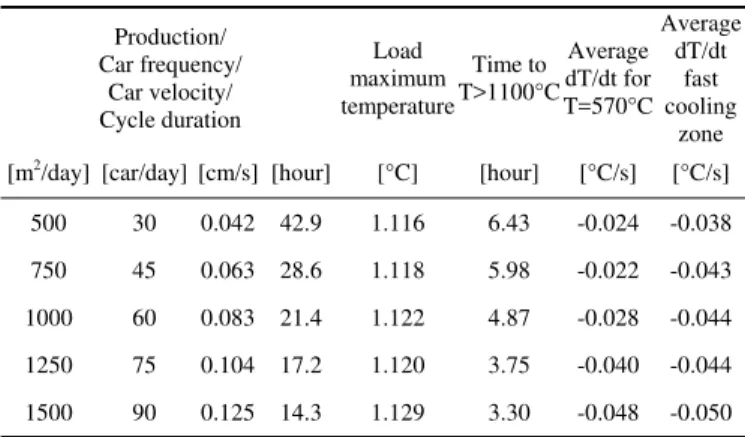
Table 4. Car frequency, load residence time and cooling rates for several production rates.
Production/ Car frequency/
Car velocity/ Cycle duration
Load maximum temperature
Time to T>1100°C
Average dT/dt for T=570°C
Average dT/dt
fast cooling
zone
[m2/day] [car/day] [cm/s] [hour] [°C] [hour] [°C/s] [°C/s]
500 30 0.042 42.9 1.116 6.43 -0.024 -0.038
750 45 0.063 28.6 1.118 5.98 -0.022 -0.043
1000 60 0.083 21.4 1.122 4.87 -0.028 -0.044
1250 75 0.104 17.2 1.120 3.75 -0.040 -0.044
1500 90 0.125 14.3 1.129 3.30 -0.048 -0.050
In addition, the kiln operation speed is imposed by the colder elements inside the stack. Temperature uniformity is necessary to avoid firing differences for pieces placed in different positions on the car, resulting in a series of products with more controlled quality, considering physical properties, colors and dimensions. The raw materials undergo phase transformations during the firing process (endothermic and exothermic) and some of them are very important when considering the energy balance and quality control.
The material arrangement on the car has a strong influence on the heat transfer and on the temperature gradient inside the load. Compact piles reduce the gas flow inside the load stack, reducing thermal exchanges as a consequence. Heating or cooling the load central point thus takes more time when a compact arrangement is used. Temperature distributions, shown in Fig. 7, obtained from numerical simulations show this behavior. In these simulations, a special parameter was focused, the inner load area, which is the load internal area in contact with the internal flow. This analysis is presented in terms of the ratio between this inner load area and the external area of the load, the internal area ratio Aint. The internal
area (inside the hollows, e.g., for a brick) is considered as well as the space between pieces. These channels form a reasonably straight flow path when the pieces are correctly oriented, improving gas circulation inside the stack. Otherwise, the flow path is highly tortuous, decreasing the internal convection heat transfer. The brick and stack volumes as well as the number of bricks are determined. The total internal area of a stack is calculated from the internal brick area and the number of bricks. The internal area for a grid element is proportional to the volume ratio over the number of elements in the stack volume. This procedure avoids mistakes when a more refined grid is used.
For compact loads with an internal area ratio of Aint = 0.001, i.e.,
an internal area equivalent to only 0.1% of the external load area is exposed to the internal gas flow, a very low energy diffusion inside the load is observed (Fig. 7). A compact arrangement is sometimes used to improve the car stability. The central point inside the load takes at least 10 m to initiate the heating process. The maximum temperature in the firing zone is lower than at other points. The cooling process takes longer and the temperature is around 350 °C next to the kiln exit. The energy transfer inside the stack occurs mainly by conduction. For internal area ratios greater than 0.5, the internal convection heat transfer assumes its role in the process, resulting in a very different scenario. The temperature distribution becomes closer to that of the gas temperature. This approximation means a very low thermal resistance inside the material, and heat flows easily from gas to elements and vice-versa. Such a material is not only porous, but has a permeable arrangement, with a lot of
channels available for gas circulation inside the stack. Hollows in a brick are important only when pieces and hollows are aligned together in transversal or longitudinal direction of the kiln. Holes blocked by neighbor elements represent an additional thermal resistance and delays in the heating and cooling processes.
0 200 400 600 800 1000 1200
0 10 20 30 40 50 60
Kiln Length [m]
T
em
p
e
rat
u
re [
°C
]
Aint = 2.0
Aint = 1.0
Aint = 0.5
Aint = 0.1
Aint = 0.03
Aint= 0.01
Aint = 0.001
Tg
Aint growth
Figure 7. Temperature distribution inside the load, for several internal area ratio values.
In these simulations, the production rate and fuel consumption were maintained stable, for 750 m2 of tiles/day, as shown in Table 3.
The influence of the internal area ratio Aint on the energy flux associated with the car and with the load at the kiln exit is shown in Table 5. The energy flux recovered at the dryer is also listed. The percentages listed are referenced to the total energy consumption of the kiln. The results show that all of the values increase when the area inside the load increases. This highlights the importance of a better air circulation inside the load to improve the heat transfer. A limit can, however, be observed: when Aint is equal to 0.1, the losses associated with the cars and load are less than 1 %. The cold air injected into the kiln can circulate inside the load and perform an adequate heat exchange. At values above Aint = 0.1, there is no additional gain in the energy conveyed to the dryer, recovered from the cars and the load.
Table 5. Energy recovered at the dryer and energy remaining in cars and load, as a function of internal area ratio (Aint).
Internal area ratio (Aint) 0.001 0.01 0.03 0.1 0.5 1.0 2.0
Remaining in
load [%] 6.23 4.80 2.91 0.84 0.03 0.00 0.00
Remaining in car [%] 0.04 0.04 0.03 0.02 0.01 0.00 0.00 Recovered at
dryer [%] 7.42 8.42 9.67 11.10 11.50 11.51 11.51
Thermal Energy Balance and Insulation Effect
The thermal energy balance allows the mapping of the destination of the energy introduced into the kiln by combustion and gives important information during the design and construction phases, as well as during retrofitting and normal operation. The goal is to rationalize the thermal energy usage in the firing process.
considered in the internal part of the wall, while in the non-insulated situation, a refractory brick was used. It is observed that the non-insulated case gave a lower temperature distribution. In this case, a large amount of energy is wasted to the external ambient. Certainly more energy will be necessary to promote the firing process and less energy can be recovered at the dryer in the cooling zone.
Figure 8. Effect of kiln insulation on the temperature of the load central element – insulated and non-insulated kiln walls (production rate of 750 m2 floor tiles/day).
The energy balance for the conditions used in Fig. 8 is shown in Table 6. The energy input, from fuel combustion, is divided by many energy paths, and the value associated with each path is altered when the wall insulation is modified. The most important part is the energy associated with combustion gas, which moves in counterflow, heating the load. This parcel does not represent an energy loss, because it is used to dry and to warm-up the load, before it enters the kiln. Similarly, the energy removed by cooling air is not considered as a loss; it can be used in the dryer and to preheat the combustion air, thus remaining partially in the process.
The residual energy associated with the cars and load remains at a very low level, due to good ventilation and a porous stack piled with well-spaced elements. This result can be seen in Fig. 8, where the final load temperature is around 35 °C – close to ambient temperature.
The most important difference observed in Table 6 concerns the energy loss through the kiln envelope, which can be reduced when adequate insulation is applied. An insulated wall keeps the energy inside the kiln, thus improving the temperature level, as seen in Fig. 8. Such energy is recovered with the outflow of combustion gases and cooling air. The energy associated with combustion gases is very important and is available to warm-up and to dry the load, but a considerable amount of water vapor is present from the combustion reaction and from subsequent drying and reactions inside the raw material. Therefore, this energy can be partially used in another process in order to avoid condensation.
Following the thermal energy balance, the influence of other variables, such as combustion air and load inlet temperatures, on the fuel consumption were also analyzed. The results indicate 9.6 % of fuel economy, when the combustion air is pre-heated to 150 °C, as shown in Table 7. When preheating is applied to the inlet load, the observed fuel economy is around 3.6 %, as shown in Table 8.
Table 6. Energy outputs in an insulated and a non insulated kiln.
Insulated Non Insulated
[kW] [%] [kW] [%]
Energy loss to the roof 14.2 2.4 113.9 19.0
Energy loss to the lateral walls 53.1 8.8 164.3 27.3
Energy loss to the base 27.8 4.6 18.4 3.1
Energy remaining inside the load 0.1 0.0 0.0 0.0
Energy remaining inside the cars 0.0 0.0 0.0 0.0
Energy conveyed by combustion gas 388.2 64.6 266.7 44.4
Energy conveyed by cooling air 114.7 19.1 34.8 5.8
Reactions inside the clay 2.7 0.4 2.7 0.4
Energy input – fuel combustion 600.8 100 600.8 100
Table 7. Energy economy with pre-heated air combustion.
Air combustion inlet temperature [°C] 100 150 200
Fuel economy [%] 5.4 9.6 13.8
Table 8. Energy economy with pre-heated load.
Load inlet temperature [°C] 100 150 200
Fuel economy [%] 2.1 3.6 5.3
Experimental Results
For a period of one year from the start of operation, several experiments with different ceramic products were performed in the kiln. The goal was to demonstrate the capacity of the kiln to fire these products using biomass and natural gas. The most frequently produced part was a particular brick, with the operation conditions listed in Table 9. The typical production level was lower than those simulated above, as can be seen in Table 3. As a consequence, the specific consumption in these tests was higher than the normal level for this kind of kiln. As an example, the specific consumption for a mass production rate of 0.19 kg/s (Table 3) is around 3160 J/kg. The tunnel kiln consumes less energy, depending on the production and dimensions. Remmey (1994) indicates a specific consumption of around 2300 J/kg. The firing temperature can also affect the specific consumption.
Table 9. Operation conditions of the kiln used during the test period.
Production 0.125 kg/s
Bricks produced 270 x 130 x 95 [mm] 4020 unit/day
Approximate firing temperature 1000 °C
Specific consumption (fired material base) 3470 kJ/kg
Natural gas consumption 197.6 Nm3/day
Sawdust consumption 14.0 m3/day
0 200 400 600 800 1000 1200
0 10 20 30 40 50 60
Kiln length [m]
T
e
mp
erat
u
re [
°C]
Load temperature insulated kiln
Energy percentage from natural gas 20 %
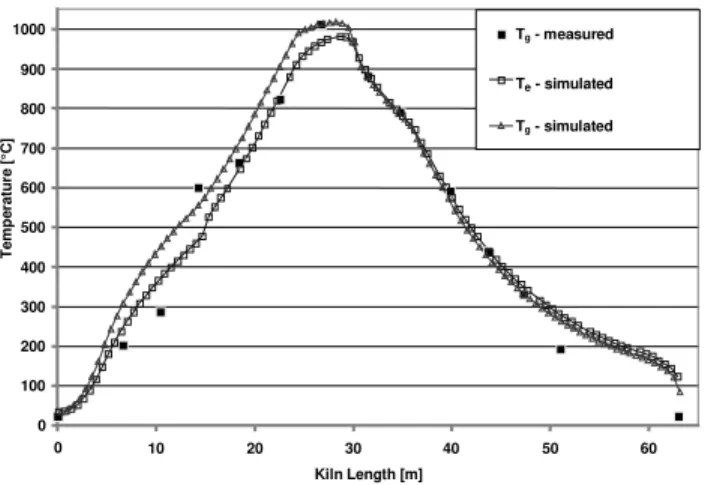
Temperature distributions for the gas within the kiln obtained during the test period are depicted in Fig. 9. The temperatures of the gas inside the kiln and at a point inside the load were simulated and compared with the measurement results. Type K thermocouples were used to measure the temperature at some points through the lateral wall. As the gas flow is not uniform across the tunnel section and there is some extraction of gas along the pre-heating zone, some deviations between the modeled and measured values are observed in such zones. A better agreement is observed in the cooling region. As the steady state in this kind of equipment takes, at least, two days to be reached, and production and environmental conditions change faster than that, some difficulties were observed in obtaining the measurements. At the same time, raw materials can also suffer changes in composition and moisture content. A strict control of these variables is not feasible, and some uncertainties can be expected when the numerical results are compared to measured values. Therefore, the agreement obtained can be considered as fair.
0 100 200 300 400 500 600 700 800 900 1000
0 10 20 30 40 50 60
Kiln Length [m]
T
e
m
p
er
a
tu
re [
°C
]
Tg - measured
Te - simulated
Tg - simulated
Figure 9. Gas temperature distribution measured along the kiln, compared to simulated temperature of the gas and temperature inside the load.
Conclusions
This paper presents the results of a thermal simulation model for use in the design and operation of a tunnel kiln. A simulation strategy allows one to verify the influence of a single variable in the kiln behavior, while other variables are kept constant. Thus, the effect of a determined set of parameters can be analyzed theoretically, without interfering with the kiln operation. In this regard, numerical simulation represents an important tool, with very low cost, to aid in the gaining of an understanding of the phenomena involved in the firing process, and also in the design process. It can be very effectively applied in research on kiln operation.
Considering the simulation algorithm, a special feature concerning the grid construction must be emphasized. Tunnel kilns are very long and have a large cross-sectional area. A fine grid inside the load is mandatory to reveal the temperature field and to estimate the temperature gradient. But the complete kiln discretization generates a lot of elements and equations to be solved,
increasing the time and memory requirements. The scale factor involves a dimension of around 100 m, the kiln length, and the thickness of the brick wall is less than 0.01 m. A more refined simulation, to run in reasonable computational time, is possible only for a section of the kiln, not for the entire kiln.
The results of the simulation were compared to measured values and the agreement was fair. A parametric analysis was then performed varying the internal load surface area, properties of the wall insulating material, air preheating temperature and air mass flow rate. The results presented revealed the amount of reduction in the fuel consumption with an increase in the thermal insulation thickness used on the walls. Another point evidenced was the influence of the load internal area on the heat exchanged with combustion gases inside the kiln. The results showed the effectiveness of the heat exchange inside the load stack which occurs above a threshold value for the internal area to external area ratio, thus reducing the temperature gradient and promoting a more uniform firing process. These results show clearly the need to use a larger number of less tortuous channels inside the load, to promote efficient gas circulation.
The thermal balance allowed the estimation of the energy distribution inside the kiln, the energy wasted to the environment and the energy available for use in other kiln-related processes. In general, the energy associated with the cooling air was sufficient to supply the drying process. In the simulated case, 19 % of the total energy employed in the kiln could be recovered at the dryer. In this case, a mixture of the warmer gases with the ambient air was necessary to reduce the temperature and to increase the air flow, in order to obtain a more efficient operation inside the dryer.
Acknowledgments
This project was financed by Finep CTPetro P027, RedegásEnergia – Rede de Excelência do Gás Natural, involving Petrobrás S.A., Transportadora do Gasoduto Bolívia-Brasil (TBG) and Companhia de Gás de Santa Catarina (SCGÁS). The authors wish to thank the many suggestions of Mr. Valmir Bortolotto, as well as the proprietor and coworkers of Cerâmica Forgiarini, Criciúma-SC-Brazil, where the kiln is installed.
References
Abbakumov, V.G. and Mociu, E.F., 1981, “Mathematical model, computation method and insurance of the temperature distributions in the
firing zone of a tunnel kiln”. Refractories, No. 2, pp. 19-25.
CADDET, 1993, “Insulated carts for tunnel kilns in brick manufacture”,
Centre for the Analysis and Dissemination of Demonstrated Energy
Technologies. Sittard, The Netherlands.
Dadam, A.P., 2005, “Thermal Analysis of a Tunnel Kiln Used in a
Structural Ceramic Industry”. MSc Dissertation, Mechanical Engineering (in
Portuguese), Brazil, 125p.
Incropera, F.P. and De Witt, D.P., 2003, “Fundamentos da Transferência de Calor e de Massa”, 5ª Ed., LTC Editora, Rio de Janeiro, Brasil, 700p.
Maliska, C.R., 1995, “Transferência de Calor e Mecânica dos Fluidos Computacional: Fundamentos e Coordenadas Generalizadas”, Livros Técnicos e Científicos, Rio de Janeiro, 424 p.
Remmey Jr., G.B., 1994, “Firing Ceramics – Advanced Series in Ceramics”, Vol. 2, World Scientific, 225p.
Santos, G. M., 2001, “Thermal Behavior of a Tunnel Kiln Applied in a
Structural Ceramic Industry”. MSc Dissertation, Mechanical Engineering,
UFSC (in Portuguese), Brazil, 113p.
Yu, B., 1994, “Dynamic modeling of a tunnel kiln”, Heat Transfer