Analysis of the frequency of biological sample
recollections as quality indicators in a clinical
laboratory of Distrito Federal, Brazil
Análise da frequência de recoletas de amostras biológicas como indicadores de
qualidade em um laboratório de análises clínicas do Distrito Federal, Brasil
Natani L. Coriolano; Izabel Cristina R. Silva; Thaís A. C. Lamounier
Faculdade de Ceilândia (FCE), Universidade de Brasília (UnB), Brasília, Brasil.
First submission on 15/09/15; last submission on 18/11/15; accepted for publication on 27/11/15; published on 20/02/16
ABSTRACT
Introduction: Clinical laboratory results inluence more than 60% of medical decisions, impacting on disease prevention, diagnosis, and treatment. The use of quality indicators (QIs) is fundamental for quality assurance, once it allows monitoring the process and directs the taking of corrective actions. Objective: Classify the biological sample recollection requests for QIs identiication in a clinical laboratory of Distrito Federal, Brazil. Material and methods: Data about the requests made in the biennium 2013-2014 were gathered and analyzed. Results and discussion: Among the 304,361 samples received, 1,914 (0.62%) had a request for recollection made in accordance with laboratory criteria. Most orders originated in the pre-analytical phase (57.7%). The most frequent reason for sample rejection was result conirmation (40.7%), followed by insuficient sample (21.9%), coagulated sample (18.1%) and hemolyzed sample (11, 9%). The hematology sector was responsible for most recollection requests (43.6%), followed by the biochemistry (29%) and the immunology (25.7%) ones. The laboratory emergency department accounted for only 0.1%. Orders were mostly placed by the outpatient clinic (40.7%), emergency (30.4%), and internal medicine (12.4%) departments. The percentage of orders is low, but does not exclude the need to reach lower rates. Underreporting was detected in the emergency sector, which indicates need for improvement in information registration. Conclusion: The numbers mentioned were selected as IQs for the pre-analytical phase, serving as guidelines for future actions taken by the team.
Key words: analytical quality control; quality improvement; quality management.
INTRODUCTION
The possibility of error occurrence exists in any area of service delivery. However, when it comes to the health sector, consequences can reach huge proportions. Incorrect laboratory results, for example, may cause harm to patients’ health and generate additional costs to the institution. Identiication of error sources is, therefore, necessary for the excellence of results and to ensure quality of the services rendered(1).
The tasks carried out at a clinical laboratory are included in a dynamic process that begins with specimen collection and progresses to reporting of test results. The total testing process (TTP) is divided into three phases: pre-analytical, analytical, and post-analytical(2). Briely, the pre-analytical phase begins
outside the laboratory, with the physician selecting and ordering the test, and goes on to sample collection and preparation for analysis. The analytical phase comprises a set of operations used in the conduction of tests according to a certain method. The post-analytical phase encompasses the obtainment of valid test results and the report release, for interpretation by the
clinician(3). Important studies demonstrate that pre- and
post-analytical phases are more prone to error than the post-analytical one. They conclude that TTP evaluation is the best form to
reduce laboratory errors(4, 5).
The assessment of health services can be done by means of indicators, which are numerical measurements of qualitative or quantitative errors associated with an event, process or result
in relation to its total number(6). Classifying errors according to
the frequency they occur is a valuable measure. It helps identify
priorities for the taking of corrective and preventive actions, so ensuring quality improvement(7).
The clinical laboratory currently studied is a support unit of the university hospital providing care to the population of Distrito Federal (DF) by means of the Uniied Health System (SUS). Depending on the type of test ordered, samples are analyzed in the sectors of biochemistry, emergency, immunology, hematology or hormones. Just the hospital’s own demands are satisied. The criteria for ordering sample recollection adopted by the laboratory were classiied to identify the quality indicators (QIs) for the TTP.
OBJECTIVE
The objective of this study was to classify orders for blood specimen recollection in order to identify QIs for a clinical laboratory in DF.
MATERIAL AND METHODS
Data collection
For the conduction of this study, secondary data were retrieved from the laboratory databank on recollection orders made between January 2013 and December 2014. The number of analyzed samples was 304,361, and the data supplied as reports were transferred to a Microsoft Excel spreadsheet version 14.5.0.
The recollection order index was calculated for the biennium. We also investigated the distribution of these orders as to year, patients’ gender (male/female), age group, hospital area from where the requests were placed, and the reasons for recollection. The age group was divided into population groups, according to a deinition by the Ministry of Health(8). For phase classiication,
reasons were divided based on TTP.
Data analysis
For frequency assessment, percentages were calculated. The variables with the highest frequencies were selected and investigated as to the distribution of reasons for recollection orders.
RESULTS
In the period between January 2013 and December 2014, 304,361 specimens were registered in the sectors of biochemistry, emergency, immunology, hematology, and hormones. Among
them, 1,914 had a recollection order based on a criterion employed by the laboratory, representing an index of 0.62% for the studied period.
The distribution of recollection orders according to the
considered variables can be seen in Table 1.
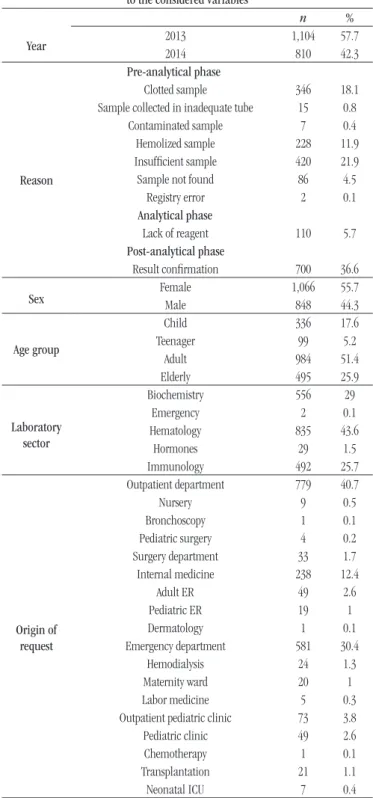
TABLE 1 − Distribution of recollection orders according to the considered variables
Year
n %
2013 1,104 57.7
2014 810 42.3
Reason
Pre-analytical phase
Clotted sample 346 18.1 Sample collected in inadequate tube 15 0.8 Contaminated sample 7 0.4 Hemolized sample 228 11.9 Insuficient sample 420 21.9 Sample not found 86 4.5
Registry error 2 0.1
Analytical phase
Lack of reagent 110 5.7 Post-analytical phase
Result conirmation 700 36.6
Sex FemaleMale 1,066848 55.744.3
Age group
Child 336 17.6
Teenager 99 5.2
Adult 984 51.4
Elderly 495 25.9
Laboratory sector
Biochemistry 556 29
Emergency 2 0.1
Hematology 835 43.6
Hormones 29 1.5
Immunology 492 25.7
Origin of request
Outpatient department 779 40.7
Nursery 9 0.5
Bronchoscopy 1 0.1
Pediatric surgery 4 0.2
Surgery department 33 1.7 Internal medicine 238 12.4
Adult ER 49 2.6
Pediatric ER 19 1
Dermatology 1 0.1
Emergency department 581 30.4
Hemodialysis 24 1.3
Maternity ward 20 1
Labor medicine 5 0.3
Outpatient pediatric clinic 73 3.8
Pediatric clinic 49 2.6
Chemotherapy 1 0.1
Transplantation 21 1.1
Neonatal ICU 7 0.4
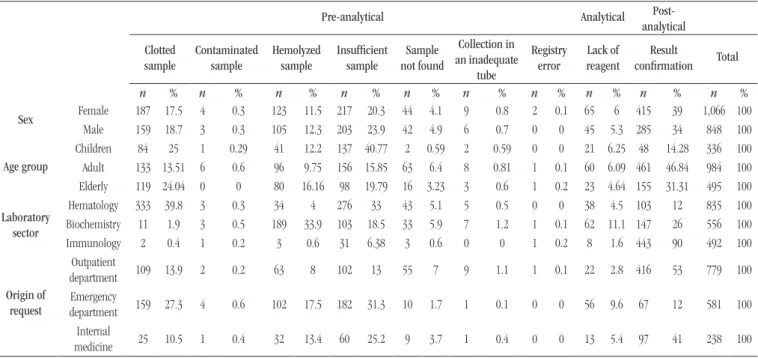
TABLE 2 − Distribution of reasons for repeat collections regarding sex, age group, laboratory sector, and origin of request that showed the highest frequency rates
Pre-analytical Analytical
Post-analytical
Clotted sample
Contaminated sample
Hemolyzed sample
Insufficient sample
Sample not found
Collection in an inadequate
tube
Registry error
Lack of reagent
Result
confirmation Total
n % n % n % n % n % n % n % n % n % n %
Sex Female 187 17.5 4 0.3 123 11.5 217 20.3 44 4.1 9 0.8 2 0.1 65 6 415 39 1,066 100
Male 159 18.7 3 0.3 105 12.3 203 23.9 42 4.9 6 0.7 0 0 45 5.3 285 34 848 100
Age group
Children 84 25 1 0.29 41 12.2 137 40.77 2 0.59 2 0.59 0 0 21 6.25 48 14.28 336 100
Adult 133 13.51 6 0.6 96 9.75 156 15.85 63 6.4 8 0.81 1 0.1 60 6.09 461 46.84 984 100
Elderly 119 24.04 0 0 80 16.16 98 19.79 16 3.23 3 0.6 1 0.2 23 4.64 155 31.31 495 100
Laboratory sector
Hematology 333 39.8 3 0.3 34 4 276 33 43 5.1 5 0.5 0 0 38 4.5 103 12 835 100
Biochemistry 11 1.9 3 0.5 189 33.9 103 18.5 33 5.9 7 1.2 1 0.1 62 11.1 147 26 556 100
Immunology 2 0.4 1 0.2 3 0.6 31 6.38 3 0.6 0 0 1 0.2 8 1.6 443 90 492 100
Origin of request
Outpatient
department 109 13.9 2 0.2 63 8 102 13 55 7 9 1.1 1 0.1 22 2.8 416 53 779 100
Emergency
department 159 27.3 4 0.6 102 17.5 182 31.3 10 1.7 1 0.1 0 0 56 9.6 67 12 581 100 Internal
medicine 25 10.5 1 0.4 32 13.4 60 25.2 9 3.7 1 0.4 0 0 13 5.4 97 41 238 100
Recollection orders decreased in 2014. The pre-analytical step represented most of the orders. The main reasons for recollection were result conirmation, insuficient sample, coagulated sample, and hemolyzed sample.
Regarding gender, orders are equally distributed between both sexes. Observing the distribution between age groups, most orders were placed for adults, elderly people and children.
Concerning the laboratory sector and the origin of the request, most request frequencies are distributed among the sectors of hematology, biochemistry, and immunology, coming from the outpatient clinic, emergency, and internal medicine departments.
The most frequent variables previously cited were investigated as to the reasons for the recollection order. According to sex, the most common reason was result conirmation (39% for women, 34% for men), followed by insuficient sample (20.3% for women, 23.9% for men), and clotted sample (17.5% for women, 18.7% for men). The other six reasons amount to less than 20% for
both sexes (Table 2).
According to age group, the main reason for recollection in children was insuficient sample (40.77%). Result conirmation represented the highest percentage of reasons for adults (46.84%) and the elderly (31.31%).
The main reasons for recollection ordered by the hematology sector was clotted sample (39.8%), and insuficient sample (3%); for biochemistry, hemolyzed sample (33.9%), insuficient sample (18.5%), and lack of reagent (11.1%); for immunology, result conirmation (90%).
Samples from the outpatient department had as the main reason result conirmation (53%). For the other departments, such as emergency, insuficient sample represented 31.3% of reasons; and clotted sample, 27.3%. In internal medicine, the reason result conirmation had a 41% index, and insuficient sample, a 25.2%.
DISCUSSION
The rate of repeat collections is very close to that of other studies reporting 0.54% and 0.57%(9, 10). They are considered
low when compared with the 2.7% of a recent study, in which 55.8% of rejections were caused by sample clotting(11). There are
no acceptability limits described in the literature(6), but, in the
current study, the decreased number of recollection orders in 2014, when compared to 2013, may be explained by the use of automated equipment (BC-ROBO-888 Techno Medica®),
which was installed in the laboratory in 2014. This instrument performs specimen labeling in the blood collection room and reinforces data observed during the automated pre-analytical processes using barcodes, what drastically reduces errors associated with this phase(12).
impact, the study revealed that errors in the pre-analytical phase may produce up to 1.2% of the total costs of a hospital(13).
The most frequent causes of pre-analytical errors described in the literature are incorrect identiication of the patient (49.3%), hemolyzed sample (19.5%), clotted sample (14.2%), and insuficient volume (13.7%)(14). Except for the irst cause, not
analyzed in this study because it is not listed in inclusion criteria, all the others relected what happened in the DF laboratory. This allows concluding that regardless of the differences between laboratories, the main reported problems are similar.
Each of these three variables has great potential to negatively inluence the quality of laboratory results. Hemolyzed samples may be consequence of shaking the tubes during transport, storage at incorrect temperatures or for long periods, or even by the use of narrow bore needles(15). Improper mixing of tubes may result in
sample clotting; besides, clots may clog equipment and analysis
instruments(16). Collection of an inadequate volume may also
cause blood clotting. For the anticoagulant to perform the expected action, it is necessary that the proportion of blood/anticoagulant is according to the tube manufacturers’ recommendations. Moreover, insuficient sample volumes may preclude the conduction of all
the ordered tests(13).
As could be observed, the criteria adopted by the laboratory do not consider the steps of selection, exam order and patient preparation. For some authors, these steps are not part of a pre-analytical phase, but of a “pre-pre-pre-analytical” one(17). A study
carried out in the USA investigated the reasons for sample rejection in steps prior to collection. Based on a questionnaire answered by patients, the main reasons were observed to be inadequate fasting (32.2%), and test order missing information (22.5%). Specimens dificult to draw, patients leaving collection area before collection, and other reasons represent the remaining 45.3%(18). It was
possible to note that the reasons do not comprise all the steps of the pre-analytical phase. Specimens were not reported as to barcodes (absent or illegible), adequacy of the collection tube, time between collection and analysis, preservation and transport conditions. A detailed control of the sample pathway, including the involved variables, will provide precise failure detection(2, 11).
Two steps of the post-analytical phase were not considered: result interpretation and appropriate action. Such steps are sometimes classiied as parts of the “post-post-analytical” phase(19). The non-adoption of these steps in the rejection
criteria of the studied laboratory (reasons for recollection) is understood by the fact they are not part of routine of laboratory professionals, but of other hospital professionals, such as doctors and nurses.
The analysis of the other variables in relation to their recollection reasons allowed observing that distribution between sexes was homogeneous, and supposing that the high frequency of insuficient samples in children may be related to dificult drawing and/or low cooperation of pediatric patients.
Concerning sectors, hematology and biochemistry have, in the studied laboratory, the highest load of tests to be analyzed. This could be a hypothesis to explain the high frequency of recollection orders. Nevertheless, when analyzing the distribution of orders according to reasons, one notices that in the hematology sector the most common cause was clotted sample, and in the biochemistry, hemolized sample; both reasons are part of the pre-analytical phase, common to both sectors. These notiied errors may be avoided by corrective actions in the phase before analysis, that is, at the phlebotomy moment.
The immunology sector, on the other hand, has as its main reason the result conirmation, which is part of the post-analytical phase. This can be explained by the requirements of a Ministry of Health directive regarding the procedures for detection of anti-human immunodeiciency virus (HIV) antibodies in subjects aged over 2 years. According to the low chart of the directive annex II, up to four samples may be collected so that the report can be
released(20).
The low frequency of recollection orders in the emergency sector of the laboratory deserves special attention. Given the routine speed and the adversities that interfere with sample collection of patients from this sector, underreporting of recollection orders is believed to have occurred. A study investigating just the indices of sample rejection from the emergency sector pointed to an index of recollection order of 3.19%, and hemolysis of 65.39% as main
reason(21). The only two reports observed in the emergency sector
of the DF laboratory had as the main reason “insuficient sample”. Unlike what was observed in the DF laboratory, in a study carried out in India, the outpatient department had the lowest percentage of errors in relation to other sectors of the hospital. It is relevant to observe that such a study took into consideration just the pre-analytical phase. When considering just this phase, the laboratory of the current study also presented low error rates, and this may be the result of the automated collection of outpatient specimens(22).
CONCLUSION
for managers. In the case of clinical analysis, the use of QIs is fundamental. They are a managerial tool whose aim is the continuous improvement of all the analyzed steps. Those pointed out in this study will be able to help the laboratory staff in corrective measures, monitoring and improvement of
REFERENCES
1. Anonychuk A, Beastall G, Shorter S, Kloss-Wolf R, Neumann P. A framework for assessing the value of laboratory diagnostics. Healthcare Management Forum [Internet]. 2012; 25: S4-S11. Available at: http:// hmf.sagepub.com/content/25/3_suppl/S4.full.pdf.
2. Lundberg GD. Adding outcome as the 10th step in the brain-to-brain laboratory test loop. Am J Clin Pathol [Internet]. 2014 Jun; 141(6): 767-9. Available at: http://ajcp.ascpjournals.org/cgi/content/long/.
3. Ministério da Saúde. Agência Nacional de Vigilância Sanitária. Resolução RDC nº 302, de 13 de outubro de 2005. Dispõe sobre regulamento técnico para funcionamento de laboratórios clínicos. Brasília: Diário Oicial da União da República Federativa do Brasil; 14 out. 2005.
4. Plebani M, Carraro P. Mistakes in a stat laboratory: types and frequency. Clin Chem [Internet]. 1997 Aug; 43(8 Pt 1): 1348-51. Available at: http:// www.clinchem.org/content/43/8/1348.long.
5. Carraro P, Plebani M. Errors in a stat laboratory: types and frequencies 10 years later. Clin Chem [Internet]. 2007 Jul; 53(7): 1338-42. Available at: http://www.clinchem.org/content/53/7/1338.long.
6. Vieira KF, Shitara ES, Mendes ME, Sumita NM. A utilidade dos indicadores da qualidade no gerenciamento de laboratórios clínicos.
the process. Even so, there is no quality improvement without cooperation from the staff, especially in the steps of the pre-analytical phase, which involve a great number of professionals. Promoting change demands effort and motivation from the involved ones.
RESUMO
Introdução: Os resultados dos testes laboratoriais influenciam mais de 60% das decisões médicas, impactando na prevenção, no diagnóstico e no tratamento de doenças. O uso de indicadores de qualidade (IQs) é fundamental para a garantia da qualidade, pois permite monitoramento do processo e direciona a implementação de ações corretivas. Objetivo: Classificar pedidos de recoleta de amostras biológicas para identificação de IQs em um laboratório de análises clínicas do Distrito Federal. Material e métodos:
Foram coletados e analisados dados acerca de pedidos de recoleta feitos no biênio 2013-2014. Resultados e discussão: Das 304.361 amostras registradas, 1.914 (0,62%) tiveram solicitação de recoleta de acordo com os critérios do laboratório. A maioria dos pedidos teve origem na fase pré-analítica (57,7%). O motivo de rejeição mais frequente foi confirmação de resultado (40,7%), seguido por amostra insuficiente (21,9%), amostra coagulada (18,1%) e amostra hemolisada (11,9%). O setor de hematologia foi o responsável pelo maior número de pedidos de recoletas (43,6%), seguido pelo de bioquímica (29%) e o de imunologia (25,7%). O setor de emergência do laboratório representou apenas 0,1%. Quanto à procedência, a maioria das recoletas foi solicitada pelo ambulatório (40,7%), pelo pronto-socorro (30,4%) e pela clínica médica (12,4%). A porcentagem de pedidos de recoleta é baixa, porém não exclui a necessidade de busca por menores índices. Sugere-se que tenha ocorrido subnotificação no setor de emergência do laboratório, o que aponta necessidade de melhoria no registro de informações. Conclusão: Os números destacados foram selecionados como IQs para a fase pré-analítica, servindo como norteadores para as futuras ações corretivas efetuadas pela equipe.
Unitermos: controle analítico de qualidade; melhoria de qualidade; gestão de qualidade.
J Bras Patol Med Lab [Internet]. 2011 Jun; 47(3): 201-10. Available at: http://www.scielo.br/pdf/jbpml/v47n3/v47n3a02.pdf.
7. Plebani M. The detection and prevention of errors in laboratory medicine. Ann Clin Biochem [Internet]. 2010 Mar; 47(Pt 2): 101-10. Available at: http://acb.sagepub.com/content/47/2/101.long.
8. Ministério da Saúde. Vigilância Alimentar e Nutricional – SISVAN. Orientações para a coleta, o processamento, a análise de dados e a informação em serviços de saúde. Brasília; 2004.
9. Bhat V, Tiwari M, Chavan P, Kelkar R. Analysis of laboratory sample rejections in the pre-analytical stage at an oncology center. Clin Chim Acta [Internet]. 2012 Aug 16; 413(15-16): 1203-6. Available at: http:// www.sciencedirect.com/science/article/pii/S0009898112001684. 10. Guimarães AC, Wolfart M, Brisolara MLL, Dani C. Causes of rejection of blood samples handled in the clinical laboratory of a University Hospital in Porto Alegre. J Bras Patol Med Lab [Internet]. 2012 Jan; 45(1-2): 123-6. Available at: http://www.sciencedirect.com/science/article/pii/ S0009912011026956.
12. Oliveira GL, Lippi G, Salvagno GL, et al. Does laboratory automation for the preanalytical phase improve data quality? J Lab Autom [Internet]. 2013 Oct; 18(5): 375-81. Available at: http://jla.sagepub.com/ content/18/5/375.long.
13. Green SF . The cost of poor blood specimen quality and errors in preanalytical processes. Clin Biochem [Internet]. 2013 Sep; 46(13-14): 1175-9. Available at: http://www.sciencedirect.com/science/article/pii/ S0009912013002786.
14. Salvagno GL, Lippi G, Bassi A, Poli G, Guidi GC. Prevalence and type of pre-analytical problems for inpatients samples in coagulation laboratory. J Eval Clin Pract [Internet]. 2008 Apr; 14(2): 351-3. Available at: http:// onlinelibrary.wiley.com/doi/10.1111/j.1365-2753.2007.00875.x/abstract; jsessionid=47743A6203EDB0C693C189EA4EE5CED9.f03t02.
15. Carraro P, Servidio G, Plebani M. Hemolyzed specimens: a reason for rejection or a clinical challenge? Clin Chem [Internet]. 2000 Feb; 46(2): 306-7. Available at: http://www.clinchem.org/content/46/2/306. long.
16. Baumann N. QC notes at each phase of the analytical process are explored. Advance for Administrators of the Laboratory. 2011; 20: 37-41. 17. Carraro P, Zago T, Plebani M. Exploring the initial steps of the testing process: frequency and nature of pre-preanalytic errors. Clin Chem [Internet]. 2012 Mar; 58(3): 638-42. Available at: http://www.clinchem. org/content/58/3/638.long.
18. Dale JC, Novis DA. Outpatient phlebotomy success and reasons for specimen rejection. Arch Pathol Lab Med [Internet]. 2002 Apr; 126(4): 416-9. Available at: http://www.archivesofpathology.org/doi/10.1043/0003- 9985(2002)126%3C0416:OPSARF%3E2.0.CO;2?url_ver=Z39.88-2003&rfr_id=ori:rid:crossref.org&rfr_dat=cr_pub%3dpubmed. 19. Laposata M, Dighe A. “Pre-pre” and “post-post” analytical error: high-incidence patient safety hazards involving the clinical laboratory, Clin Chem Lab Med [Internet]. 2007; 45(6): 712-9. Available at: http://ovidsp.tx.ovid.com/sp-3.16.0a/ovidweb. cgi?T=JS&PAGE=fulltext&D=ovft&AN=00115728-200745060-00004&NEWS=N&CSC=Y&CHANNEL=PubMed.
20. Ministério da Saúde. Secretaria de Vigilância Sanitária. Portaria nº 488, de 17 de junho de 1998. Dispõe sobre a padronização de procedimentos para testes de HIV. Brasília: Diário Oicial da União da República Federativa do Brasil; 1998.
21. Vernoski BK. Effect of blood collection practices on emergency department blood specimen rejection rates. 2013. [dissertation]. UNF Theses and Dissertations, University of North Florida; 2013. Available at: http://digitalcommons.unf.edu/cgi/viewcontent. cgi?article=1361&context=etd.
22. Goswami AP, Roy DSS, Goswami NN. Evaluation of specimen rejection rate in hematology laboratory. IOSR-JDMS [Internet]. 2014 Sep; 13(9): 1-4. Available at: http://www.iosrjournals.org/iosr-jdms/papers/Vol13-issue9/Version-3/A013930104.pdf.
CORRESPONDING AUTHOR
Thaís A. C. Lamounier