Contents lists available atScienceDirect
Journal of Alloys and Compounds
j o u r n a l h o m e p a g e :w w w . e l s e v i e r . c o m / l o c a t e / j a l l c o m
Structural properties study of the magneto-dielectric composite: Cr
0.75
Fe
1.25
O
3
(CRFO):Fe
0.5
Cu
0.75
Ti
0.75
O
3
(FCTO)
H.H.B. Rocha
a,c,e, F.N.A. Freire
b,c,e, R.R. Silva
c,d,e, D.X. Gouveia
d,e, J.M. Sasaki
a,d,e,
M.R.P. Santos
c,d,e, J.C. Góes
c,e, A.S.B. Sombra
c,e,∗aDepartamento de Engenharia Metalúrgica e de Materiais, Universidade Federal do Ceará CEP 60455-760, Fortaleza, Ceará, Brazil bDepartamento de Química Orgânica e Inorgânica, Universidade Federal do Ceará CEP 60455-760, Fortaleza, Ceará, Brazil
cLaboratório de Telecomunicac¸ões e Ciência e Engenharia dos Materiais (LOCEM), Departamento de Física, Universidade Federal do Ceará Caixa Postal 6030,
CEP 60455-760, Fortaleza, Ceará, Brazil
dDepartamento de Física, Universidade Federal do Ceará, Caixa Postal 6030, CEP 60455-760, Fortaleza, Ceará, Brazil eCentro Federal de Educac¸ão Tecnológica CEP 60040-531, Fortaleza, Ceará, Brazil
a r t i c l e
i n f o
Article history:
Received 30 December 2008
Received in revised form 26 February 2009 Accepted 2 March 2009
Available online 14 March 2009
PACS:
77.84.Lf 61.10.Nz 68.37.Hk 61.18.Fs
Keywords:
Ceramic-matrix composites (CMCs) Physical properties
a b s t r a c t
The structural properties of a magneto-dielectric composite based on the polycrystalline phases (Cr0.75Fe1.25O3) CRFO100 and (Fe0.5Cu0.75Ti0.75O3) FCTO100, synthesized by the mixed oxide solid-state
reaction methodology, have been investigated in this paper. The constituent phases, as well their com-posite series (Cr0.75Fe1.25O3)[W]–(Fe0.5Cu0.75Ti0.75O3)[100−W], forW= 0, 17, 34, 50, 66, 83 and 100, were
characterized by X-ray diffraction (XRD), scanning electron microscopy (SEM), energy-dispersive X-ray spectroscopy (EDXS), and57Fe Mössbauer spectroscopy techniques. The identification and subsequent
refinement of XRD data revealed for CRFO100 and FCTO100 trigonal and cubic structures, respectively. The Mössbauer spectra related to the composites signalize a probable paramagnetic doublet due to FCTO100 phase, and a magnetic sextet due to CRFO100 phase, both associated with Fe3+in octahedral coordination.
© 2009 Elsevier B.V. All rights reserved.
1. Introduction
The demands for miniaturization in the microwave (MW) communication technologies require continuing discovery and development of new materials[1–3]. Fabrication of microwave ceramics with high relative dielectric permittivity (εr) and
satisfac-tory thermo-stability together with small dielectric losses in wide temperature and frequency range is an actual problem since the application of such materials in the microwave technology ensures reduction of mass and overall dimensions of microwave circuit[4]. A combined study of both the crystal structure and the electro-physical properties of novel compounds is necessary for the development of new advanced materials[4]. Physical properties
∗ Corresponding author at: Laboratório de Telecomunicac¸ões e Ciência e
Engen-haria dos Materiais (LOCEM), Departamento de Física, Universidade Federal do Ceará C.P. 6030, CEP 60455-760, Fortaleza, Ceará, Brazil. Tel.: +55 85 33669340; fax: +55 85 33669333.
E-mail address:[email protected](A.S.B. Sombra).
URL:http://www.locem.ufc.br (A.S.B. Sombra).
of a material depend upon the microstructures. Hypothetically, by controlling the microstructure, materials can be designed (or opti-mal selected instead, in agreement with[5]), according to desirable properties[6].
The ferrimagnetic yttrium iron garnet (YIG:Y3Fe5O12) is a
mag-netic material used extensively in microwave devices such as circulators, oscillators and phase shifters. This ferrite possesses controllable saturation magnetization, low dielectric loss tangent (tanı) in microwave region and small linewidth (H) in ferrimag-netic resonance[7]. Since its discovery in 1956, YIG remains the best microwave material in the 1–10 GHz band. Garnets are so well known materials that compositions for a given specification can be designed numerically[8].
The polycrystalline ceramic Cr0.75Fe1.25O3 (CRFO100) is a
member of hematite (␣-Fe2O3) and eskolaite (Cr2O3) system
((CrXFe1−X)2O3,X= 0.375 indicates CRFO100). Hematite and
esko-laite were classified as anti-ferromagnetic insulators [9]and as high-resistivity magnetic semiconductors with electric conductiv-ity similar to that of Cu2O[10,11]. They present a continuous solid
solution in the entire concentration range ((CrXFe1−X)2O3, 0≤X≤1) [12–16], what is exceptional in the group of corundum oxides[9].
Both the end members of the series are anti-ferromagnetically ordered at room temperature (␣-Fe2O3 below Néel temperature
TN= 682◦C, Cr2O3 TN= 27◦C), however the spin ordering in these
oxides has different symmetry and is markedly weaker in Cr2O3
[9]. Mössbauer spectroscopy results are reported for complete con-centration range (0≤X≤1)[9].
The solid solution Fe0.5Cu0.75Ti0.75O3(FCTO100) belongs to the
bixbyite family Fe2YCu1−YTi1−YO3(0.15≤Y≤0.33,Y= 0.25 specifies
FCTO100), essentially a copper titanates iron-substituted system, isotypic with the (Fe, Mn)2O3compounds[17].
Both CRFO100 and FCTO100 original phases under investigation have been “designed” based on the yttrium iron garnet stoichiom-etry (Y3Fe5O12) (“ ” symbolizes theoretical chemical equivalence
between compounds, not structural):
Y3Fe5O12 Cr3Fe5O12 Cu3(Ti3Fe2)O12 (1)
Cr3Fe5O12 Cr0.75Fe1.25O3 (2)
Cu3(Ti3Fe2)O12 Cu0.75Ti0.75Fe0.5O3 (3)
CRFO100 and FCTO100 and their composites had their struc-ture characterized through X-ray diffraction (XRD), scanning electron microscopy (SEM), and Mössbauer spectroscopy. Addi-tionally, the synthesis and processing of CRFO100 and FCTO100 polycrystalline/ceramics through solid-state method are reported. Consequently, the study of structural properties of CRFO100, FCTO100 and their composites is a significant stage to conjecture about their possible applications in microwave (MW) and radiofre-quency (RF) technology, owing to their potential suitable magnetic and dielectric properties.
2. Experimental methods
Accordingly, CRFO100 and FCTO100 polycrystalline samples were synthesized by conventional solid-state method. The raw materials (oxides) were accurately weighed: Fe2O3(Aldrich, 99 + %) and Cr2O3(Reagent, 99.8%) for CRFO100, and Fe2O3
(Aldrich, 99 + %), CuO (CRPQ, 99%) and TiO2(Aldrich, 99.9 + %) for FCTO100. The
start-ing materials were hand-grounded in an agate mortar and pestle. Prior to the first heat treatment, high-energy ball milling of the two hand-grounded powders mix-tures were carried out via planetary ball mill (Fritsch Pulverisette 6). The rotation speed of the disks carrying two independent sealed vials containing the reagents related to both CRFO100 and FCTO100 phases was 400 rpm. Milling of powder sam-ples was done at room temperature (RT∼298 K) in stainless steel vials (volume ∼110 mL) using 20 stainless steel balls (4 g and 10 mm diameter). The mechanical
milling operation had lasted 60 min. This operation was performed just to provide an improved homogeneity for the mixture of reagents.
Subsequently, the mixtures were calcined (first heat treatment) in conventional controlled furnaces (Rapid Temp Furnace/Eurotherm 2404 and EDG1800/EDGCON 3P) at 1570 K for 5 h to synthesize CRFO100, and at 1260 K for 5 h to synthesize FCTO100, both in atmospheric air.
Thus, CRFO100 and FCTO100 synthesized polycrystalline phases were randomly combined to process the CRFOW’ composites, where ‘W’ is the wt.% (wt.%) of CRFO100 and ‘100−W’ is the complementary wt.% of FCTO100; hence, forW= 100
we have (CRFO100);W= 83 (CRFO83);W= 66 (CRFO66);W= 50 (CRFO50);W= 34 (CRFO34);W= 17 (CRFO17);W= 0 (FCTO100).
After the calcination, about 5 wt.% of an organic binder, together with a slight amount of Bi2O3–B2O3sintering aid (2 wt.%), was added to the polycrystalline phases
to produce the ceramics. The powders were uniaxially pressed (270 MPa) into green bodies pellets in a steel die.
The composites pellets, whose typical dimensions were 4.4 mm in diameter and 2 mm in thickness, were sintered at 1020 K for 4 h in atmospheric air. The CRFO100 pellet was sintered at 1380 K for 24 h, and the FCTO100 pellet was sintered at 1180 K for 24 h, in atmospheric air, without the binder and the sintering aid. The poly-crystalline powder of all samples suffered the same thermal treatment as their corresponding pellets.
2.1. X-ray diffraction
The X-ray powder diffraction profiles of the samples were filed by means of a powder X-ray diffractometer system Rigaku D/max-B, composed of an X-ray genera-tor, X-ray optics, goniometer, X-ray detector and counting system, and a recorder for data recording/storing[18]. Powdered samples were fixed on a silicon plate with sil-icon paste. Patterns were collected at laboratory temperature (about 294 K) with Cu K␣radiation. The diffractometer was operated at 40 kV and 25 mA in Bragg–Brentano
Table 1
CRFO100 structural parameters.
Atom Site X y z B Occupancies
Fe1 12c 0.00000 0.00000 0.35297 1.86211 0.625 Cr1 12c 0.00000 0.00000 0.35297 1.86211 0.375 O1 18e 0.69568 0.00000 0.25000 1.90035 1.000
Table 2
FCTO100 structural parameters.
Atom Site x y z B Occupancies
Cu1 8b 0.25000 0.25000 0.25000 2.54529 0.375 Ti1 8b 0.25000 0.25000 0.25000 2.54529 0.375 Fe1 8b 0.25000 0.25000 0.25000 2.54529 0.250 Cu2 24d −0.03539 0.00000 0.25000 1.69461 0.375
Ti2 24d −0.03539 0.00000 0.25000 1.69461 0.375
Fe2 24d −0.03539 0.00000 0.25000 1.69461 0.250
O1 48e 0.38223 0.16667 0.39028 2.25159 1.000
geometry, with 0.02◦(2) step size and 2 s count time, along angular range from 20◦ to 90◦(2).
Currently, Rietveld’s powder structure refinement analysis[19–21]of X-ray pow-der diffraction data is commonly applied to refine structural parameters, such as atomic coordinates (x,y,z), lattice parameters (a,b,c), isotropic thermal parameters (B), etc. The Rietveld’s software DBWS-9807a[22]is specially designed for struc-tural parameters refinement through a least squares method, which minimizes the difference between observed and simulated powder diffraction patterns. In present work, we assumed a pseudo-Voigt (pV) peak shape function with asymmetry. The background of each pattern was fitted by a polynomial function of degree 5. Refine-ments were conducted without refining the anysotropic atomic thermal parameters neither the site occupancies (Occ), but the latter, which is related to the phases stoichiometry, are presented in (Tables 1 and 2).
The minimization was carried out by observing the evolution of the index parametersRWP(weighted residual error) and Durbin–Watsond-statisticdDW. The
refinement continues till convergence is reached, with the value of the quality factor Goodness of fit (SGoF) very close to 1 (varies between 1.16 and 1.37), which confirms
the good quality of the refinement.
2.2. Scanning electron microscopy
The scanning electron microscopy combined with the energy-dispersive anal-ysis employed in the study of ceramics is generally of morphological interest. By scanning an electron probe across a specimen, high resolution images of the speci-men with very high magnifications can be obtained. Additionally, the compositional analysis of a material can be performed by monitoring secondary X-rays produced by electron–specimen interaction. Thus, the superficial microstructure observation and compositional analysis of the as-sintered cylindrical specimens, covered with a thin layer of carbon, were carried out by scanning electron microscopy, through scanning electron microscope Phillips XL-30 equipped with EDXS detector (EDAX-CDU Leap Detector).
2.3. 57Fe Mössbauer spectroscopy
Mössbauer spectra were experimentally obtained via standard transmission geometry, employing a constant acceleration spectrometer with a radioactive source of57Co in Rh matrix. Measurements on powdered samples were carried out at
lab-oratory temperature (about 294 K). The spectra were evaluated using the Normos fitting routine, which makes use of a set of curves (Lorentzian), and computes the contribution of each curve to the total absorption spectrum, through the least square procedure. All isomer shifts (ı) refer to metallic iron (␣-Fe).
3. Results and discussion
3.1. Rietveld analysis
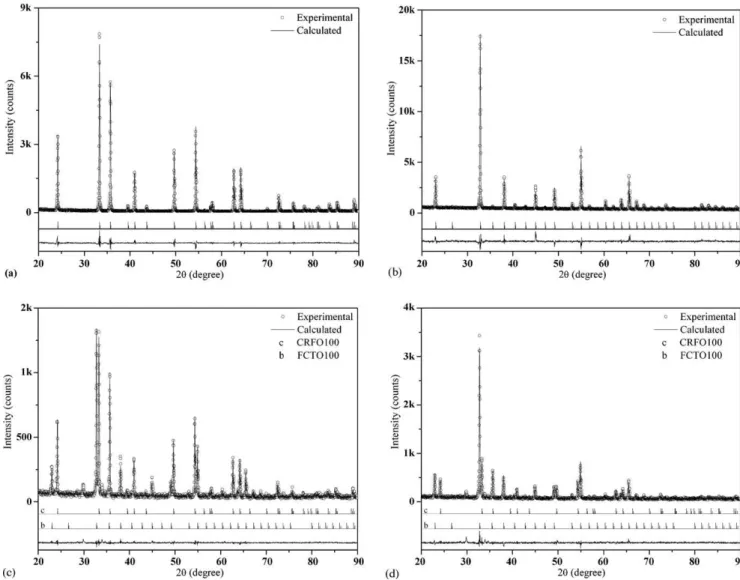
The XRD patterns of ‘CRFOW’ (W= 100, 83, 66, 50, 34, 17, 0) polycrystalline samples are shown in Fig. 1. Prior to apply the Rietveld procedure, a crystallographic model based on iron oxide
[23]and on chromium oxide[24]was proposed for CRFO100, and a crystallographic model based on a member of the copper titanate iron-substituted system[17]was considered for FCTO100.
It is suggested that CRFO100 presents at RT a trigonal struc-ture belonging toR3c(#167) spatial group, with six molecules per unity cell (Z= 6). In this proposed structure the iron and chromium are localized both in the 12c Wyckoff Position, and the oxygen ion occupies the 18e site (Table 1). The refinement graphical result is illustrated inFig. 2a.
Fig. 2b shows the result for the FCTO100 refinement. It was revealed at RT a probable cubic structure, belonging toIa3 (#206) space group, with 16 molecules per unit cell (Z= 16). In this structure the copper, titanium and iron are alternate localized in 8b and 24d Wyckoff positions, and oxygen is in 48e site (Table 2). The refine-ments results carried out for CRFO100 and FCTO100 specimens are reported onTable 3.
Table 3
Crystallographic data for CRFO100 and FCTO100.
CRFO100 FCTO100
Crystal system Trigonal Cubic
Space group R3c(no. 167) Ia3 (no. 206)
Cell parameters a= 5.0171 Å,c= 13.6432 Å a= 9.4375 Å
Volume 297.409 Å3 840.563 Å3
Z 6 16
calc 5.254 g cm−3 5.043 g cm−3
RP 8.14 4.5
RWP 11.04 5.88
SGof 1.37 1.35
dDW 0.71 0.8
In the composites (CRFOW,W= 83, 66, 50, 34, 17) XRD patterns, is noticeable the presence of extra peaks at 29.88◦; 33.98◦and 34.74◦
(2), probably associated to the sintering aid employed in the sinter-ing procedure, or due to lateral reactions between reactants. These impurity phases were not identified and, thus, not involved in the refinement procedures. Essentially, the composites XRD patterns exhibit the original CRFO100 and FCTO100 phases XRD patterns.
InFig. 2c and d is shown the graphical criteria for the global view of the CRFO66 and CRFO34 composites, in this sequence. The graphical criteria of the compositesW= 83, 50, 17 were carried out but will not be presented in this work.
The numerical criteria of fit considered here (RWP,dDWandSGoF)
have their results reported inTable 4. In addition,RPis presented
but not discussed. From a purely mathematical point of view,RWPis
the most meaningful of theR’s because the numerator is the resid-ual being minimized[21]. Based on this criterion, the refinement
Table 4
Numerical criteria of fit.
Sample RP RWP SGof dDW
CRFO83 11.8 16.61 1.25 1.01
CRFO66 10.31 14.07 1.16 1.31
CRFO50 9.66 13.03 1.17 1.28
CRFO34 9.19 12.18 1.22 1.07
CRFO17 8.03 11.18 1.21 1.19
associated to the phase FCTO100 showed the best results. The value of the Durbin–Watsond-statistic (dDW) shows the serial correlation
of the refinement, where an ideal value should be around 2[25–28], indicative of insignificant serial correlation in the refinement pro-cess. The results suggest a significant serial correlation, probably associated with the presence of slight amount of impurities (extra phases). Conversely, the obtained values forSGoFaround 1.0 indicate
the adequacy of the proposed models, which justify the procedure for structural elucidation.
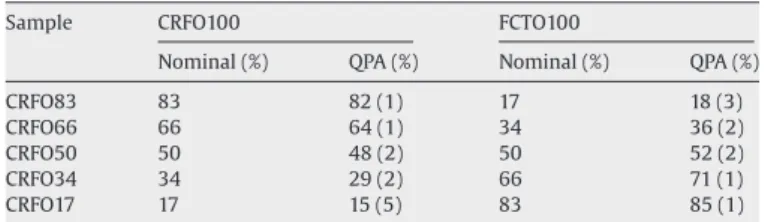
The quantitative phase analysis (QPA), without internal standard, of composite samples obtained from the refinement pro-cedure is described inTable 5. It is noticeable that the comparison between stoichiometric (nominal) and experimental (QPA) wt.% concentration is in good agreement. Hence, Rietveld’s method was effectively applied to the determination of quantitative phase abun-dances in the composites. Thus, this could be taken as an additional evidence of refinement worth. As stated before, it should be noted that in this procedure only CRFO100 and FCTO100 phases were con-sidered. The existence of extra peaks possibly due to the sintering aid, lateral reactions between reactants, or even remaining phases (the raw material), should be the reasons for the discrepancies
Table 5
Comparison between the stoichiometric (nominal) and analytical (QPA) concentra-tions (wt%).
Sample CRFO100 FCTO100
Nominal (%) QPA (%) Nominal (%) QPA (%)
CRFO83 83 82 (1) 17 18 (3)
CRFO66 66 64 (1) 34 36 (2)
CRFO50 50 48 (2) 50 52 (2)
CRFO34 34 29 (2) 66 71 (1)
CRFO17 17 15 (5) 83 85 (1)
observed in the results. In a previous work[29], also connected with the structural properties, we investigated how the iron con-centration influenced the dielectric properties of the original solid solutions (CRFO100 and FCTO100), as well their composites, in the RF range.
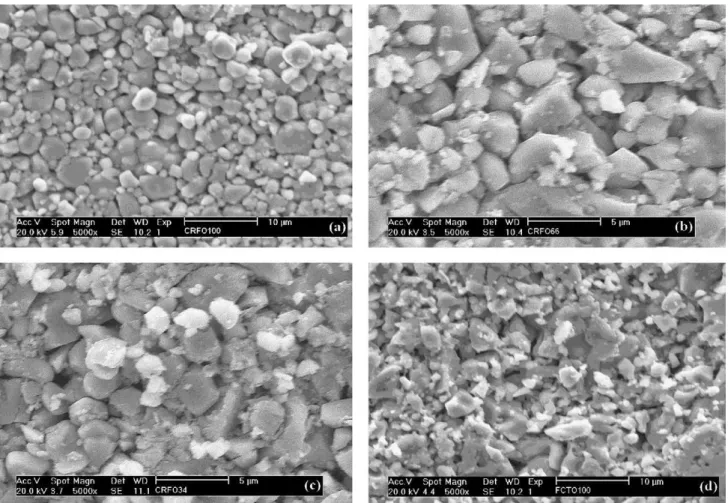
3.2. Scanning electron microscopy
The scanning electron micrographs in Fig. 3a–d show the as-sintered surface of CRFO100, CRFO66, CRFO34 and FCTO100 ceramics, respectively. In CRFO100 (Fig. 3a) sample, there is a con-siderably diversity of morphologies, predominantly aggregates and polygonal shapes. In CRFO66 (Fig. 3b) and CRFO34 (Fig. 3c) sam-ples, grains with polygonal shapes, along with an evidently wide size distribution, are observed. FCTO100 (Fig. 3d) presents grains randomly distributed. As a general rule, the micrographs observed make evident distortions and non-uniform grain sizes.
InFig. 4andTable 6we have the electron-dispersive X-ray anal-ysis (EDXS) for all samples under investigation. In EDXS analanal-ysis, the peaks associated with the main elements of composites, i.e., iron, chromium, copper, titanium, and oxygen, were observed. Bis-muth and carbon low-level intensity peaks are pointed out inFig. 4
(*Bismuth; +carbon).
InTable 7are listed the values of each element in the compos-ites by means of EDXS, for both stoichiometric (nominal) and EDXS (analytical) concentrations of specimens. The information collected from EDXS analysis proposes a successful agreement between nom-inal and analytical concentrations.
Fig. 4.EDXS spectra of CRFOW bulks (W= 100, 83, 66, 50, 34, 17, 0).
3.3. 57Fe Mössbauer spectra
The experimental data were fitted through a transformed pat-tern method related to magnetic hyperfine field and quadrupole splitting, in order to investigate the influence due to a great number of iron microenvironments, supposed regular in ‘CRFOW’ composites. A set of 60 Lorentzians was included to fit the experi-mental data.Figs. 5 and 6a and bshow the Mössbauer spectra, the
Table 6
Listing of samples elements and their corresponding lines and energy.
Element Ti Ti O Cr Cr Fe Fe Cu Cu Ti Ti Cr Cr Fe Fe Cu Cu
Line L␣ L K␣ L␣ L L␣ L L␣ L K␣ K K␣ K K␣ K K␣ K
Energy (keV) 0.45 0.46 0.53 0.57 0.58 0.71 0.72 0.93 0.95 4.53 4.95 5.41 5.95 6.41 7.06 8.04 8.90 Sample
CRFO100 X X X X X X X X X
CRFO83 X X X X X X X X X X X X X X X X X
CRFO66 X X X X X X X X X X X X X X X X X
CRFO50 X X X X X X X X X X X X X X X X X
CRFO34 X X X X X X X X X X X X X X X X X
CRFO17 X X X X X X X X X X X X X X X X X
FCTO100 X X X X X X X X X X X X X
*Bismuth. +Carbon.
Table 7
Compositional analysis: nominal vs. analytical (EDXS). Element Wt. %
CRFO100 CRFO83 CRFO66 CRFO50 CRFO34 CRFO17 FCTO100
NOM EDXS NOM EDXS NOM EDXS NOM EDXS NOM EDXS NOM EDXS NOM EDXS
Cu – – 5.1 5.1 10.2 9.0 14.9 13.9 19.7 18.0 24.8 23.5 29.9 30.5
Ti – – 3.8 3.2 7.7 6.9 11.3 9.5 14.9 13.2 18.7 18.3 22.5 23.9
Cr 24.9 26.0 20.6 22.9 16.4 17.5 12.4 15.3 8.5 11.5 4.2 4.2 – –
Fe 44.5 47.8 39.9 42.5 35.3 35.9 31.0 33.0 26.7 29.9 22.1 21.1 17.5 17.7
Table 8
Hyperfine parameters.
Sample Average of QUA over the distribution Average ofBHFover the distribution
(mm/s) ı(mm/s) BHF(T) ı(mm/s)
CRFO100 – – 49.8 (0.3) 0.45
CRFO83 1.1 (0.1) 0.41 47.7 (0.1) 0.39
CRFO66 1.0 (0.6) 0.43 47.6 (0.1) 0.39
CRFO50 1.0 (0) 0.42 47.6 (0.2) 0.39
CRFO34 1.1 (0.4) 0.42 47.7 (0.2) 0.38
CRFO17 1.1 (0.3) 0.42 48.1 (0.2) 0.39
FCTO100 1.1 (0) 0.35 – –
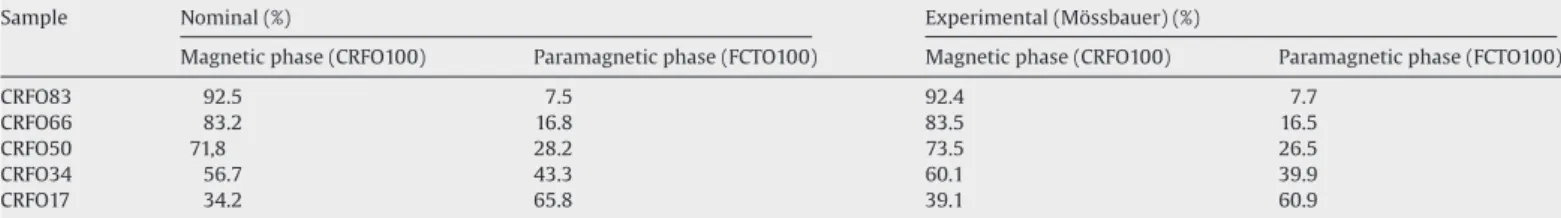
Table 9
Areas (A) of the fitted curves relative to the magnetic phases.
Sample Nominal (%) Experimental (Mössbauer) (%)
Magnetic phase (CRFO100) Paramagnetic phase (FCTO100) Magnetic phase (CRFO100) Paramagnetic phase (FCTO100)
CRFO83 92.5 7.5 92.4 7.7
CRFO66 83.2 16.8 83.5 16.5
CRFO50 71,8 28.2 73.5 26.5
CRFO34 56.7 43.3 60.1 39.9
CRFO17 34.2 65.8 39.1 60.9
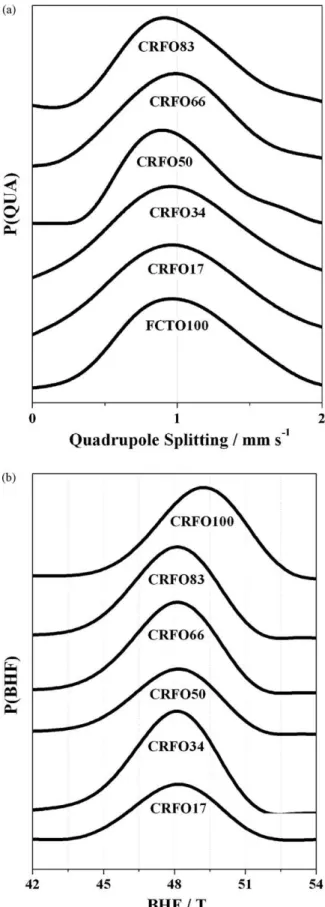
Mössbauer (hyperfine) parameters quadrupole splitting () and magnetic hyperfine field (BHF) distributions, respectively. Theand BHFaverages, along with the isomer shift (ı), are listed inTable 8.
As observed for the original synthesized phases, the adjusted Mössbauer results comprise distinct and unique spectra: a mag-netic sextet for CRFO100, presumable anti-ferromagmag-netic, and a doublet for FCTO100, probably paramagnetic. Considering all the composites spectra, there is an obvious juxtaposition of a sextet
Fig. 5.Room temperature (294 K) Mössbauer spectra of CRFOW polycrystalline pow-ders (W= 100, 83, 66, 50, 34, 17, 0).
with a doublet, proportional to the concentration of the Fe ion-probe in each composite, evaluated by the areas (A) under these spectra, and listed inTable 9. This supports the premise of distin-guishable composite structure, related to the ideal absence of other phases than the original ones.
The quadrupole splitting () (Fig. 6a) is useful to elucidate the coordination number since a distorted tetrahedral site is characteristically less symmetric than a distorted octahedral site. Consequently, differentvalues can be obtained. In terms of the asymmetry (skewness), a slightly elongated tail is observed at the right segment of the curve that would be expected in a nor-mal distribution (positive-skewed), more noticeable for CRFO83 and CRFO50, which means that the mass of the distribution is concentrated on the left of these curves. In practice, these dis-tortions are not sufficient to change the structural properties of Cr0.75Fe1.25O3:Fe0.5Cu0.75Ti0.75O3composites.
Since the isomer shift (ı) and quadrupole splitting () are corre-lated with the coordination number of iron in different compounds, a comparative analysis between these hyperfine parameters can be carried out to resolve the Fe3+coordination. Iron state (high spin
(HS) or low spin (LS)) also could be correlated to its coordination number. This introduces moderated analytical difficulties due to possible overlap betweenıandvalues for Fe2+and Fe3+
depend-ing on the iron spin state occurrence (high or low spin). Accorddepend-ing to Dyar [30], Fe3+ ions in an octahedral coordination [Fe3+(VI)]
presentıwith values ranging from 0.35 to 0.55 mm/s, whereas for a tetrahedral coordination [Fe3+(IV)] theıvalue ranges from 0.20
to 0.30 mm/s. For Fe2+ions,ıvalues below 1.0 mm/s are
associ-ated with tetrahedral coordination [Fe2+(IV)], andıvalues above
1.0 mm/s are in connection with octahedral coordination [Fe2+(VI)].
For all specimen investigated, regarding toıvalues, it is proposed that the iron is in the Fe3+oxidation state (Table 8) and in octahedral
coordination.
The magnetic hyperfine field (BHF) of the CRFO100 sample
(Fig. 6b) indicates that its most probable values range from 45 to 52.5 T, being ı= 0.45 mm/s. It is suggested that CRFO100 sample presents aBHFassociated with the magnetic hyperfine interaction
being consistent with the spin ordering (typical of the hematite). The CRFO100 spectrum (Fig. 6b) exhibits a more rounded peak with wider “shoulders”, characteristic of a low kurtosis distribu-tion[31,32]. For all others samples (CRFOW,W= 83, 66, 50, 34, 17) (Fig. 6b), the most probableBHFvalues range from 43.5 to 52 T. This
Fig. 6.(a) Quadrupole splitting field distributions for samples associated toFig. 5
andTable 8. (b) Hyperfine magnetic field distributions for samples associated toFig. 5andTable 8.
these samples remains similar to that of CRFO100. The decrease in theBHFvalues with the increase of the FCTO100 concentration is
probably associated to an increase related to the interaction dis-tance between the magnetic crystallites in the composites.
4. Conclusions
The original phases and their composites (Cr0.75Fe1.25O3) CRFO[W]–(Fe0.5Cu0.75Ti0.75O3)FCTO[100−W],withWranging from 0
to 100 wt.%, were prepared by the mixed oxide solid-state reac-tion methodology, and had their structural properties explored by X-ray diffraction (XRD), scanning electron microscopy (SEM) with energy-dispersive X-ray Spectroscopy (EDXS) and57Fe Mössbauer
spectroscopy.
The CRFO100 phase possesses a trigonal structure related to the space groupR3m(#167). FCTO100 phase has cubic structure pertaining to the spatial groupIa3 (#206).
The refinement of all the composites was carried out and dis-cussed. A quantitative phase analysis (QPA) of the samples, obtained from the refinement procedure, showed good agreement compared to nominal values for the composite specimen investigated.
As a rule, the micrographs observed reveal distortions and non-uniform grain sizes, as well a considerable morphological diversity. Corroborating the quantitative phase analysis (QPA), the EDXS pro-vided satisfactory results between the nominal and experimental values for specimens.
The Mössbauer spectra show the presence of a sextet and a dou-blet for the composite samples, due to CRFO100 (magnetic sextet) and for FCTO100 (doublet) concentrations. The magnetic order and the magnetic properties of the original constituents apparently are conserved in the composites, i.e., the CRFO and FCTO phases are preserved. The Mössbauer results support previous XRD results.
Acknowledgements
The authors would like to thank the reviewers for their insight-ful comments and suggestions. This work was partially supported by Coordenac¸ão de Aperfeic¸oamento de Pessoal de Nível Supe-rior (CAPES), Fundac¸ão Cearense de Apoio ao Desenvolvimento Científico e Tecnológico (FUNCAP), Conselho Nacional de Desen-volvimento Científico e Tecnológico (CNPq), and the U.S. Air Force Office of Scientific Research (AFOSR) (FA9550-08-1-0210).
References
[1] W.-F. Su, S.-C. Lin, J. Eur. Ceram. Soc. 23 (2003) 2593–2596.
[2] C.-L. Huanga, C.-F. Tasi, Y.-B. Chen, Y.-C. Cheng, J. Alloys Compd. 453 (2008) 337–340.
[3] S. Solomon, H.P. Kumar, L. Jacob, J.K. Thomas, M.R. Varma, J. Alloys Compd. 461 (2008) 675–677.
[4] E.A. Nenasheva, N.F. Kartenko, J. Eur. Ceram. Soc. 21 (2001) 2697–2701. [5] M. Jansen, J.C. Schön, Nat. Mater. 3 (2004) 838.
[6] S. Bid, S.K. Pradhan, Mater. Chem. Phys. 84 (2004) 291–293.
[7] H. Zhao, J. Zhou, Y. Bai, Z. Gui, L. Li, J. Magn. Magn. Mater. 280 (2004) 208–213. [8] M. Pardavi-Horvarth, J. Magn. Magn. Mater. 215–216 (2000) 171–183. [9] T. Grygar, P. Bezdiˇcka, J.D. D˘edeˇcek, E. Pretovsk ´y, O. Schneeweiss, Ceramics 47
(2003) 32–39.
[10] S. Onari, T. Arai, K. Kudo, Phys. Rev. B 16 (1977) 1717–1721. [11] E.A. Moore, Phys. Rev. B 76 (2007) 195107.
[12] G. Busca, G. Ramis, M.C. Prieto, V.S. Escribano, J. Mater. Chem. 3 (1993) 665–673. [13] S. Musi´c, M. Lenglet, S. Popovi´c, B. Hannoyer, I. Czakó-Nag, M. Ristica´c, D. Balzar,
F. Gashi, J. Mater. Sci. 31 (1996) 4067–4076.
[14] S. Benny, R. Grau-Crespo, N.H. de Leeuw, Phys. Chem. Chem. Phys. 11 (2009) 808–815.
[15] T. Grygar, P. Bezdiˇcka, E.G. Caspary, J. Electrochem. Soc. 146 (1999) 3234–3238. [16] H.E.V. Steinwehr, Kristallogr 125 (1967) 377–403.
[17] P. Mouron, P. Odier, J. Choisnet, J. Solid State Chem. 60 (1985) 87–94. [18] The Rigaku Journal 17 (2000) 10.
[19] H.M. Rietveld, Acta Crystallogr. 22 (1967) 151–152. [20] H.M. Rietveld, J. Appl. Crystallogr. 2 (1969) 65–71.
[22] R.A. Young, A. Sakthivel, T.S. Moss, C.O. Paiva-Santos, J. Appl. Crystallogr. 28 (1995) 366–367.
[23] G.K.H. Rozenberg, L.S. Dubrovinsky, M.P. Pasternak, O. Naaman, T. Le Bihan, R. Ahuja, Phys. Rev. B 65 (2002) 064112.
[24] M. Baster, F. Bouree, A. Kowalska, Z. Latacz, J. Alloys Compd. 296 (2000) 1–5. [25] J. Durbin, G.S. Watson, Biometrika 37 (1950) 409–428.
[26] J. Durbin, G.S. Watson, Biometrika 38 (1951) 159–178.
[27] J. Durbin, G.S. Watson, Biometrika 58 (1971) 1–19. [28] R.J. Hill, H.D. Flack, J. Appl. Crystallogr. 20 (1987) 356–361.
[29] H.H.B. Rocha, F.N.A. Freire, M.R.P. Santos, J.M. Sasaki, T. Cordaro, A.S.B. Sombra, Physica B: Cond. Matter 403 (2008) 2902–2909.
[30] M.D. Dyar, Am. Mineral. 70 (1985) 304–316.