Culicidae Community Composition and
Temporal Dynamics in Guapiaçu Ecological
Reserve, Cachoeiras de Macacu, Rio de
Janeiro, Brazil
Jeronimo Alencar1
*, Cecilia Ferreira de Mello1, Anthony Érico Guimarães1, Hélcio R. Gil-Santana1, Júlia dos Santos Silva2, Jacenir R. Santos- Mallet2, Raquel M. Gleiser3
*
1Instituto Oswaldo Cruz (Fiocruz), Laboratório de Diptera, Manguinhos, Rio de Janeiro, Brazil,2Instituto Oswaldo Cruz (Fiocruz), Laboratório de Transmissores de Leishmanioses, Manguinhos, Rio de Janeiro, Brazil,3Centro de Relevamiento y Evaluación de Recursos Agrícolas y Naturales-Instituto Multidisciplinario de Biología Vegetal (Consejo Nacional de Investigaciones Científicas y Técnicas—Universidad Nacinal de Córdoba, CONICET-UNC), Facultad de Ciencias Agropecuarias, and Cátedra de Ecología, Facultad de Ciencias Exactas, Físicas y Naturales, Universidad Nacional de Córdoba, Córdoba, Argentina
*[email protected](JA);[email protected](RMG)
Abstract
A temporal observational study was conducted of the Culicidae fauna in a remnant area of Atlantic Forest within a private reserve (Guapiaçu Ecological Reserve-REGUA) presenting typical vegetation cover of dense rain forest, with some patches recovering a floristic com-position similar to that of the original community. Research was carried out to analyze the in-fluence of climatic factors (mean monthly temperature, rainfall, and air relative humidity) on the temporal dynamics of the mosquito communities that occur in the reserve. The com-pleteness of the mosquito inventory was assessed with individual-based rarefaction-extrapolation curves. Differences in species composition between sites and months were tested with PERMANOVA. True diversities of orders 0, 1, and 2 (effective numbers) were estimated and compared between sites, months, and years. Multiple stepwise regressions were used to assess relationships between climatic variables, measures of diversity, and abundances of the most common species. There were significant interactive effects be-tween year and site on measures of diversity. However, diversity estimates showed little variation among months, and these were weakly correlated with climatic variables. Abun-dances of the most common species were significantly related to temperature or relative hu-midity, but not rainfall. The presence of mosquito species known to be vectors of human diseases combined with an intermittent flow of visitors to the study area suggests there is a risk of disease transmission that warrants further monitoring.
a11111
OPEN ACCESS
Citation:Alencar J, de Mello CF, Guimarães AE, Gil-Santana HR, Silva JdS, Santos- Mallet JR, et al. (2015) Culicidae Community Composition and Temporal Dynamics in Guapiaçu Ecological Reserve, Cachoeiras de Macacu, Rio de Janeiro, Brazil. PLoS ONE 10(3): e0122268. doi:10.1371/journal. pone.0122268
Academic Editor:Alex Córdoba-Aguilar,
Universidad Nacional Autonoma de Mexico, MEXICO
Received:July 12, 2014
Accepted:February 16, 2015
Published:March 27, 2015
Copyright:© 2015 Alencar et al. This is an open access article distributed under the terms of the
Creative Commons Attribution License, which permits unrestricted use, distribution, and reproduction in any medium, provided the original author and source are credited.
Data Availability Statement:All relevant data are within the paper.
Introduction
The Atlantic Forest of South America is ranked among the world’s top biodiversity hotspots.
Stretching along the Atlantic coastline from northeast Brazil to Uruguay, only 7% of the origi-nal forest area still remains. It has been extensively modified, and within Brazil, reduced to 7.8% of its original cover. This ecosystem is one of the most endangered in the world, second only to the severely threatened forests of Madagascar, off the east coast of the African continent
[1]. About 5–12% of the remaining area of the Atlantic Forest, including legally protected
areas, is composed of relatively small forest fragments [2].
A rich diversity of species from the Culicidae family (Order: Diptera) with considerable spa-tial variability in composition has been recorded in the Atlantic Forest. For example, 22 species
were collected from bromeliads belonging to the generaNidulariumandVriseain Serra do
Mar [3]; 91 taxa were recorded in degraded and remnant forests in the Municipality of São
Paulo, Brazil [4], and 31 mosquito species belonging to 12 genera were collected in Nova
Iguaçu Natural Park, Rio de Janeiro [5]. The Atlantic forest is topographically complex, which
creates a diverse array of microclimates and environmental conditions that may affect the availability and suitability of mosquito habitats, resulting in substantial spatial variation in
Culicidae assemblages within this ecoregion [6], [3], [5].
The study of mosquitoes in natural areas is of considerable importance due to their role in
pathogen transmission to humans and other vertebrates [7] and the potential to identify as yet
unknown habitats of these disease vectors [8]. Knowledge of mosquito community
composi-tion is of fundamental importance in areas where the environment has suffered or is suffering anthropic disturbances. The composition and diversity of mosquito communities may influ-ence disease transmission, either decreasing disease risk through mechanisms such as
competi-tion for hosts among vector and non-vector species [9], or facilitating the spread of disease due
to factors such as nested ectoparasite-vector host networks [10]. Improved knowledge of
culi-cid populations can only be achieved if the systematics and ecology of the group are both stud-ied. The aim of this study was to document temporal changes in the distribution of mosquito species from the Guapiaçu Ecological Reserve, Cachoeiras de Macacu, Rio de Janeiro, Brazil, and investigate the influence of seasonally variable climatic factors (temperature, relative hu-midity and rainfall) on species abundances and diversity.
Materials and Methods
Ethics statement
All research was performed in accordance with scientific license number 34911 provided by SISBIO/IBAMA for the capture of culicids throughout the Brazilian national territory.
Study area
Mosquito collections were made in the Guapiaçu Ecological Reserve (REGUA), a Private Natu-ral Heritage Reserve that was created in 1996 and contains about 7,385 ha of dense rain forest. The reserve has a great wealth of pioneer species in its lower and peripheral areas, culminating in climax communities in its highest parts. Altitude ranges from 30 to 2000 m above sea level, and part of the reserve area, particularly that above 700 m, is covered by largely unmodified forests hosting a large diversity of plants and animals. Over 80% of the reserve is above 400 m and is part of the Three Peaks State Park, located in the central corridor of the Serra do Mar, Atlantic Forest biome.
Vegetation in REGUA is characterized as dense rain forest, consisting of three vegetation types: the lower part consists of dense alluvial rain forest and pasture that has been reverting to Competing Interests:The authors have declared
forest for the past seven years; coastal plains, lowlands, and lower mountain slopes with dense
rain forest and areas that have been reforested for 3–5 years; and dense submontane and
mon-tane rain forest covering the rugged mountainous areas [11]. The latter holds mature forest
that was used as a reference in reforestation programs. The soils of the study area are classified as Fluvisol, Oxisol, and Cambisol on the plains, gently undulating slopes, and hills, respectively.
In the large Guapi-Macacu watershed (Guapiaçu and Macacu rivers), Pinheiro [12] suggested
the occurrence of other soil classes. In hilly areas there is a predominance of red-Oxisols; areas with rugged, rocky outcrops have Haplic Cambisols and Entisols; yellow and red-yellow Argi-sols and Haplic PlanoArgi-sols can be found in alkaline massifs; and Fluvic Neossolos and GleyArgi-sols predominate in hydromorphic areas.
Two sampling sites were established: Site A was located in the lower parts of the study area in flat terrain presently covered by pasture and 7-year-old regenerated forest. It is adjacent to the reserve administration, in an area featuring wetlands that were revegetated in 2005. The seedlings used for revegetation were mostly produced with genetic material sourced from forest remnants within the reserve itself, supplemented with seedlings from nurseries in the area. Na-tive species were planted with random distributions. Random mixtures of pioneer, early, and late secondary, and climax species were used, with pioneers making up the largest proportion. This was done to avoid spatial homogeneity in community composition. Exotic fruiting species were also planted in order to attract frugivorous birds. Site B was located in the submontane zone, in the highest part of the study area, overlooking hilly and rugged terrain. The forest is dense and highly diverse submontane and montane rain forest, comprising three strata:
emer-gent trees (reaching to about 45 m high), the main canopy (5–10 m in height), and understory
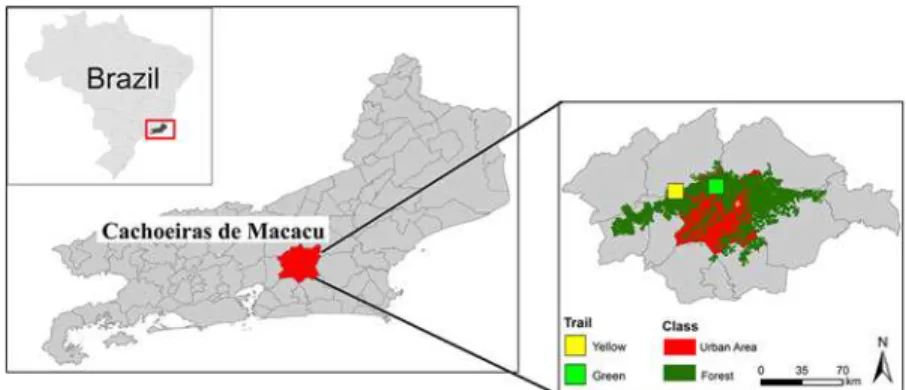
vegetation [13]. Geographical coordinates of the sampling sites were obtained using a Garmin
GPSmap 60CS GPS. Maps were prepared in Arcview10 and edited in Adobe Photoshop CS5
and CorelDraw X5. The sampling locations are shown inFig. 1.
Culicid sampling took place once every two months (at approximately the same day of the month) for two years, from February 2012 to January 2014, for three consecutive nights, with each sampling running from 6:00pm to 10:00am. Mosquitoes were collected using two types of
light trap: automatic CDC (Center for Disease Control) and Shannon [14], with the aid of an
oral suction tube. Light traps are a standard method for sampling mostly crepuscular and noc-turnal mosquitoes. Although there is variation in the degree to which different mosquito spe-cies (or populations of a spespe-cies from different geographic regions) are attracted to light traps, this method is considered to provide the least biased samples of aerial mosquito populations
[15]. For data analysis, captures from both trap types were pooled.
Fig 1. a: Location in Brazil; b: State of Rio de Janeiro; c: Guapiaçu Ecological Reserve (REGUA), with sampling sites A and B marked.
Species determinations were performed by direct observation of morphological characters using a stereomicroscope (ZEISS Stemi SV6) and, when necessary, optic microscope examina-tion of key morphological characteristics of individuals mounted on microscope slides (e.g.,
male genitalia). Species identifications were based on dichotomous keys by Lane [16], Faran
and Linthicum [17], Consoli and Lourenço-de-Oliveira [18], and Forattini [19]. For species of
the Aedini tribe, we followed the policy of the Journal of Medical Entomology and considered Ochlerotatusto be a subgenus ofAedes[20], as opposed to the taxonomy proposed by Reinert
[21], which endowsOchlerotatuswith genus status. All mosquito samples were then deposited
in the Entomological Collection of the Oswaldo Cruz Institute, under the title“Atlantic Forest
Collection”.
Monthly mean measurements of air relative humidity, temperature (maximum, minimum, and average offset) and monthly rainfall were obtained from the National Meteorology Insti-tute of Brazil (INMET). For each site and sampling date, variations in temperature and relative humidity were measured every hour using a thermo-hygrometer (Oregon Scientific,
RMR132HG), fixed 1 m above ground level. Comparisons between field collected data and data provided by INMET did not show significant differences, and thus INMET data were used in the analysis.
Data analyses
To verify the completeness of the mosquito inventory, a species accumulation curve was gener-ated for each site, using individual-based interpolation (rarefaction) and extrapolation (up to double the lowest number of individuals recorded at either site) from reference samples (total
number of individuals collected at each site) using the multinomial model (S(est)) [22] in
Esti-mateS software [23] (i.e., the expected number of species represented among m individuals,
given the reference sample). Richness estimates, standard errors, and 95% confidence intervals were calculated. Further, considering that the performance of richness estimators varies among
data and cases [24], [25], the following well-known species richness estimators (diversity of
order 0) were assessed using SPADE software [26]: Chao1-bc (a bias-corrected form of Chao1,
[27]) and ACE-1 (a modified non-parametric abundance-based coverage estimator for highly
heterogeneous communities [28]). Rare species were defined as those for which fewer than 10
individuals were collected. The number of species common to both sites and the number of spe-cies expected if sample size was increased were estimated using the concept of sample coverage
[29] and SPADE software (200 bootstrap replications used to obtain the standard error
esti-mate). The squared coefficient of variation of species abundance (CV) was estimated to charac-terize the degree of heterogeneity among species abundances; when all species have equal
abundances, CV is zero, and is positively correlated with the degree of heterogeneity [30].
To test for differences in species composition between sampling sites and among months, a non-parametric multivariate analysis of variance (PERMANOVA) with 10,000 permutations based on Bray-Curtis distances was used. To visualize differences in multivariate patterns among observations, non-metric multidimensional scaling (nMDS) was performed on the
Bray-Curtis distances (Past software, [31]).
In addition to species richness (diversity of order 0), other measures of species diversity were
estimated: Shannon’s index and associated effective number of species (diversity of order 1, or
Shannon diversity, based on the Chao & Shen estimator [30]), and Simpson’s index and
associ-ated effective number of species (diversity of order 2, or Simpson diversity, based on a minimum
variance unbiased estimator—MVUE). Differences between sites were assessed with t-tests.
months (February, April, June, August, October, and December) (Infostat software [32]). Mos-quito abundance, Shannon Diversity (diversity of order 1), and Simpson Diversity (diversity of order 2) were assumed to be Poisson log distributed, while species richness (diversity of order 0) was assumed to be Gaussian distributed. The threshold for assessing significant differences
was set at p<0.05.
Relationships between average monthly climatic variables from the same or previous month as mosquito collection (rainfall, maximum, and minimum temperature, and relative humidity) and abundances and measures of diversity of the eight most abundant species (Aedes (Ochlero-tatus) scapularis(Rondani, 1948),Anopheles (Nyssorhynchus) albitarsisLynch Arribálzaga,
1878,Culex(Melanoconion)bastagariusDyar and Knab, 1906,Cx. (Culex)declaratorDyar
and Knab, 1906,Cx. (Cux.) usquatusDyar, 1918,Coquillettidia venezuelensis(Theobald, 1912),
Mansonia (Mansonia) titillans(Walker, 1848), andMa. (Man.) wilsoni(Barreto and Coutinho, 1944)) were assessed with multiple stepwise regression (Stepwise in InfoStat software), with
p0.15 as the criterion for retaining variables.
Results
A total of 3,289 individual mosquitoes were collected during the two year sampling period, of
which 3,170 (96.4%) were identified to the species level (Table 1). The identities of the
remain-ing 3.6% could only be determined to the genus level because of damage to the relevant mor-phological characteristics. Most specimens were collected using CDC light traps (3,092); only
197 individuals were collected with Shannon traps, and none of these at site B.Table 2
summa-rizes the species collected by site and trap type. The mosquitoes captured belonged to 48 species
from 14 genera:Aedeomyia(0.4%),Aedes(5.22%),Anopheles(5.7%),Coquillettidia(10.9%),
Culex(58.9%),Haemagogus(0.1%),Limatus(1%),Mansonia(11.3%),Psorophora(0.3%), Rhunchomyia(1%),Sabethes(0.2%),Trichoprosopon(0.2%),Uranotaenia(3.4%), and
Wyeo-myia(0.8%). The most frequently captured species wasCx. bastagarius(21.7%), followed by
Cx. usquatus(17.4%),Cx. declarator(15.6%), andMa. titillans(5.9%).
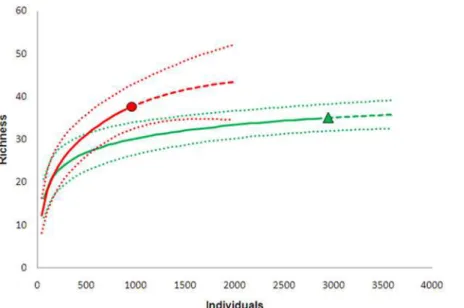
Species richness at each site was estimated using the total number of mosquitoes collected
from each site as samples (Fig. 2andTable 3). At site A, 35 species were observed, closely
matching expected species richness based on Chao1-bc (37 species) and ACE-1 (40 species) es-timates; 11.4% of the sample consisted of species for which only a single specimen was collect-ed. At Site B, 37 species were observed, 27.0% of which were collected only once; the Chao 1-bc
estimate was 43 species and that of ACE-1 51 species (Table 3). Thus, following Colwell [23] it
was considered that the samples obtained provided adequate representations of species diversi-ty at both sites. Furthermore, sampling efficiency was estimated to be 0.999 for site A and 0.989 for site B, meaning that the probability of finding additional species with further sampling was
less than 1%. Colwell et al. [22] suggested that extrapolation is conservatively reliable only up
to double the reference sample size. Consequently, results of rarefaction-extrapolations were compared between sites A and B at 1800 individuals, which is the double the lowest number of individuals captured at either site (site B). There was a 6.8% overlap in the 95% confidence
in-tervals around the species accumulation curves between sites (Fig. 2). Following the
conserva-tive overlap criterion proposed by Colwell et al. [22] it was inferred that species richness did
not differ significantly between sites.
In total, 24 species were common to both sites, 6 of which were rare (each totaling 10 or
fewer individuals). CV values for each site were relatively high (Table 2), reflecting high
hetero-geneity in species abundances in the communities of both sites. Based on the ACE-shared model, which allows for heterogeneous discovery probabilities of species occurring at multiple
Table 1. Absolute values (N) of mosquito species collected in the Guapiaçu Ecological Reserve, Cachoeiras de Macacu, Rio de Janeiro, Brazil, in the period from February 2012 to January 2014.
Year 2012 2013 2014
Month Feb Apr Jun Aug Oct Nov Dec Feb Apr May Jun Aug Oct Dec Jan Total
Ad. (Ady.) squamipennis(Lynch Arribalzaga),
1878 1 10 1 1 1 1 15
Ae. (Och.)fluviatilis(Lutz), 1904 1 1 1 3
Ae. (Och.) rhyacophilusCosta Lima, 1933 1 1 17 19
Ae. (Och.) scapularis(Rondani),1948 11 4 7 23 38 6 4 2 9 104
Ae. (Och.) serratus(Theobald), 1901 22 1 1 27 1 52
Ae. (Pro.) terrens(Walker),1856 14 1 1 16
Ae. (Stg.) albopictusSkuse, 1984 1 1 1 3
An. (Nys.) albitarsisLynch-Arribalzaga, 1878 7 1 1 63 13 23 7 2 6 123
An. (Nys.) evansae(Brethes), 1926 1 37 1 6 3 48
An. (Nys.) minorDa Costa Lima, 1929 2 2
An. (Nys.) triannulatus(Neiva and Pinto),
1922
1 1 12 9 23
Cq. (Rhy.) albicosta(Peryassu), 1908 2 2 36 2 42
Cq. (Rhy.) chrysonotum(Peryassu), 1922 1 1
Cq. (Rhy.) juxtamansonia(Chagas), 1907 16 1 4 1 41 10 19 2 94
Cq. (Rhy.) fasciolata(Lynch Arribalzaga),
1891 4 1 1 9 56 10 19 100
Cq. (Rhy.) venezuelensis(Theobald, 1912) 2 1 36 20 38 25 17 1 140
Cx. (Cux.) bidensDyar, 1922 4 6 10
Cx. (Cux.) declaratorDyar and Knab, 1906 29 7 8 4 6 74 59 13 218 30 8 36 19 511
Cx. (Cux.) quinquefasciatusSay, 1823 2 1 2 5
Cx. (Cux.) usquatusDyar, 1918 38 14 6 4 5 87 40 8 256 30 17 53 15 573
Cx. (Mcx.) imitatorTheobald, 1903 2 1 3
Cx. (Mel.) bastagariusDyar and Knab, 1906 2 88 206 5 60 243 110 313 76 1103
Cx. (Cux.)sp1 6 1 43 4 37 20 2 113
Cx. (Cux.)sp2 4 21 3 20 2 50
Hg. (Hag.) capricorniiLutz, 1904 1 1
Hg. (Hag.) leucocelaenus(Dyar and
Shannon),1924 1 1
Li. durhamiiTheobald, 1901 7 4 6 17
Li.flavisetosusOliveira Castro, 1935 8 7 15
Ma. (Man.) indubitansDyar and Shannon,
1925 3 3
Ma. (Man.) titillans(Walker), 1848 12 10 165 6 3 196
Ma. (Man.) wilsoni(Barreto and Coutinho),
1944
1 10 10 127 2 7 18 4 179
Ps. (Jan.) ferox(Von Humboldt), 1819 7 1 1 1 10
Rh. (Run.) frontosa(Theobald), 1903 6 6
Rh. (Run.) reversaLane and Cerqueira, 1942 2 5 6 3 1 1 2 1 7 1 1 30
Sa. (Sbn.) intermediusLutz, 1904 1 1 2 1 2 7
Tr. (Tri.) digitatum(Rondani), 1848 2 1 2 5
Tr. (Tri.) pallidiventer(Lutz), 1905 1 1
Ur. (Ura.) calosomataDyar and Knab, 1907 35 1 5 1 3 45
Ur. (Ura.) geometricaTheobald, 1901 1 2 10 13
Ur. (Ura.) lowiiTheobald, 1901 2 2
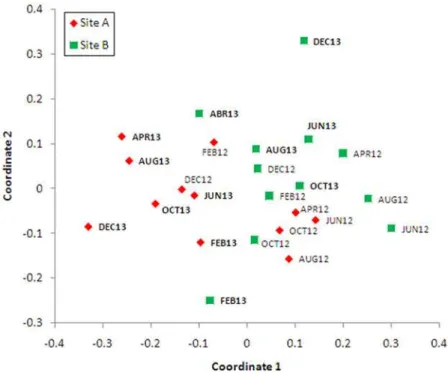
(shared species = 27.52±11.2; 95% CI: 24.0–62.7). PERMANOVA analysis detected significant
differences in species composition between sites (F = 1.91; p<0.05) but not months (F = 0.94;
p = 0.57). Sites A and B were clustered separately in two dimensional ordination space when species abundances from different months and sites were analyzed using NMDS; Site A mostly
grouped to the left side of the graph (Fig. 3).
GLMs assessing differences in abundance and diversity between sites showed significant
in-teractive effects between year and site on mosquito abundance (p<0.001), species richness (as
estimated with ACE-1) (p<0.004), and diversity of order 1 (p<0.001), but no significant effects
of site (p = 0.37) or year (p = 0.16) on diversity of order 2. Mosquitoes were more abundant at
site A than site B, and in 2013 compared to 2012 (Table 4). More species were collected at site
A in 2013 and at site B in 2012. The lowest richness recorded was at site B in 2013. The effective numbers of species detected both at site B in 2012 and at site A in 2013 were approximately twice that at site B in 2013.
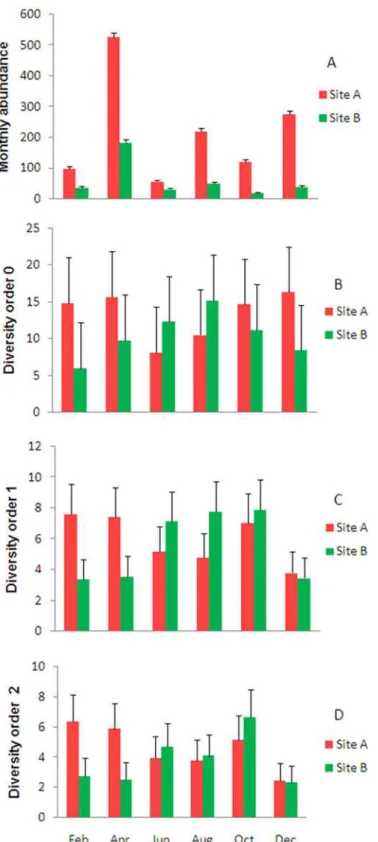
There was also a significant interactive effect between month and site on mosquito
abun-dance (p<0.001). The highest mosquito numbers were recorded in April and December, in
which there were significantly more mosquitoes at site A than B. The lowest mosquito numbers were in October (site B) and June (site A). No significant effects of month or site were detected
on measures of diversity (Fig. 4). Correlations between measures of diversity and climatic
vari-ables were mostly weak and non-significant: both Shannon and Simpson indices of diversity
were significantly related to monthly rainfall (p<0.01 each), which was the only variable
tained in these models; the models explained only 23% and 25% of the variation in the data, re-spectively. Mosquito abundance, on the other hand, was significantly related to monthly maximum temperature in the month prior to sampling, explaining 22% of the variation in the
data (Table 5).
Stepwise linear regression analysis of variables influencing abundances of the eight most fre-quent species resulted in bivariate models in which minimum temperature and maximum
tem-perature in the previous month explained 44% of the variation inAn. albitarsisabundance, and
minimum temperature in the same and previous month explained 53% of the variation inMa.
Titillansabundance. Forty-seven percent of the variation inAe. scapularisabundance was
ex-plained by minimum temperature in the previous month, and 33% of that ofCx. usquatusby
maximum temperature.Cx. bastagariusandMa. wilsoniabundances were related to relative
humidity in the previous month, resulting in univariate models that explained 29% and 31% of Table 1. (Continued)
Year 2012 2013 2014
Month Feb Apr Jun Aug Oct Nov Dec Feb Apr May Jun Aug Oct Dec Jan Total
Ur. (Ura.) nataliaeLynch Arribalzaga, 1891 7 1 8
Ur. (Ura.) pulcherrimaLynch Arribalzaga,
1891 1 15 4 21 4 7 52
Wy. (Den.) luteoventralisTheobald, 1901 1 1
Wy. (Pho.) edwardsi(Lane and Cerqueira),
1942
2 1 1 1 3 3 11
Wy. (Pho.)flabellata(Lane and Cerqueira),
1942
1 1 2
Wy. (Pho.) muehlensiPetrocchi, 1927 1 1
Wy. (Tri.) aporonomaDyar and Knab, 1906 2 1 4 3 2 12
Wy. (Wye.) pertinans(Williston), 1896 2 2
Total 143 25 54 25 25 220 245 126 1395 138 122 515 254 385 101 3773
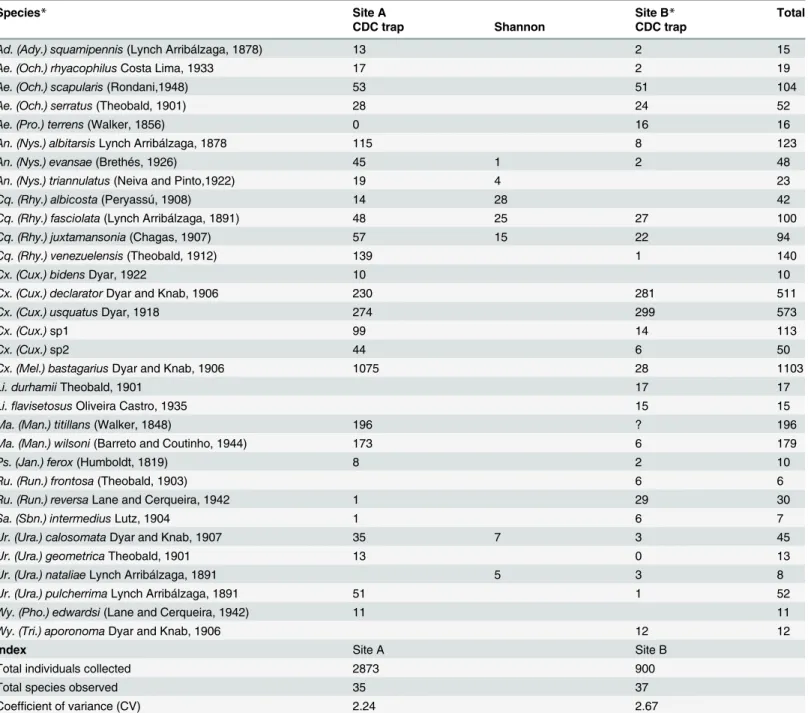
Table 2. Total numbers of adult mosquito specimens collected from February 2012 to January 2014, in two sites in Guapiaçu Ecological Reserve (REGUA), Rio de Janeiro using CDC and Shannon traps.
Species* Site A Site B* Total
CDC trap Shannon CDC trap
Ad. (Ady.) squamipennis(Lynch Arribálzaga, 1878) 13 2 15
Ae. (Och.) rhyacophilusCosta Lima, 1933 17 2 19
Ae. (Och.) scapularis(Rondani,1948) 53 51 104
Ae. (Och.) serratus(Theobald, 1901) 28 24 52
Ae. (Pro.) terrens(Walker, 1856) 0 16 16
An. (Nys.) albitarsisLynch Arribálzaga, 1878 115 8 123
An. (Nys.) evansae(Brethés, 1926) 45 1 2 48
An. (Nys.) triannulatus(Neiva and Pinto,1922) 19 4 23
Cq. (Rhy.) albicosta(Peryassú, 1908) 14 28 42
Cq. (Rhy.) fasciolata(Lynch Arribálzaga, 1891) 48 25 27 100
Cq. (Rhy.) juxtamansonia(Chagas, 1907) 57 15 22 94
Cq. (Rhy.) venezuelensis(Theobald, 1912) 139 1 140
Cx. (Cux.) bidensDyar, 1922 10 10
Cx. (Cux.) declaratorDyar and Knab, 1906 230 281 511
Cx. (Cux.) usquatusDyar, 1918 274 299 573
Cx. (Cux.)sp1 99 14 113
Cx. (Cux.)sp2 44 6 50
Cx. (Mel.) bastagariusDyar and Knab, 1906 1075 28 1103
Li. durhamiiTheobald, 1901 17 17
Li.flavisetosusOliveira Castro, 1935 15 15
Ma. (Man.) titillans(Walker, 1848) 196 ? 196
Ma. (Man.) wilsoni(Barreto and Coutinho, 1944) 173 6 179
Ps. (Jan.) ferox(Humboldt, 1819) 8 2 10
Ru. (Run.) frontosa(Theobald, 1903) 6 6
Ru. (Run.) reversaLane and Cerqueira, 1942 1 29 30
Sa. (Sbn.) intermediusLutz, 1904 1 6 7
Ur. (Ura.) calosomataDyar and Knab, 1907 35 7 3 45
Ur. (Ura.) geometricaTheobald, 1901 13 0 13
Ur. (Ura.) nataliaeLynch Arribálzaga, 1891 5 3 8
Ur. (Ura.) pulcherrimaLynch Arribálzaga, 1891 51 1 52
Wy. (Pho.) edwardsi(Lane and Cerqueira, 1942) 11 11
Wy. (Tri.) aporonomaDyar and Knab, 1906 12 12
Index Site A Site B
Total individuals collected 2873 900
Total species observed 35 37
Coefficient of variance (CV) 2.24 2.67
*No specimens were collected with Shannon traps at this site.
Species totaling 5 or less individuals (number of specimens in parenthesis) found at both sites wereAe. (Och.)fluviatilis(Lutz, 1904) (3);Cx. (Mcx.) imitatorTheobald, 1903 (3); andWy. (Pho.)flabellata(Lane and Cerqueira, 1942) (2). Species collected only on site A were:Cx. (Cux.)quinquefasciatus
Say, 1823 (5),Ae. (Stg.)albopictus(Skuse, 1895) (3);Ma. (Man.)indubitansDyar and Shannon, 1925 (3);Ur. (Ura.)lowii Theobald, 1901 (2);Cq. (Rhy.) chrysonotum(Peryassú, 1922) (1). Collected only at site B:Tr. digitatum(Rondani, 1848) (5);An. (Nys.)minorCosta Lima, 1929 (2);Wy. (Wye.)pertinans
(Williston, 1896) (2);Hg. (Hag.)capricorniiDyar, 1921 (1);Hg.(Con.)leucocelaenus(Dyar and Shannon, 1924) (1);Tr. pallidiventer(Lutz, 1905) (1);Wy.
(Den.)luteoventralisTheobald, 1901 (1);Wy. (Pho.)muehlensiPetrocchi, 1927 (1).Cq. chrysonotumandUr. natalieaewere collected only with Shannon
traps;Cx. imitatorwas collected with CDC and Shannon traps. All other specimens were collected only with CDC light traps.
the variation, respectively. The abundances ofCx. declaratorandCq. venezuelensiswere not
significantly associated with any of the climatic variables measured (Table 6).
Discussion
The sampling procedure used provided an adequate representation of the composition of mos-quito communities in REGUA, since 35 of 40 (87%) and 37 of 51 (73%) species estimated to occur at sites A and B, respectively, were detected. Overall, the number of species detected in REGUA (48 species from 14 genera) was comparable to numbers reported for other patches of Atlantic Forest, although species composition seems to vary somewhat among sites. For
exam-ple, Guimarães et al. [34] collected 45 mosquito species from 13 genera in forest environments
Fig 2. Individual-based interpolation (rarefaction; solid lines) and extrapolation (dashed lines) from reference samples from the two sampling sites (filled black circle = site A; filled gray triangle = site B) in Guapiaçu Ecological Reserve (REGUA) from a multinomial model, with 95% unconditional confidence intervals (dotted lines) (based on Colwell et al. 2012).
doi:10.1371/journal.pone.0122268.g002
Table 3. Mosquito diversity estimates for two sites in Guapiaçu Ecological Reserve, Cachoeiras de Macacu, Rio de Janeiro, Brazil, in the period from February 2012 to January 2014 (bootstrap mean±s. e.; 95% confidence intervals are in parentheses).
Site A Site B
Diversity of order 0 (Species richness)
ACE-1 39.8±5.2 (35.9–61.7)a 51.0±10.5 (40.8–88.6)a
Chao1-bc 36.5±2.2 (35.2–47.5)a 43.4±5.5 (38.5–64.3)a
Shannon Index (Chao & Shen 2003) 2.4±0.0 (2.4–2.5)a 2.2±0.1 (2.1–2.3)b
Shannon diversity* 11.2±0.3 (10.6–11.7)a 8.9±0.5 (8.0–9.8)b
Simpson index (MVUE) 0.17±0.0 (0.09–0.25)a 0.22±0.0 (0.11–0.32)a
Simpson diversity (MVUE)** 5.8±0.25 (5.3–6.3)a 4.6±0.3 (4.1–5.1)b
a-b: In each row, sites not sharing the same letter are signi
ficantly different (p<0.01).
*Diversity of order 1; **Diversity of order 2.
in Itaguaí, Rio de Janeiro, although only 50% of the species were the same as those collected in REGUA. In Nova Iguaçu Municipal Park, within the Gericinó-Mendanha natural protection
area, also in Rio de Janeiro State, 31 species from 12 genera were reported [5], 45% of which
were the same as those found in REGUA. This is consistent with the highly heterogeneous en-vironment of the Brazilian Atlantic Forest and the associated high occurrence of endemism
[35].
Even though the sampling sites were located within the same fragment of Atlantic Forest, differences in the available oviposition sites may explain differences in the mosquito fauna. Al-though species richness was similar, total diversity was higher at site A than site B. Species composition and abundance differed, with approximately 25% of species common to both.
Ground water mosquito species (such asCx. bastagarius) and species of the Mansoninii tribe
were found almost exclusively at sampling site A. Site A was near a lake with calm, clear, cold water, a low light environment, and plenty floating and emergent vegetation, such as
Fig 3. Non-parametric multidimensional scaling plot of 48 mosquito species collected bimonthly at two sites (site A represented with crosses, site B with filled circles) during 2012 and 2013.Stress is 0.22, indicating a moderately good representation of the data in the two-dimensional ordination plot. Labels indicate sample month and year.
doi:10.1371/journal.pone.0122268.g003
Table 4. Mosquito abundance and diversity estimates (effective number of species) for two sites in Guapiaçu Ecological Reserve, Cachoeiras de Macacu, Rio de Janeiro, Brazil, in 2012 and 2013 (adjusted±s.e.).Diversity of Order 0 is ACE-1; Diversity of order 1 is Shannon diversity; diversity order 2 is Simpson diversity.
Site Year Abundance Div. Ord. 0 Div. Ord. 1 Div. Ord. 2
Site A 2012 57.3±3.1a 9.2±2.5bc 5.4±0.9ab 4.9±0.9a
2013 375±7.9b 17.5±2.5a 6.5±1.0a 4.3±0.8a
Site B 2012 28.8±2.2c 14.4±2.5ab 7.5±1.1a 4.8±0.9a
2013 91.2±3.9d 6.5±2.5c 3.6±0.8b 2.9±0.7a
a-d: In each column, sites not sharing the same letter are signi
ficantly different (p<0.01).
Fig 4. Monthly estimates of: A. species abundance and measures of diversity B. order 0 (ACE-1), C. order 1 (Shannon) and D. order 2 (MVUE) in Guapiaçu Ecological Reserve (REGUA) (adjusted means + s.e.).Different small letters indicate significant differences (p<0.01) between sites and months in mosquito
abundance. No significant differences were found in measures of diversity.
Eichhorniaspp. It thus offered ample larval habitat for these species throughout the study peri-od. On the other hand, species of the Sabethini tribe, mosquitoes that are typically sylvatic, were more frequently found at site B, characterized by more extensive plant cover and mature forest.
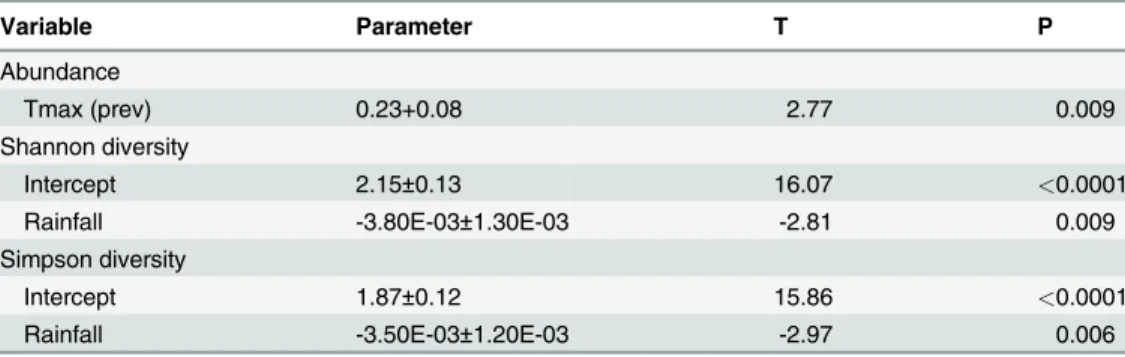
Several hypotheses have been proposed to explain differences in species richness and diver-sity. One such is the niche diversification hypothesis, in which diversity is a function of the range of habitats and of the degree of specialization of resident species; in this hypothesis more stable ecosystems such as forests are predicted to have higher species diversities. The interme-diate disturbance hypothesis (IDH) states that local species diversity is maximized when Table 5. Results of stepwise multiple linear regression analyses of mosquito abundance and mea-sures of diversity as functions of temperature (monthly maximum and minimum), rainfall and relative humidity in the same or previous month.
Variable Parameter T P
Abundance
Tmax (prev) 0.23+0.08 2.77 0.009
Shannon diversity
Intercept 2.15±0.13 16.07 <0.0001
Rainfall -3.80E-03±1.30E-03 -2.81 0.009
Simpson diversity
Intercept 1.87±0.12 15.86 <0.0001
Rainfall -3.50E-03±1.20E-03 -2.97 0.006
Only variables with p<0.05 were retained.
Tmax (prev) = Monthly maximum temperature of the previous month.
doi:10.1371/journal.pone.0122268.t005
Table 6. Results of stepwise multiple linear regression analyses of abundances of the eight most fre-quent mosquito species as functions of temperature (monthly maximum and minimum), rainfall and relative humidity in the same or previous month.
Variable Parameter T p
Ae. scapularis
Tmin (prev) 0.54±0.17 3.24 0.007
An. albitarsis
Tmax (prev) 0.33±0.12 2.78 0.02
Tmin -0.28±0.14 -2.08 0.05
Cx. bastagarius
RH (prev) 0.17±0.07 2.33 0.04
Cx. usquatus
Intercept 12.43±4.03 3.09 0.009
Tmax -0.39±0.16 -2.43 0.03
Ma. titillans
Tmin (prev) 0.69±0.19 3.7 0.003
Tmin -0.45±0.17 -2.6 0.02
Ma. wilsoni
RH (prev) 0.11±0.04 2.41 0.03
Only variables with p<0.05 were included.
Tmax = Monthly maximum temperature; Tmin = Monthly minimum temperature; RH = Relative humidity; (prev) = in the previous month.
ecological disturbance is neither too rare nor too frequent, allowing both competitive and
op-portunistic species to coexist [36]. This study did not find significant differences in species
richness between the two Atlantic Forest sites analyzed. However, Site B, the more intact envi-ronment, had lower diversity (relating richness with relative abundance) and greater domi-nance of Culicidae, which could be explained in part by the IDH. Differences in larval habitat availability and/or preference may also explain the patterns observed. Those species of Culici-dae that develop in water-filled tree holes and other phytothelmata such as the Sabethini tribe
(with the exception ofLimatus durhamii, which has been collected from habitats such as
artifi-cial containers [37] and percolation tanks [38]) were more frequently collected in Site B (43%
compared with 8% in site A). Such species are considered to indicate environments that have
not been subjected to pronounced anthropic disturbance [39]. In contrast, 91% of mosquitoes
collected at Site A develop in larval habitats such as ground pools, ponds, and artificial
contain-ers; the presence of specimens of the Mansoniini tribe (Mansoniaspp.,Coquillettidiaspp.) and
the Aedini tribe (e.g.,Ae. scapularis) tends to be linked to environments with higher degrees of
anthropic disturbance [39], [19].
Measures of diversity showed little variation between years and no significant variation among months, and were weakly correlated with climatic variables. Although relationships with rainfall were significant, these explained less than 30% of the variability of the data. How-ever, it is interesting that the relationship was negative, which could indicate that a few species peak in numbers as rainfall increases (however, no correlation was found between rainfall and the abundances of the most common species, see below). Alternatively high rainfall may be
“flushing”larvae from their habitats. Dorvillé [39] pointed out that in some regions of Brazil
there are alternations between tropical and temperate climatic states [40]. In our study sites
av-erage temperatures during the sampling period fluctuated between 20 and 26°C and mode monthly rainfall was 50 mm, indicative of a tropical climate suitable for mosquitoes year round, rather than a temperate one. Thus factors other than climate may have more influence on temporal variations in the mosquito community.
Aedes scapularisis a flood water mosquito; its eggs hatch in installment in response to
floods. Rainfall regime directly influences the development of immatureAe. scapularis[41],
[19], which has been suggested as an explanation for higher occurrences in warm, humid
peri-ods with heavy rainfall [42] for this species andAe. albifasciatus[43], [44]. In this study no
sig-nificant relationships were found betweenAe. scapularisabundance and rainfall, but there was
a positive relationship with average minimum temperature in the previous month. This species
was collected in similar numbers at both sites, reflecting the generalist nature ofAe. scapularis
reported by Forattini et al. [45] in São Paulo State, as well as Lourenço-de-Oliveira and Silva
[46] and Guimarães et al. [34] in Itaguaí-Rio de Janeiro.Aedes scapularisis a vector of
Dirofi-laria immitisLeidy in Rio de Janeiro State [47], and there is field and laboratory evidence
indi-cating it may be a vector of several arboviruses [19].
Overall,Culex bastagariuswas the most abundant species collected, although it was
com-paratively rare in 2012. The species is a suspected vector ofHepatozoon caimani(Apicomplexa:
Hepatozoidae) in some regions of South America [48]. Luz & Lourenço-de-Oliveira [49]
re-ported thatCulex bastagariusabundances are lower during the rainy season. However, in this
study no significant relationship was found betweenC. bastagariusabundance and rainfall;
Culicid species composition differed between the environments studied, probably influ-enced by the intactness of the forest and other local characteristics such as larval habitat
avail-ability. Among the species considered of epidemiological importance,Mansoniaand
Coquillettidiaspecies, prevalent at Site A, are known vectors of equine encephalitis [19].Hg. leucocelaenus, collected only at Site B (though in small numbers), is involved in the
transmis-sion of yellow fever [50], and potentially of Ilhéus, Maguari, Tucunduba, and Una viruses [51].
Other species of medical interest such asAe. scapularisandCx. declarator(a vector of Saint
Louis Encephalitis in the Amazonian region), [52] were detected in similar numbers at
both sites.
Due to the diversity of mosquito species detected, their potential roles in pathogen transmis-sion, and the intermittent flow of national and international visitors to REGUA, it is recom-mended that a program of Culicidae surveillance be maintained.
Acknowledgments
RMG is a Career Member of Consejo Nacional de Investigaciones Científicas y Técnicas (CONICET), Argentina. A. Mangeaud of Universidad Nacional de Córdoba is acknowledged for advice about PERMANOVA. The authors thank Nicholas and Rachel Locke as president and vice president, and Jorge Bizarro as research coordinator of REGUA, respectively, for the facilities granted while carrying out this study. We are thankful for comments and suggestions from anonymous reviewers that helped improve an earlier version of this article.
Author Contributions
Conceived and designed the experiments: JA CFM AEG HRGS JSS JRSM RMG. Performed the experiments: JA CFM AEG HRGS JSS JRSM RMG. Analyzed the data: JA HRGS JSS JRSM RMG. Contributed reagents/materials/analysis tools: JA CFM AEG HRGS JSS JRSM RMG. Wrote the paper: JA CFM HRGS JSS RMG.
References
1. Prochnow M, Schäffer WB (2002) A Mata Atlântica e você: Como preservar, recuperar e se beneficiar
da mais ameaçada Floresta Brasileira. Brasilia: APREMAVI. 156 p. PMID:16410860
2. Tabarelli M, Aguiar AV, Ribeiro MC, Metzger JP, Peres CA (2010) Prospects for biodiversity conserva-tion in the Atlantic Forest: Lessons from aging human-modified landscapes. Biol Conserv 143: 2328–2340. doi:10.1016/j.biocon.2010.02.005
3. Marques TC, Bourke BP, Laporta GZ, Sallum MAM (2012) Mosquito (Diptera: Culicidae) assemblages associated withNidulariumandVrieseabromeliads in Serra do Mar, Atlantic Forest, Brazil. Parasites & Vectors 5: 41. doi:10.1186/1756-3305-5-41
4. Ribeiro AF, Urbinatti PR, Castro Duarte AMR, Paula MB de, Pereira DM, Mucci LF, et al. (2012) Mos-quitoes in degraded and preserved areas of the Atlantic Forest and potential for vector-borne disease risk in the Municipality of São Paulo, Brazil. J Vector Ecol 37: 316–324. doi:10.1111/j.1948-7134. 2012.00233.xPMID:23181854
5. Correa FF, Gleiser RM, Leite PJ, Fagundes E, Gil-Santana HR, Mello CF, et al. (2014) Mosquito (Dip-tera: Culicidae) communities in Nova Iguaçu Natural Park Rio de Janeiro, Brazil. J Am Mosquito Control Assoc 30: 83–90. doi:10.2987/13-6372.1PMID:25102590
6. Alencar J, Ferreira ZM, Lopes CM, Serra-Freire NM, Mello RS, Silva JS, et al. (2011) Biodiversity and times of activity of mosquitoes (Diptera: Culicidae) in the Biome of the Atlantic Forest in the State of Rio de Janeiro, Brazil. J Med Entomol 48: 223–231. doi:10.1603/ME09214PMID:21485357
7. Montes J (2005) Fauna de Culicidae da Serra da Cantareira, São Paulo, Brasil. Rev Saúde Públ 39:
578–584. doi:10.1590/S0034-89102005000400010
9. Laporta GZ, Prado PIKL, Kraenkel RA, Coutinho RM, Sallum MAM (2013) Biodiversity Can Help Pre-vent Malaria Outbreaks in Tropical Forests. PloS Negl Trop Dis 7(3):e2139. doi:10.1371/journal.pntd. 0002139PMID:23556023
10. Graham SP, Hassan HK, Burkett-Cadena ND, Guver C, Unnasch TR (2009) Nestedness of Ectopara-site—Vertebrate Host Networks. Plos One 4: 1–8. doi:10.1371/journal.pone.0007873
11. Veloso HP, Rangel-Filho ALR, Lima JCA (1991) Classificação da vegetação brasileira, adaptada a um
sistema universal. IBGE, Departamento de Recursos Naturais e Estudos Ambientais: Rio de Janeiro. 124 p. doi:10.5681/joddd.2014.003PMID:25507547
12. Pinheiro HSK (2012) Mapeamento Digital de Solos por Redes Neurais Artificiais da Bacia Hidrográfica do Rio Guapi-Macacu, Rio de Janeiro. Dissertação de Mestrado. Universidade Federal Rural do Rio
de Janeiro. Seropédica, Rio de Janeiro. 151p.
13. Mello MCS, Freitas SR, Cerqueira R (2003) Estrutura da vegetação em fragmentos florestais de Mata
Atlântica com base no sensoriamento remoto. In: VI Congresso de Ecologia do Brasil, 2003, Fortaleza. Anais. . .Fortaleza: Editora da Universidade Federal do Ceará. 133–134.
14. Shannon R (1939) Methods for collecting and feeding mosquitoes in jungle yellow fever studies. Amer J Trop Med Hyg 19: 131–148.
15. Silver JB (2008) Mosquito ecology: field sampling methods. Springer, Dordrecht, The Nether-lands.1447 p.
16. Lane J (1953) Neotropical Culicidae. 2 Vol. Editora Universidade de São Paulo: São Paulo. 1112 p. 17. Faran M, Linthicum K (1981) A handbook of the Amazonian species ofAnopheles(Nyssorhynchus)
(Diptera, Culicidae). Mosq Syst 13: 1–81.
18. Consoli RAGB & Lourenço-de-Oliveira R (1994) Principais mosquitos de importância sanitária no Bra-sil. Editora Fiocruz: Rio de Janeiro. 225p.
19. Forattini OP (2002) Culicidologia Médica—2° Volume: Identificação, Biologia, Epidemiologia. Editora
da Universidade de São Paulo: São Paulo. 860p.
20. Editorial 2005. Journal policy on names ofAedinemosquito genera and subgenera. J Med Entomol 42: 511–511. doi:10.1603/0022-2585(2005)042[0511:JPONOA]2.0.CO;2PMID:16119537
21. Reinert JF (2000) New classification for the composite genusAedes(Diptera: Culicidae: Aedini), eleva-tion of subgenusOchlerotatusto generic rank, reclassification of the other subgenera and notes on cer-tain subgenera and species. J Am Control Assoc 16(3): 175–188. PMID:11081644
22. Colwell RK, Chao A, Gotelli NJ, Lin SY, Mao CX, Chazdon RL, et al. (2012) Models and estimators link-ing individual-based and sample-based rarefaction, extrapolation, and comparison of assemblages. J Plant Ecol 5:3–21.
23. Colwell RK (2013) EstimateS: Statistical estimation of species richness and shared species from sam-ples. Version 9. User's Guide and application published at:http://purl.oclc.org/estimates.
24. Gotelli NJ, Chao A (2013) Measuring and estimating species richness, species diversity, and biotic sim-ilarity from sampling data. In: Levin S.A. (ed.) Encyclopedia of Biodiversity, second edition, Volume 5, pp. 195–211. Waltham, MA: Academic Press.
25. Hortal J, Borges PA, Gaspar C. 2006. Evaluating the performance of species richness estimators: sen-sitivity to sample grain size. J Animal Ecol 75: 274–287 PMID:16903065
26. Chao A, Shen TJ (2010) Program SPADE (Species Prediction and Diversity Estimation). Program and User’s Guide available athttp://chao.stat.nthu.edu.tw.
27. Chao A (2005) Species estimation and applications. In: Balakrishnan N, Read CB, Vidakovic B (eds.) Encyclopedia of Statistical Sciences, second edition, Volume 12, pp. 7907–7916. New York: Wiley.
28. Chao A, Lee SH (1992) Estimating the number of classes via sample coverage. J Am Stat Assoc 87: 210–217.
29. Chao A, Hwang W-H, Chen Y-C, Kuo C-Y (2000) Estimating the number of shared species in two com-munities. Statistica Sinica 10: 227–246.
30. Chao A, Shen TJ (2003) Nonparametric estimation of Shannon0s índex of diversity when there are un-seen species in sample. Environ & Ecol Stat 10: 429–443.
31. HammerØ, Harper DAT, Ryan PD (2001) PAST: Paleontological statistics software package for
educa-tion and data analysis. Palaeontologia Electronica [Internet] 49p.http://palaeo-electronica.org/2001_1/ past/issue1_01.htmAccessed 10 October 2012.
32. Di Rienzo JA, Casanoves F, Balzarini MG, Gonzalez L, Tablada M, Robledo CW (2014) InfoStat ver-sión 2014. Grupo InfoStat, FCA, Universidad Nacional de Córdoba, Argentina. URLhttp://www. infostat.com.ar
34. Guimarães AE, Motta MA, Arlé M, Machado RM, Gonçalves LD (1989) Bionomics of mosquitoes
(Dip-tera: Culicidae) in areas of the Atlantic Forest of Itaguaí municipality, Rio de Janeiro state, Brazil: I. intra, peri and extradomiciliary frequency. Mem Inst Oswaldo Cruz 84: 243–254. doi: 10.1590/S0074-02761989000800044
35. Morellato LP, Haddad CFB (2000) Introduction: The Brazilian Atlantic Forest1. Biotropica 32: 786–792. doi:10.1646/0006-3606(2000)032[0786:ITBAF]2.0.CO;2
36. Connell JH (1978) Diversity in tropical rain forests and coral reefs. Science 199: 1302–1310. doi:10. 1126/science.199.4335.1302PMID:17840770
37. Silva AM (2002) Imaturos de mosquitos (Diptera, Culicidae) de áreas urbana e rural no norte do estado do Paraná, Brasil. Iheringia, Sér. Zool. 92: 31–36. doi:10.1590/S0073-47212002000400005 38. Alencar J, Morone F, de Mello CF, Gil-Santana HR, Guimarães AÉ (2013) Immature mosquitoes
(Dip-tera: Culicidae) in a eutrophic landfill tank from State of Rio de Janeiro, Brazil. Revta Soc Bras Med Trop 46: 769–771. doi:10.1590/0037-8682-1670-2013
39. Dorvillé LFM (1996) Mosquitoes as bioindicators of forest degradation in southeastern Brazil, a statisti-cal evaluation of published data in the literature. Stud Neotrop Environ 31: 68–78. doi:10.1076/snfe. 31.2.68.13331
40. Nimer E (1979) Climatologia do Brasil. Rio de Janeiro: IBGE (Recursos naturais e meio ambiente). 422 p.
41. Casanova C, Prado AP (2002) Key-factor analysis of immature stages ofAedes scapularis(Diptera: Culicidae) populations in southeastern Brazil. Bull Entomol Res 92: 271–277. PMID:12191434
42. Teodoro U, Guilherme ALF, Lozovei AL, Salvia Filho V, Sampaio AA, Spinosa RP, et al. (1994) Mosqui-tos de ambientes peri e extradomiciliares na região sul do Brasil. Rev Saúde Pública 28: 107–115. doi: 10.1590/S0034-89101994000200003
43. Gleiser RM, Gorla DE, Ludueña Almeida FF (1997) Monitoring the abundance ofAedes (Ochlerotatus) albifasciatus(Macquart 1838) (Diptera: Culicidae) to the south of Mar Chiquita Lake, central Argentina, with the aid of remote sensing. Ann Trop Med & Parasitol 91: 917–926.
44. Gleiser RM, Gorla DE, Schelotto G. 2000. Population dynamics ofAedes albifasciatus(Diptera: Culici-dae) south of Mar Chiquita Lake, central Argentina. J Med Entomol 37: 21–26. doi: 10.1603/0022-2585-37.1.21PMID:15218902
45. Forattini OP, Gomes A de C, Santos JLF, Galati EAB, Rabello EX, Natal D (1981) Observações sobre
atividade de mosquitos Culicidae, em mata residual no Vale do Ribeira, S. Paulo, Brasil. Rev Saúde Pública 15: 557–586. doi:10.1590/S0034-89101986000100001
46. Lourenço-de-Oliveira R, Silva TF (1985) Alguns aspectos da ecologia dos mosquitos (Diptera: Culici-dae) de uma área de planície (Granjas Calábria) em Jacarepaguá, Rio de Janeiro. III- Preferência
hor-ária das fêmeas para o hematofagismo. Mem Inst Oswaldo Cruz 80: 195–201. doi: 10.1590/S0074-02761985000200010
47. Labarthe N, Serrão ML, Melo YF, Oliveira SJ, Lourenço-de-Oliveira R (1998) Mosquito frequency and
feeding habits in an enzootic canine dirofilariasis area in Niterói, State of Rio de Janeiro, Brazil. Mem Inst Oswaldo Cruz 93: 145–154. doi:10.1590/S0074-02761998000200002PMID:9698883
48. Viana LA, Soares P, Paiva F, Lourenço-De-Oliveira R (2010) Caiman-biting mosquitoes and the natural vectors ofHepatozoon caimaniin Brazil. J Med Entomol 47: 670–676. doi:10.1603/ME09260PMID: 20695284
49. Luz SLB, Lourenco-de-Oliveira R (1996) Forest Culicinae mosquitoes in the environs of Samuel hydro-eletric plant, state of Rondônia, Brazil. Mem Inst Oswaldo Cruz 91: 427–432. doi: 10.1590/S0074-02761996000400008PMID:9070404
50. Cardoso JC, de Almeida MAB, dos Santos E, da Fonseca DF, Sallum MAM, Noll CA, et al. (2008) Yel-low fever virus inHaemagogus leucocelaenusandAedes serratusmosquitoes, Southern Brazil. Emerg
Inf Dis 16: 1918–1924. doi:10.3201/eid1612.100608
51. Hervé JP, Dégallier N, Travassos da Rosa APA, Pinheiro FP, Sa GC (1986) Aspectos ecológicos. In: Instituto Evandro Chagas. Evandro Chagas: 50 anos de contribuição as ciências biológicas e a
medi-cina tropical. Belém, Brazil: Fundação Serviço Especial de Saúde Pública. pp 409–437.