Determination of
111
In and
99m
Tc recovery
in the quantification of activity with SPECT imaging*
Determinação dos fatores de recuperação do 111
In e do 99m
Tc na quantificação de atividade com imagens SPECT
Jucilene Maria Pereira1, Joey W. Forrester2, Maria Inês C. C. Guimarães3, Fernando Roberto de Andrade Lima4, Michael Gregory Stabin5
OBJECTIVE: To experimentally determine the 99m
Tc and 111
In activity recovery coefficients in SPECT imag-ing. MATERIALS AND METHODS: Four different 99m
Tc and 111
In concentrations were utilized for quantifying activity in spheres of four different sizes. Images were obtained with a hybrid dual-head SPECT-CT imaging system. The ordered subset expectation maximization (OSEM) iterative method was utilized for images re-construction. An attenuation map was utilized for attenuation correction, and the multiple energy window technique for scattering correction. RESULTS: Results for spheres ≤≤≤≤≤ 6 ml in volume were significantly af-fected by the partial volume effect. For 111
In quantification, results show a dependence on sphere concen-trations and background levels. For 99m
Tc quantification, there was a tendency towards values underestima-tion with higher background levels. CONCLUSION: Correcunderestima-tion factors must be utilized for compensating the partial volume effect on objects with ≤≤≤≤≤ 6 ml in volume for both radionuclides. Background subtraction to compensate spurious count present on SPECT images has a significant influence on the quantification of activity, especially for the smaller objects.
Keywords: SPECT; 111 In; 99m
Tc; Recovery factors.
OBJETIVO: Determinar, experimentalmente, os coeficientes de recuperação do 111
In e do 99m
Tc usando imagens SPECT. MATERIAIS E MÉTODOS: Quatro diferentes concentrações de 111
In e de 99m
Tc foram usadas para quantificar a atividade em esferas de diferentes tamanhos. As imagens foram obtidas com um equipamento híbrido SPECT/CT, com dois detectores. A reconstrução das imagens foi realizada usando o método iterativo ordered subset expectation maximization (OSEM). A correção de atenuação foi realizada com o uso de um mapa de atenuação e a correção de espalhamento foi realizada usando a técnica das janelas de energia. RESULTADOS: Os resultados mostraram que o efeito do volume parcial foi observado de forma mais signi-ficativa para as esferas com volume ≤≤≤≤≤ 6 ml. Para o 111
In, os resultados mostram uma dependência com re-lação às concentrações usadas nas esferas e ao nível de background usado. Para o 99m
Tc, pôde-se observar uma tendência à subestimação dos resultados quando os níveis mais altos de background foram utilizados. CONCLUSÃO: É necessário usar os fatores de correção para compensar o efeito do volume parcial em ob-jetos com volume ≤≤≤≤≤ 6 ml para ambos os radionuclídeos. A subtração das contagens espúrias presentes nas imagens SPECT foi o fator que mais influenciou na quantificação da atividade nessas esferas.
Unitermos: SPECT; 111 In; 99m
Tc; Fatores de recuperação. Abstract
Resumo
* Study developed at Department of Nuclear Medicine – Medi-cal Center of Vanderbilt University, Nashville, TN, USA.
1. Master, Fellow PhD degree, Department of Nuclear Energy, Universidade Federal de Pernambuco (UFPE), Recife, PE, Brazil.
2. Bachelor, Technologist in Nuclear Medicine at Medical Center of Vanderbilt University, Nashville, TN, USA.
3. PhD, Specialist in Radiological Protection, Universidade de São Paulo (USP), São Paulo, SP, Brazil.
4. PhD, Researcher for Regional Center of Nuclear Sciences – Comissão Nacional de Energia Nuclear (CRCN-CNEN), Recife, PE, Brazil.
5. PhD, Associate Professor, Department of Radiology and Radiological Sciences – Vanderbilt University, Nashville, TN, USA.
Mailing address: Dra. Maria Inês C. C. Guimarães. Universidade de São Paulo, Faculdade de Medicina, Departamento de Radiologia. Rua Doutor Ovídio Pires de Campos, s/nº, Cerqueira César. São Paulo, SP, Brazil, 05403-010. E-mail: maria.inês@ hcnet.usp.br
Received September 16, 2009. Accepted after revision De-cember 10, 2009.
which significantly improves the image contrast and the detection of small lesions in the patient’s body.
Many authors have evaluated the accu-racy in activity quantification performed with SPECT images by means of experi-mental studies(4–6), but the presented results cannot be compared, as in such studies dif-ferent reconstruction methods (with differ-ent corrections), differdiffer-ent activity values and source objects of different shapes and sizes were utilized. However, the results are in agreement with the fact that, because of the partial volume effect, the accuracy in Pereira JM, Forrester JW, Guimarães MICC, Lima FRA, Stabin MG. Determination of 111
In and 99m
Tc recovery in the quan-tification of activity with SPECT imaging. Radiol Bras. 2010;43(1):47–51.
INTRODUCTION
In nuclear medicine, the quantification of scintigraphic images(1) (e.g.: single pho-ton emission computed tomography – SPECT) is used both for estimating the activity in the body of patients submitted to therapy with internal emitters, and in pharmacokinetic studies for approval of new radiopharmaceutical drugs(2,3).
the volume and activity determination de-creased when small objects (in the magni-tude of 20 ml or smaller) were evaluated. In order to characterize the error in ac-tivity quantification as a function of object size, Koral & Dewaraja(7) have systemati-cally studied the accuracy in activity quan-tification (utilizing 131I) as a function of the
object volume, with spheres ranging from 2 to 100 cm3. In the present study, the
au-thors utilized the so called recovery coef-ficient (RC), defined by calculation of the ratio between the calculated activity and the actual activity contained in the object to evaluate the activity quantification er-ror, and suggested the utilization of a cor-rection factor calculated as the inverse of the recovery factor, in order to perform the activity quantification correction in small objects. The study also evidenced that the determination of such factors is influenced by the background level and by the rota-tion radius utilized in the image acquisi-tion.
However, all these studies utilized 131I
images, as iodine is a widely utilized radio-nuclide, being employed both for tumors of hematologic origin, as well as for solid tu-mors(8).
The present study was aimed at deter-mining the RCs in the quantification of activity for other radionuclides of interest in the clinical practice: 111In and 99mTc. The
first one, for being the substitute of 90Y in
the development of pre-therapy planning(9), and 99mTc, for being utilized in many
diag-nostic studies(10).
MATERIALS AND METHODS
The accuracy of activity quantification and the limits of small objects detection were evaluated not only as a function of size, but also as a function of the activity contained in the object and the presence of background activity. Initially four spheres of different external diameters – 1.5, 1.75, 2.5 and 3 cm (internal volumes of 1.4, 2.2, 6.0 and 11.5 ml, respectively) – were placed within a Jaszczak phantom (Jaszczak SPECT Phantom – Biodex Medical Sys-tems; Shirley, NY, USA).
The experiment was carried out by first with a concentration of 74 kBq/ml in each one of the spheres, and contamination-free
water in the remainder of the phantom. The activity measurement was done by using a dose calibrator model CRC-15R (Capintec Inc.; Ramsey, NJ, USA), with a resolution of 0.001 MBq, linearity of 1.1% and e ac-curacy of 2.8%, evaluated for the period of the development of the experiments.
In order to minimize the error associated with the measurement of low activity in the dose calibrator, the concentration was pre-pared by diluting 37 MBq of 99mTc in a
volume of 500 ml of water. The volume necessary for each sphere was separated, obtaining the activity values of 103, 163, 444 and 850 kBq for the spheres of 1.4, 2.2, 6.0 and 11.5 ml, respectively.
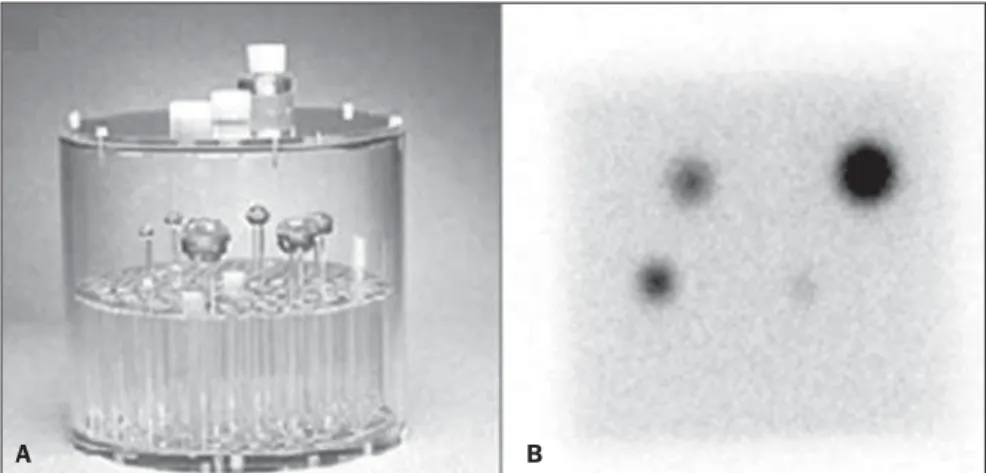
The experiment was then repeated, this time adding background values corre-sponding to 0.5% and 1.0% of the concen-tration used in the spheres. For such pur-pose, activity values of approximately 2400 and 4800 kBq were utilized in the volume of 6393 ml of water in the Jasczak phan-tom. Such values are comparable to those found in a clinical situation with 0.1% and 1% of uptake for small tumors and approxi-mately 10% uptake for other tissues distrib-uted in an approximately uniform manner in the body. Figure 1 shows an image of the Jaszczak phantom and a side view (with the spheres positioning) obtained in the experi-ment carried out with 99mTc, for the
condi-tion of background equivalent to 1.0% of the concentration value utilized in the spheres.
The experiment with 99mTc was repeated
for the other three values of activity con-centration in the spheres: 185, 370 and 740
kBq/ml. For each concentration value, the three background conditions were re-peated, corresponding to 0%, 0.5% and 1.0% of the concentrations utilized in the spheres.
The complete experiment above de-scribed was then repeated for 111In, with the
same activity concentrations in the spheres (74, 185, 370 and 740 kBq/ml) and for the three background conditions (0%, 0.5% and 1.0%). Thus, a total of 24 images were acquired (four different concentrations ×
three background levels × two radionu-clides).
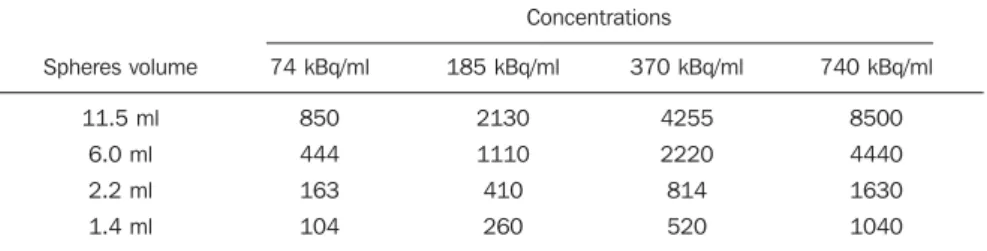
In each experiment the spheres were filled with a 60 ml syringe. The activity value placed in each sphere was calculated by measuring the difference of activity contained in the syringe before and after filling the sphere. Table 1 presents the ref-erence values of activities utilized in the spheres for the acquisition of planar images and SPECT in the condition of background absence for each radionuclide.
The activity value and time of measure-ment were recorded and a correction for the source activity decay was made for the start time of each acquisition, with the equation 1 as follows:
A = A0×e
–λt (1)
where: A is the final activity, A0 is the ini-tial activity measured at the moment when the activity was placed in the sphere, λ is the radionuclide decay constant; t is the time elapsed between the moment when the activity was measured and the start of each image acquisition.
Figure 1. Image of the Jaszczak phantom utilized in the experiment (A) and lateral view showing the spheres positioning (B).
Image acquisition and reconstruction
The present study was developed at the Department of Nuclear Medicine of the Medical Center of the Vanderbilt Univer-sity (MCVU), in Nashville, TN, USA. The images were acquired using a hybrid Infinia Hawkeye 4 SPECT/CT system (GE Healthcare; Milwaukee, WI, USA) with two detectors, equipped with a collimator for medium energy general purpose – MEGP for the study with 111In, and for low
energy general purpose – LEGP for the study with 99mTc.
The images were acquired according with the clinical protocol normally utilized at the MCVU for studies with 111In and
with 99mTc, with circular orbit, 360°
rota-tion and 3° interval (step and shootmode), matrix size of 256 × 256 pixels and a ro-tation radius selected to be similar to that utilized in patients’ imaging. The image reconstruction was made with the iteractive method ordered subset expectation maxi-mization (OSEM) with an iteraction and five subsets,and the image filtration was made with the Butterworth filter with a cutoff frequency of 10. An attenuation map generated before the SPECT images acqui-sition was utilized in the iteractive recon-struction process for the images attenuation correction. The scattering correction was made by means of the software Xeleris 2.0 (GE Healthcare; Milwaukee, WI, USA) employing energy windows defined as shown on Table 2.
The quantification of images was per-formed with the software ImageJ (National Institutes of Health; Bethesda, MD, USA), with regions of interest – ROIs designed on each SPECT image section utilizing the images from the attenuation map to deter-mine the spheres size and location. The activity was determined according with equation 2.
A = Σcounts ÷ Taquis×Csystem (2)
where: Σcounts corresponds to the summa-tion of counts obtained at the ROI selected over the area of the source on each pro-jection; Taquis is the acquisition time (in seconds); Csystem is the system calibration factor, or the count rate per activity unit (s–1.Bq–1), which was obtained from the
im-ages from a source (approximately punc-tual) in the air, using the same conditions
(collimation, matrix size and scattering correction) employed in the images acqui-sition in the experiment.
Definition of the ROIs and background subtraction
The size and location of the ROIs de-signed over the regions of the spherical sources (Figure 2) were defined from the use of images of the attenuation maps ac-quired for each experiment.
The background subtraction was per-formed as described on equation 3, with the objective of compensating the contribution of spurious counts that appear on the SPECT images after the reconstruction pro-cess. Zingerman et al.(11) have demon-strated that such contribution can be up to 12% in some images, but this depends on the size of the source and the activity in the
Table 2 Values of energy windows utilized for scattering correction.
Radionuclide
111In
99mTc
Photopeak
171 keV ± 10% 245 keV ± 10%
140 keV ± 10%
Scattering
125–145 keV 198–208 keV
122–126 keV
Figure 2. Examples of ROIs selected over spheri-cal sources and selected regions for background subtraction.
medium where the source is immersed. It is important to highlight that such correc-tion represents little impact on the final quantification, as it is performed only in the tomographic sections which comprise the image of the source region.
C = CROIsource – CROI.background×Ssource (3)
where: C represents the corrected counts at the ROI over the source area; CROIsource is the number of counts obtained at the ROI over the source area; CROI.background is the mean value of counts by pixel on a selected background region near the source; SSource is the area of the source in pixels.
RESULTS
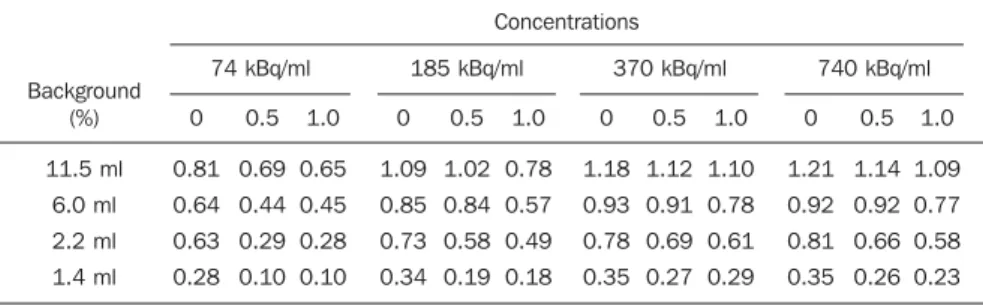
The values of the calibration factors of the experimentally determined system were 80.5 s–1.MBq–1 for 111In and 61.0 s–1.MBq–1 for 99mTc. In order to analyze the accuracy of the results, the calculated activity values were divided by the known activity values to determine the RCs, which are expressed as dimensionless ratios. Tables 3 and 4 present the RCs values determined for 111In and 99mTc, for each sphere as a function of the used concentrations.
For 111In, the results show that the RCs values were better the higher the concen-tration used, and were poorer the higher the used background levels were, demonstrat-ing a dependence on these two factors.
For 99mTc, the results presented the smallest variations as compared with known activity values and did not present
Table 1 Activity reference values (kBq) utilized in the spheres, in the condition of background absence for each radionuclide.
Spheres volume
11.5 ml
6.0 ml
2.2 ml
1.4 ml
Concentrations
74 kBq/ml
850
444
163
104
185 kBq/ml
2130
1110
410
260
370 kBq/ml
4255
2220
814
520
740 kBq/ml
8500
4440
1630
dependence in relation to the concentra-tions utilized in the spheres. However it is possible to observe a tendency to underes-timate results, when the highest levels of background concentration were utilized.
As expected, the accuracy in the quan-tification of activity was poorer the smaller the spheres were in size, because of the partial volume effect, which was observed in a more significant manner in the spheres with a volume ≤ 6 ml. Figure 3 shows the plotted curves of the RCs reverse (1/RC), method suggested by Koral et al.(7) to cor-rect partial volume effects as a function of the object volume. The curves were
sepa-rately determined for each background level, with the RCs values presented on Tables 3 and 4.
DISCUSSION
Differently from expected, the quanti-fication results performed with 111In and 99mTc presented some discrepancies,
par-ticularly when the lower concentration (74 kBq/ml) was utilized. In this situation, the
111In results were underestimated in relation
to the 99mTc results. In order to analyze
these results, the count densities obtained for the spheres of the same size, with the
same activity concentration and inserted in the same background level for both radio-nuclides, were evaluated. The count den-sities presented similar values, however the background subtraction impact was greater for the imaging with 111In. Considering that
for the present experiment the background activity distribution was uniform, such dif-ference was attributed to the contribution of scattered photons in the proximities of the source region where the ROIbackground was selected.
Only the results accuracy was evaluated, as each study was carried out only once, and it was not possible to perform the analysis of precision of such results. Thus, these images acquisition was performed in accordance with the protocol routinely employed at the MCVU, so that the condi-tions evaluated in the studies were close to those observed in studies with patients at such center.
CONCLUSIONS
The present study presents the curves of the RCs reverse (1/RC) determined for 111In
and 99mTc as a function of the spheres
vol-ume, and for different background condi-tions. Previous studies presented such data only for 131I. The results demonstrate the
need of applying the correction to compen-sate for the partial volume effect on objects with a volume ≤ 6 ml for both radionu-clides.
The background subtraction performed to compensate for the spurious counts ef-fect was the factor that caused the highest uncertainty in the quantification of
activ-Figure 3. Curves of the recovery coefficients reverse (1/RC) determined for 111In (A) and 99mTc (B) as a function of sphere volume.
A B
Table 3 Values of recovery coefficients determined for 111In as a function of concentration utilized in the spheres and of the different background levels.
Background (%) 11.5 ml 6.0 ml 2.2 ml 1.4 ml Concentrations
74 kBq/ml 185 kBq/ml 370 kBq/ml 740 kBq/ml
0 0.81 0.64 0.63 0.28 0.5 0.69 0.44 0.29 0.10 1.0 0.65 0.45 0.28 0.10 0 1.09 0.85 0.73 0.34 0.5 1.02 0.84 0.58 0.19 1.0 0.78 0.57 0.49 0.18 0 1.18 0.93 0.78 0.35 0.5 1.12 0.91 0.69 0.27 1.0 1.10 0.78 0.61 0.29 0 1.21 0.92 0.81 0.35 0.5 1.14 0.92 0.66 0.26 1.0 1.09 0.77 0.58 0.23
Table 4 Values of recovery coefficients determined for 99mTc as a function of the concentrations utilized in the spheres and of the different background levels.
Background (%) 11.5 ml 6.0 ml 2.2 ml 1.4 ml Concentrations
74 kBq/ml 185 kBq/ml 370 kBq/ml 740 kBq/ml
ity, moreover for smaller objects. This may be corrected by carrying out a characteriza-tion of the influence of such factor on the activity quantification as a function of the object size.
REFERENCES
1. Siegel JA, Thomas SR, Stubbs JB, et al. MIRD pamphlet no. 16: Techniques for quantitative ra-diopharmaceutical biodistribution data acquisi-tion and analysis for use in human radiaacquisi-tion dose estimates. J Nucl Med. 1999;40:37S–61S. 2. Sgouros G, Squeri S, Ballangrud AM, et al.
Pa-tient-specific, 3-dimensional dosimetry in non-Hodgkin’s lymphoma patients treated with 131 I-anti-B1 antibody: assessment of tumor dose-re-sponse. J Nucl Med. 2003;44:260–8.
3. Koral KF, Kaminski MS, Wahl RL. Correlation of tumor radiation-absorbed dose with response is easier to find in previously untreated patients. J Nucl Med. 2003;44:1541–3.
4. Jaszczak RJ, Coleman RE, Whitehead FR. Physi-cal factors affecting quantitative measurements using camera-based single photon emission com-puted tomography (SPECT). IEEE Trans Nucl Sci. 1981;28:69–80.
5. Green AJ, Dewhurst SE, Begent RHJ, et al. Ac-curate quantification of 131I distribution by gamma camera imaging. Eur J Nucl Med. 1990; 16:361–5.
6. Gilland DR, Jaszczak RJ, Turkington GT, et al. Volume and activity quantitation with iodine-123 SPECT. J Nucl Med. 1994;35:1707–13. 7. Koral KF, Dewaraja Y. I-131 SPECT activity
re-covery coefficients with implicit or
triple-energy-window scatter correction. Nucl Instr Meth Phys Res. 1999;A422:688–92.
8. Costa LJM, Varella PCS, Del Giglio A. A utiliza-ção de anticorpos monoclonais em oncologia. [acessado em 9 de junho de 2009]. Disponível em: www.rsbcancer.com.br/rsbc/02artigo2.asp? nrev=N%BA%A02
9. Conti PS. Radioimmunotherapy with yttrium 90 ibritumomab tiuxetan (Zevalin): the role of the nuclear medicine physician. Semin Nucl Med. 2004;34:2–3.
10. Sandler MP, Coleman RE, Patton JA, et al. Diag-nostic in nuclear medicine. Philadelphia: Lippin-cott Williams & Wilkins; 2002.