ABSTRACT: Objective:To describe violent events experienced by school-aged adolescents in school, around the school and in the family context, and to compare the results of the National Adolescent School-based Health Survey of 2009 and 2012. Methods: Indicators related to violence involving teenagers were analyzed. The prevalence rates and conidence intervals of 95% were calculated for events of interest according to gender and type of school (public or private) and regions. Results: Prevalence rates were: insecurity in the route between home-school (9.1%), insecurity in school (8.0%), physical assault in the last 12 months (18.2%), engaging in ights in the last 12 months (20.7%), ighting with a cold weapon (8.3%), ighting with irearms (6.9%), physical assault by a family member (11.6%) and having been seriously injured in the last 12 months (10.3%). The situations of violence were more prevalent among male students from public schools. The comparison with the 2009 survey showed increased prevalence in all the variables studied. Conclusion: Teenagers are exposed to diferent forms of violence, and the data from the National Survey of School Health can support the planning of preventive actions.
Keywords: Violence. Child. Adolescent. School health. Adolescent behavior. aggression.
Situations of violence experienced by students in
the state capitals and the Federal District: results
from the National Adolescent School-based
Health Survey (PeNSE 2012)
Situações de violência vivenciadas por estudantes nas capitais brasileiras e no
Distrito Federal: resultados da Pesquisa Nacional de Saúde Escolar (PeNSE 2012)
Deborah Carvalho MaltaI,II, Márcio Dênis Medeiros MascarenhasI,III, Antônio Ribeiro DiasIV, Rogério Ruscitto do PradoI,V, Cheila Marina LimaI, Marta Maria Alves da SilvaI,V, Jarbas Barbosa da Silva JúniorI
IDepartment of Non-Communicable Diseases Surveillance and Health, Health Surveillance Secretariat, Ministry of Health –
Brasília (DF), Brazil.
IIUniversidade Federal de Minas Gerais – Belo Horizonte (MG), Brazil.
IIIUniversidade Federal do Piauí – Teresina (PI), Brazil.
IVBrazilian Institute of Geography and Statistics – Rio de Janeiro (RJ), Brazil. VUniversidade Federal de Goiás – Goiânia (GO), Brazil.
VIUniversidade de São Paulo – São Paulo (SP), Brazil.
Corresponding author: Deborah Carvalho Malta. Departamento de Vigilância de Doenças e Agravos Não Transmissíveis e Promoção da Saúde. Secretaria de Vigilância em Saúde, Ministério da Saúde. SAF Sul, Trecho 2, Lote 5/6, Torre I, Edifício Premium, Sala 14, Térreo, CEP: 70070-600, Brasília, DF, Brasil. E-mail: [email protected]
Conlict of interest: nothing to declare – Financing source: none.
INTRODUCTION
Adolescence is the period that comprehends the ages of 10 to 19 years old, and it is an important moment to adopt new practices and behaviors and also to gain autonomy. However, it is also a time of exposure to several risk situations, which can sometimes lead to negative attitudes and exposure to external causes — accidents and violence1. These events may result in deinitive lesions and impairment, thus causing physical, emotional, social damages, besides intense sufering for families and society1-3. Violence is a multicausal phenomenon that presents strong association with economic and sociocultural inequalities, but it is also related with subjective and behavioral aspects of each society4. For the World Health Organization (WHO)5, violence is the “use of physical strength or power, be it real or in form of threats, against oneself, against somebody else, or against a group or a community, that can result or with any possibility of resulting in lesion, death, psychological damage, impaired development or deprivation”.
Accidents and violence are a major public health problem among children and adolescents. According to WHO1, unintentional injuries (accidents) are an important cause of death and impairment among children aged less than 18 years old. About 875,000 annual deaths are caused by accidents and violence, and 10 to 30 million children in the world have their lives afected by these causes somehow. These events are not equally distributed, and more than 95% of violent events involving children occur in low and mid-income contries2,5.
In Brazil, external causes among adolescents (10 to 19 years old) were responsible, in 2011, for 133,393 hospitalizations in institutions that integrate the Uniied Health System, as well
RESUMO:Objetivo:Descrever os eventos violentos vivenciados por adolescentes na escola, no entorno da escola e na família, além de comparar os resultados da Pesquisa Nacional de Saúde do Escolar nos anos 2009 e 2012. Métodos: Foram analisados indicadores referentes a situações de violência envolvendo adolescentes. Calcularam-se prevalências e intervalos de coniança de 95% para os eventos de interesse segundo sexo e dependência administrativa da escola (pública ou privada) e regiões. Resultados: As prevalências encontradas foram: insegurança no trajeto casa-escola (8,8%), insegurança na escola (8,0%), agressão física nos últimos 12 meses (15,9%), envolver-se em briga nos últimos 12 meses (20,7%), briga com arma branca (7,3%), briga com arma de fogo (6,4%), agressão física por familiar (10,6%) e ter se ferido seriamente nos últimos 12 meses (10,3%). As situações de violência foram mais prevalentes entre estudantes do sexo masculino e de escolas públicas. A comparação com a pesquisa de 2009 mostrou aumento da prevalência em todas as variáveis pesquisadas. Conclusão: Os adolescentes estão expostos a diferentes manifestações de violência, e os dados da Pesquisa Nacional de Saúde do Escolar podem apoiar o planejamento das ações de prevenção.
as for 16,050 deaths6,7. Children, adolescents and teenagers are among the population groups that are mostly victimized by violence. Among adolescents, physical violence (aggression) tends to be more frequent due to the urban context of violence, inequalities, exposure to ights, involvement with ire arms, gang disputes, exposure to violent acts practiced by strangers, alcohol consumption and other drugs3,8,9.
Any act of violence perpetrated against children and adolescents should be understood as a violation of the Human Rights10. Information about this type of problem should be accessible for administrators and decision makers. Therefore, the National Adolescent School-Based Survey (PeNSE)11,12 contributes by monitoring violent situations experienced by students in Brazil. By identifying risk factors, the circumstances and the social environment in which violence occurs, the objective is to provide more information for the design of public policies in order to generate the prevention and promotion of health and culture of peace. This article aims at describing the violent events experienced by young students at school, in the school surroundings and in the family environment, besides comparing the results from PeNSE in 2009 and in 2012.
METHODS
Data come from the National Adolescent School-Based Survey (PeNSE)11,12, conducted by the Brazilian Institute of Geography and Statistics (IBGE) together with the Ministry of Health. Data referring to 9th graders in elementary school, from public and private Brazilian institutions in 2012 were analyzed.
The sample (n = 109,104) was measured to estimate population parameters for Brazil, ive geographic regions (North, Northeast, Southeast, South and Center-West) and each one of the 26 State capitals of the Federation and the Federal District11,12.
Each of the State capitals, and the Federal District, was deined as a geographic stratum. The other cities that are not capitals were grouped inside each of the ive major geographic regions, thus forming ive strata. For geographic strata formed by cities that are not capitals, the selection was carried out in three stages. In the irst stage, groups of cities were selected (primary sampling units); in the second stage, schools were selected (secondary sampling units); in the third stage, classrooms were selected (tertiary sampling units), whose students formed the sample of students of each stratum.
In the strata of the 27 capitals, cluster sampling occurred in two stages. In the irst stage, schools were selected, and, in the second stage, classrooms were selected, and all of the students who were present in the selected schools. More details about the sampling plan can be obtained in speciic publications11,12.
In this article, violent situations involving teenage students were analyzed. Afterwards, the indicators and the respective question in the questionnaire were described:
• Insecurity in the route home-school (“In the past 30 days, how often did you not go to school because you did not feel safe on the route school-home or home-school?”);
• Insecurity at school (“In the past 30 days, how often did you not go to school because you did not feel safe there?”);
• Fighting with ire arm (“In the past 30 days, were you involved in a ight in which someone used a ire weapon, such as a gun or a rile?”);
• Fighting with cold weapon (“In the past 30 days, were you involved a ight in which someone used any other weapon, like knives, penknives, ish knife, stones, sticks or bottle?”);
• Physical aggression by an adult in the family (“In the past 30 days, how often were you physically assaulted by an adult in your family?”).
In 2012, new variables were added:
• Physical aggression in the past 12 months (“In the past 12 months, how often were you physically assaulted?”);
• Getting involved in a ight (“In the past 12 months, how often were you involved in a ight (physical struggle”)?);
• Being injured (“In the past 12 months, how often were you seriously injured?”).
Prevalence rates and the respective 95% confidence intervals (95%CI) were calculated for the events of interest according to gender and administration (public or private school) in Brazil. Prevalence rates of indicators according to geographic region were also presented.
The common variables for the strata of 26 capitals and the Federal District were compared in both studies (PeNSE 2009 and 2012). The sampling size for the study of the capitals in 2009 was of 60,973, and, in 2012, of 61,145 students. The collected data constituted the data base of the study, being analyzed with the software SPSS, version 20.0.
Students participated voluntarily, and they were free to not participate, or to answer the questionnaire only partially or completely. All of the information of the students, as well as the schools’, was collected and kept in secrecy. The project was approved by the Research Ethics Committee of the Ministry of Health, report n. 192/2012, on 27/03/2012.
RESULTS
Out of the interviewed students, 47.8% were male, 52.2% were female students, 86% of them were aged between 13 and 15 years old, 82.8% studied in public schools and 16.2% attended private schools12.
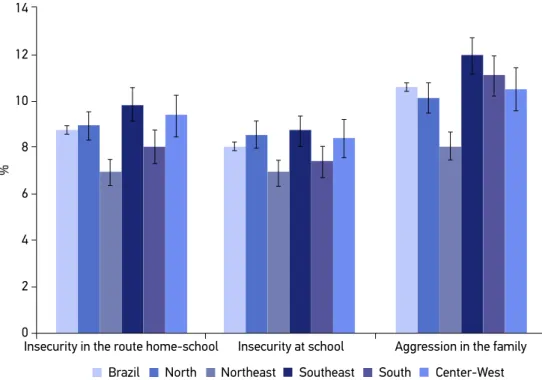
Results showed that, in 2012, 8.8% (95%CI 8.3 – 9.2) of the students did not go to school in the 30 days prior to the study because they did not feel safe on the route from home to school, or from school to the household. Such insecurity was more frequent among male students (92.%; 95%CI 9.9 – 9.4) in relation to female students (8.3%; 95%CI 8.0 – 8.7) and those attending public schools (9.5%: 95%CI 9.0 – 10.2) in comparison to private schools (5.0%; 95%CI 4.7 – 5.3). Insecurity at school was reported by 8.0% (95%CI 7.3 – 8.8) of the interviewees, being more frequent among boys (8.8% – 95%CI 8.5 – 9.0) than girls (7.4%; 95%CI 7.1 – 7.7), and among students attending public schools (8.9%; 95%CI 8.3 – 9.5) than those in private schools (4.2%; 95%CI 3.9 – 4.5) (Table 1). These indicators were higher in the Southeast region (9.9% and 8.8% for insecurity on the route home-school and at school, respectively), while the Northeast region presented the lowest frequencies (Figure 2).
Information about physical assault performed by an adult in the family in the past 30 days was mentioned by 10.6% (95%CI 10.1 – 11.1) of the students, and aggressions were more frequent among girls (11.5%; 95%CI 10.7 – 12.3) than boys (9.6%; 95%CI 8.2 – 11.0) and among students attending public schools (10.8%; 95%CI 10.2 – 11.3) than those in private schools (9.9%; 95%CI 9.5 – 10.3) (Table 1). This event was more frequent in the Southeast region (12.0%), and less frequent in the Northeast (Figure 2).
Being involved in fights in the past 12 months was declared by 20.7% of the students, being more common among males (25%; 95%CI 24.0 – 26.0) than females (8.6%; 95%CI 6.9 – 10.8), with no statistically significant differences between public and private schools. Being involved in fights with fire arms in the past 30 days was declared by 6.4% (95%CI 6.0 – 6.9) of the students, being more common among male students (8.8%; 95%CI 8.3 – 9.2) in relation to female students (4.3%; 95%CI 4.0 – 4.6).
134,310 enrolled students
132,123 students attending
classes
110,873 (84%) students on the day
of the interviews
109,104 (83%)
of valid interviews
1,769 (13%) losses
(1,651 refusals + 118 with no information
about sex)
Violent situation
Total
Gender School administration
Femals Male Private Public
% 95%CI % 95%CI % 95%CI % 95%CI % 95%CI
Insecurity in the route
home-school
8.8 8.3 – 9.2 8.3 8.0 – 8.7 9.2 9.9 – 9.4 5.0 4.7 – 5.3 9.5 9.0 – 10.2
Insecurity at
school 8.0 7.3 – 8.8 7.4 7.1 – 7.7 8.8 8.5 – 9.0 4.2 3.9 – 4.5 8.9 8.3 – 9.5
Physical assault by an adult in
the family 10.6 10.1 – 11.1 11.5 10.7 – 12.3 9.6 8.2 – 11.0 9.9 9.5 – 10.3 10.8 10.2 – 11.3
Fighting
with ire arm 6.4 6.0 – 6.9 4.3 4.0 – 4.6 8.8 8.3 – 9.2 4.9 4.5 – 5.3 6.7 6.2 – 7.3
Fighting with
white weapon 7.3 6.9 – 7.7 4.8 4.4 – 5.2 10.1 9.6 – 10.5 6.2 5.9 – 6.5 7.6 7.1 – 8.0
Getting involved
in a ight in the
past 12 months
20.7 20.4 – 20.9 8.6 6.9 – 10.8 25.0 24.0 – 26.0 21.6 21.0 – 22.2 20.5 19.9 – 21.1
Physical aggression in the past 12 months
15.9 15.7 – 16.1 15.3 14.9 – 15.8 16.6 16.3 – 16.9 17.8 17.3 – 18.4 15.5 15.0 – 16.1
Seriously
injured 10.3 10.1 – 10.4 8.9 8.6 – 9.2 11.8 11.5 – 12.0 8.8 8.4 – 9.2 10.6 10.1 – 11.1 Table 1. Prevalence (%)* and respective conidence intervals of 95% of Brazilian 9th graders who have experienced violence situations by gender and school type. Brazil, 2012.
Source: IBGE (Brazilian Institute of Geography and Statistics), Department of Research, Coordination of Population and Social Indicators, National Adolescent School-based Health Survey, 2012.
*Weighted percentage to represent the population of students enrolled and attending the 9th grade of elementary
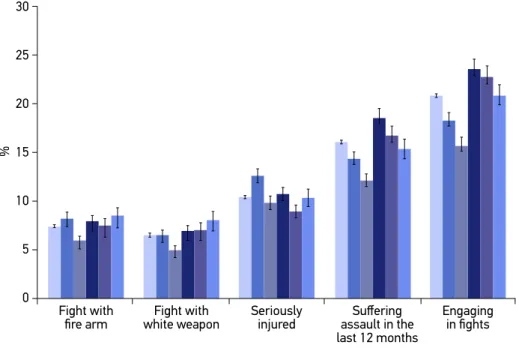
It was possible to observe significant differences between types of schools, being 6.7% (95%CI 6.2 – 7.3) among students attending public schools and 4.9% (95%CI 4.5 – 5.4) of students in private schools (Table 1). The Center-West region presented the highest percentage, with 8.4%, followed by the Northeast region, with 5.8% (Figure 3). Concerning fights with white weapons in the past 30 days, 7.3% (95%CI 6.9 – 7.7) of students gave an affirmative answer to this question, being more frequent among boys (10.1%; 95%CI 9.6 – 10.5) than girls (4.8%; 95%CI 4.4 – 5.2). Among students in public schools this prevalence was of 7.6% (95%CI 7.1 – 8.0), while for the ones in private schools, the prevalence was of 6.2% (95%CI 5.9 – 6.5) (Table 1). The Center-West region presented the highest percentage (8.4%) (Figure 3).
Having been physically assaulted in the past 12 months was reported by 15.9% (95%CI 15.7 – 16.1), being more frequent among boys and students in the private schools (17.8%; 17.3 – 18.4) versus 15.5% (95%CI 15.0 – 16.1) in public schools. The percentage of students
who reported having been seriously injured once or more times in the past 12 months was
Brazil North Northeast Southeast South Center-West
14
12
Insecurity in the route home-school Insecurity at school Aggression in the family
10
8
%
6
4
2
0
Figure 2. Prevalence (%)* and respective 95% conidence intervals of Brazilian 9th graders who experienced insecurity on the way route between home-school, insecurity in school and physical abuse in the family, according to macroregions. Brazil, 2012.
Source: IBGE (Brazilian Institute of Geography and Statistics), Department of Research, Coordination of Population and Social Indicators, National Adolescent School-based Health Survey, 2012.
*Weighted percentage to represent the population of students enrolled and attending the 9th grade of elementary
of 10.3% (95%CI 10.1 – 10.4). According to gender, the reference to this type of event was more common among boys (11.8%; 95%CI 11.5 – 12.0) than girls (8.9%; 95%CI 8.6 – 9.2). Occurrences in students of public schools were more frequent (10.6%; 95%CI 10.1 – 11.1) than for those in private schools (8.8%; 95%CI; 8.4 – 9.2) (Table 1). The North region presented the highest frequency (12.5%), and the South one had the lowest one (Figure 3). Tables 2 and 3 present the comparison of prevalence rates obtained in the studies of 2009 and 2012 with regard to violent situations involving students according to gender and administration of the school. A signiicant increase in the proportion of students who experienced violent situations was observed, which demonstrates worse rates for all of the analyzed indicators (insecurity in the route home-school, insecurity at school, getting involved in a ight with white weapon, ights with ire arm , being physically assaulted in the family). The change was statistically signiicant for both genders, in public and private schools (Tables 2 and 3).
30
Fight with
ire arm white weaponFight with Seriouslyinjured assault in theSufering last 12 months
Engaging in ights 25
20
% 15
10
5
0
Brazil North Northeast Southeast South Center-West
Figure 3. Prevalence (%)* and respective conidence intervals of 95% of Brazilian 9th graders who experienced violence by ighting with a irearm in the last 30 days, ighting with a white wea-pon in the past 30 days, sufering an assault in the last 12 months, engaging in ights in the last 12 months and being seriously injured. Brazil, Regions, 2012.
Source: IBGE (Brazilian Institute of Geography and Statistics), Department of Research, Coordination of Population and Social Indicators, National Adolescent School-based Health Survey, 2012.
*Percentage weighted to represent the population of students enrolled and attending the 9th grade of elementary
Violent situation
2009
Total Female Male
% 95%CI % 95%CI % 95%CI
Insecurity in the route
home-school 6.4 6.1 – 6.8 6.0 5.5 – 6.5 6.9 6.4 – 7.5
Insecurity at school 5.5 5.2 – 5.8 5.0 4.6 – 5.4 6.1 5.6 – 6.6
Physical aggression by an adult in the
family
9.5 9.1 – 9.9 10.0 9.4 – 10.6 9.0 8.4 – 9.6
Fighting with ire arm 4.0 3.7 – 4.3 2.3 2.0 – 2.5 6.0 5.5 – 6.5
Fighting with
white weapon 6.1 5.7 – 6.4 3.4 3.1 – 3.7 9.0 8.4 – 9.6
Violent situation
2012
Total Female Male
% 95%CI % 95%CI % 95%CI
Insecurity in the route
home-school 9.1 8.7 – 9.4 9.0 8.3 – 9.7 9.1 8.6 – 9.7
Insecurity at school 8.0 7.7 – 8.4 7.9 7.3 – 8.6 8.1 7.6 – 8.6
Physical aggression by an adult in the
family
11.6 11.1 – 12.1 12.9 12.3 – 13.6 10.2 9.6 – 10.9
Fighting with ire arm 6.9 6.6 – 7.3 4.6 4.2 – 4.9 9.4 8.8 – 10.0
Fighting with
white weapon 8.3 7.8 – 8.7 5.3 4.9 – 5.8 11.3 10.6 – 12.1 Table 2. Comparsion of the prevalences (%)* and respective conidence intervals of 95% of Brazilian 9th graders who have experienced some kind of violent situation by gender. Brazilian States Capitals and Federal District, 2009 and 2012.
Source: IBGE (Brazilian Institute of Geography and Statistics), Department of Research, Coordination of Population and Social Indicators, National Adolescent School-based Health Survey, 2012.
*Percentage weighted to represent the population of students enrolled and attending the 9th grade of elementary
Violent situation
2009
Total Private Public
% 95%CI % 95%CI % 95%CI
Insecurity in the route
home-school 6.4 6.1 – 6.8 4.0 3.6 – 4.5 7.0 6.6 – 7.5
Insecurity at school 5.5 5.2 – 5.8 2.9 2.5 – 3.4 6.2 5.8 – 6.6
Physical aggression by an adult in the
family 9.5 9.1 – 9.9 9.3 8.5 – 10.1 9.6 9.1 – 10.1
Fighting with ire arm 4.0 3.7 – 4.3 2.6 2.2 – 2.9 4.4 4.1 – 4.7
Fighting with
white weapon 6.1 5.7 – 6.4 4.7 4.2 – 5.3 6.4 6.0 – 6.8
Violent situation
2012
Total Private Public
% 95%CI % 95%CI % 95%CI
Insecurity in the route
home-school 9.1 8.7 – 9.4 5.2 4.7 – 5.8 10.4 9.3 – 11.5
Insecurity at school 8.0 7.7 – 8.4 4.0 3.5 – 4.5 9.4 8.3 – 10.7
Physical aggression by an adult in the
family
11.6 11.1 – 12.1 9.8 9.1 – 10.5 12.2 11.6 – 12.8
Fighting with ire arm 6.9 6.6 – 7.3 5.1 4.5 – 5.7 7.6 7.2 – 8.0
Fighting with
white weapon 8.3 7.8 – 8.7 7.0 6.3 – 7.7 8.7 8.1 – 9.3 Table 3. Comparison of the prevalences (%)* and respective 95% conidence intervals of Brazilian 9th graders who have experienced some kind of violent situation by school type in the Brazilian States Capitals and Federal District. Brazil, 2009 and 2012.
Source: IBGE (Brazilian Institute of Geography and Statistics), Department of Research, Coordination of Population and Social Indicators, National Adolescent School-based Health Survey, 2012.
*Percentage weighted to represent the population of students enrolled and attending the 9th grade of elementary
DISCUSSION
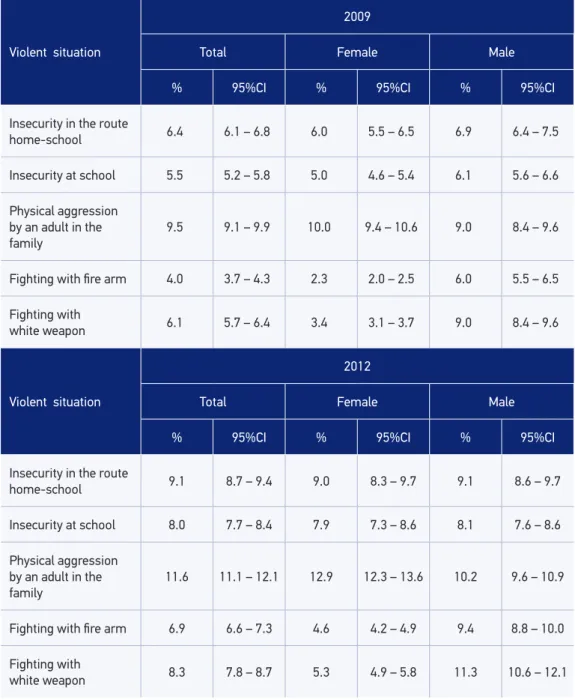
The results of PeNSE 201212 demonstrate that the violent events were more prevalent among male students in public schools, for most of the indicators. One out of ten adolescents reported insecurity in the route home-school and at school, physical assault by a family member and physical aggression in general. Being involved in ights in the past 30 days was reported by one out of ive adolescents: about 6 and 7% were involved in ights in which someone had a cold weapon or a ire arm, respectively. In relation to the study of 2009, the prevalence of all of the analyzed variables increased, and the violent situations experienced by the adolescents got worse.
External causes, especially aggression, have been the main cause of death among adolescents in Brazil for some decades, therefore the approach of violence in the school environment becomes a priority5,7. This scenario is of major concern, since violence against adolescents is one of the most visible expressions of violence in the society and one of the main public health problems, therefore exposing children and adolescents to this situation at an early stage, leading them to sufer the consequences and traumas for the rest of their lives5.
In general, male students report being exposed to violent situations more often. This observation may relect gender issues, which tend to be reproduced among male children and adolescents, being associated with living with and expressing aggressiveness13.
The perception of insecurity in the route or in the school has been investigated in other countries. A survey conducted with high school students in the United States of America (USA) showed that 5.9% of the students stopped going to school in the 30 days prior to the study because they felt insecure at school or on the way to school14. Missing schools due to insecurity is considered to be an important indicator for mapping contextual violent situatons15-17. Studies have pointed out the growing problem of missing school due to insecurity as a consequence of the exposure of young students to violent situations15.
Another study in Brazil also identiied that insecurity in school is a result of several situations, such as the action of gangs, the insecurity on the route from the household to school and vice-versa, insecurity at the bus stop. Classrooms are seen as spaces where violent situations occur by 22.4% of the students and 20.8% of the teachers18.
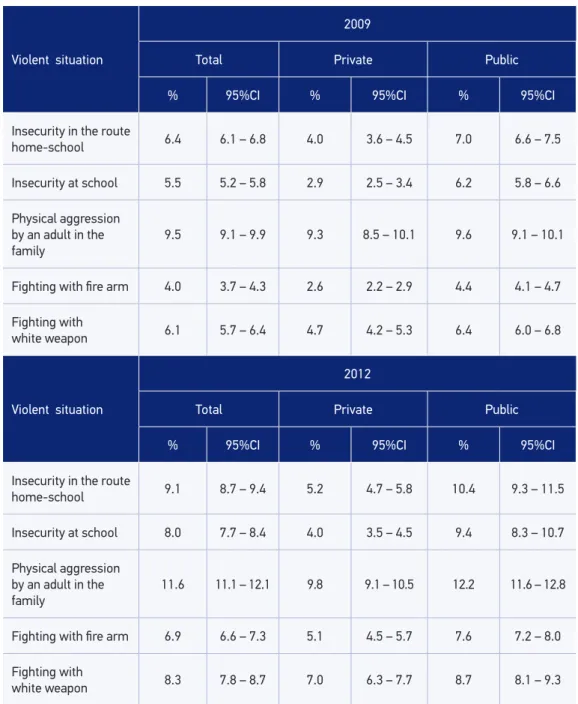
PeNSE indicated that, in general, the insecurity situation was mostly reported in public schools, which can relect social inequalities and the unequal distribution of violence, with diferent exposures and risks. Students attending public schools tend to be more exposed to violent situations. Many of these schools are located in risky locations, with violent surroundings, which can justify the higher perception of violence and involvement of students in these social context situations. The violence in the surroundings can enter the school context18-20.
or more in the 12 months prior to the research, with prevalence of 13% at the age of 13 and 10% at the age of 15. The prevalence of physical struggle reported in most countries decreased with age, that is, it is lower among older students (15 years old and more), besides being more common among boys (25%) than girls (7%)21.
The question about injuries in the past 12 months was introduced in 2012, and the frequency among Brazilian students was higher than in European countries and lower than in the United States and in African countries. This can relect local diferences in violent contexts14,21.
In the USA, 32.8% of the high school students (14 to 17 years old) informed having been involved in a ight in the past 12 months, and 12.4% of the episodes occurred inside the school environment. In the USA, the resulting injuries required medical or nursing assistance in 3.9% of the cases, due to severity14.
In Africa, a survey about the health of the student conducted in six countries (Kenya, Namibia, Zambia, Zimbabwe, Swaziland) found mean prevalence of 68.2% of reports of injuries resulting from accidents in the past 12 months22. International studies show different realities and frequencies of involvement in fights, depending on the cultural context21,23. All over the world, studies have indicated the more common involvement of boys in fights and struggles, thus confirming the results obtained by PeNSE 2009 and 2012 in Brazil3.
A cross-sectional study performed with 6,283 students in Namibia24 showed that physical struggle in the 12 months prior to the research was positively associated with risk habits, such as smoking, consuming alcohol, using drugs and being bullied; on the other hand, parental supervision was considered to be a protective factor for the participation in physical struggle in the past 12 months.
A study conducted in public schools of São Paulo25 revealed that the practice of violent acts was reported by 25% of the students, being described as destroying public property (25%), possession of cold weapons (9%) and ire arms (2%).
The morbimortality of violence gains strength when students get involved with weapons, both cold of fire arms. In the USA, 16.6% of the students reported having taken a cold weapon to school in the past 30 days, while 5.1% reported carrying a fire arm to school14.
Data from PeNSE expose that this reality is relatively frequent among Brazilian students, since 7.3% of them reported having been involved in ights by using cold weapons, and 6.4% of them, with ire arms. It was also possible to observed a 50% increase in the prevalence rates of these indicators between 2009 and 2012. The pattern of PeNSE 2009 was maintained in 2012: higher frequencies among male students attending public schools.
by students. Such a phenomenon has been discussed in literature, showing that intrafamily violence occurs in diferent social strata26.
From the limitations of this study, it is worth to mention that PeNSE relects the universe of students in the Brazilian capitals, which may not represent all of adolescent students in the country. With regard to this theme, the situations of violence afecting those outside school are probably worse. The study was based on data collected in a cross-sectional study, which has limitations to attribute causality, as well as in relation to the set of researched themes, which may not have analyzed the whole subject.
CONCLUSION
Violence in society is also expressed among teenagers, and aggressions, physical attacks and ights end up being manifested as an expression of these violent acts21,23.
Adolescents are exposed to and live with different manifestations of violence in both institutions that should supposedly ensure their protection and health and safe development: the school and the household. Violence at school is particularly a paradox, because of the expectation that the school should promote safety and protection to students19.
These indings may encourage the development of other studies that can analyze gender issues and social determinations which victimize, more frequently, boys and students in public schools. Studies like this can support public policies of health promotion and social protection, and respond to the demands of the Statute of the Child and Adolescent (ECA), which aims at ensuring that no child or adolescent should be a target of discrimination, negligence, exploration, violence, cruelty or aggression inside or outside the family environment10.
The Ministry of Health implemented the Accident and Violence Surveillance System (VIVA), in 20066. Since then, the notiication of violence and abuse against children and adolescents has increased progressively. Besides, in 2008, the Ministry of Health and the Ministry of Education implemented the School health Program (PSE), which supports cities when it comes to actions of health promotion, including activities of culture of peace and violence prevention, prevention and reduction of alcohol consumption, tobacco and other drugs, besides the promotion of sexual and reproductive health, healthy diet, physical activity, among others27.
REFERENCES
1. Organização Mundial de Saúde. Health topics: adolescent health [Internet]. Disponível em http:// www.who.int/topics/adolescent_health/en/ (Acessado em 30 de janeiro de 2013).
2. Organização Mundial de Saúde. World report on child injury prevention. Genebra: WHO; 2008.
3. Malta DC, Souza ER, Silva MM, Silva CS, Andreazzi MA, Crespo C, et al. Vivência de violência entre escolares brasileiros: resultados da Pesquisa Nacional de Saúde do Escolar (PeNSE). Ciênc Saúde Coletiva 2010; 15(2): 3053-63.
4. Minayo MC. Violência e Saúde. Rio de Janeiro: Editora Fiocruz; 2006.
5. Organização Mundial de Saúde. World report on violence and health. Genebra: WHO; 2002. p 1-44.
6. Brasil. Secretaria de Vigilância em Saúde. Departamento de Análise de Situação de Saúde. Viva: vigilância de violências e acidentes, 2008 e 2009. Brasília: Ministério da Saúde; 2010.
7. Brasil. Secretaria de Vigilância em Saúde, Departamento de Análise de Situação em Saúde. Saúde Brasil 2011: uma análise da situação de saúde. Brasília: Ministério da Saúde; 2012.
8. Brasil. Departamento de Informática do SUS. Informações em Saúde [Internet]. Brasília: Ministério da Saúde; 2013. Disponível em: http://www.datasus. gov.br (Acessado em 5 de outubro de 2013).
9. Stoddard SA, Henly SJ, Sieving RE, Bolland J. Social connections, trajectories of hopelessness and serious violence in impoverished urban youth. J Youth Adolesc 2011; 40(3): 278-95.
10. Brasil. Lei nº 8.069 de 13 de julho de 1990. Dispõe sobre o Estatuto da Criança e do Adolescente e dá outras providências. Diário Oicial da União. 1990; Seção 1: 13563. Portuguese.
11. Brasil. Instituto Brasileiro de Geograia e Estatística. Pesquisa Nacional de Saúde do Escolar (PeNSE) – 2009. Rio de Janeiro: IBGE, 2009.
12. Brasil. Instituto Brasileiro de Geograia e Estatística. Pesquisa Nacional de Saúde do Escolar (PeNSE) - 2012. Rio de Janeiro: IBGE; 2013.
13. Guimarães NM, Pasian SR. Agressividade na adolescência: experiência e expressão da raiva. Psicol Estud 2006; 11(1): 89-97.
14. EUA. Centers for Disease Control and Prevention. National Youth Risk Behavior Survey (YRBS) [Internet]. Atlanta: CDC. Disponível em: http://www.cdc.gov/HealthyYouth/ yrbs/index.htm (Acessado em 15 de maio de 2013).
15. Granero R, Poni ES, Escobar-Poni BC, Escobar J. Trends of violence among 7th, 8th and 9th grade
students in the state of Lara, Venezuela: The Global School Health Survey 2004 and 2008. Arch Public Health 2011; 69(1): 7.
16. Hansen C, Sanders S, Massaro S, Last C. Predictors of severity of absenteeism in children with the realm of juvenile justice. Family Relations 2006; 55: 190-9.
17. Heymann DL, Rodier GR. Special Issue: Global Surveillance of Communicable Diseases. Emerg Infect Dis 1998; 4(3): 362-5.
18. Macedo RMA, Bomim MCA. Violências na escola. Rev Diálogo Educ 2009; 9(28): 605-18.
19. Chrispino A, Dusi ML. Uma proposta de modelagem de política pública para a redução da violência escolar e promoção da Cultura da Paz. Ensaio: Aval Pol Públ Educ 2008; 16(61): 597-624.
20. Leme MIS. A gestão da violência escolar. Rev Diálogo Educ 2009; 9(28): 541-55.
21. Organização Mundial de Saúde. Social determinants of health and well-being among young people: Health Behaviour in School-Aged Children (HBSC) study. International report from the 2009/2010 survey. Genebra: WHO; 2012 (Health Policy for Children and Adolescents, No. 6).
22. Peltzer K. Injury and social determinants among in-school adolescents in six African countries. Inj Prev 2008; 14(6): 381-8.
23. Nansel TR, Overpeck MD, Haynie DL, Ruan WJ, Scheidt PC. Relationships between bullying and violence among US youth. Arch Pediatr Adolesc Med 2003; 157(4): 348-53.
24. Rudatsikira E, Siziya S, Kazembe LN, Muula AS. Prevalence and associated factors of physical ighting among school-going adolescents in Namibia. Ann Gen Psychiatry 2007; 6(1): 18.
25. Abramovay M, Rua MG. Violências nas escolas. Brasília (DF): Unesco; 2003.
26. Minayo MCS, Assis SG, Souza ER, Njaine K, Deslandes SF, Silva CMFP et al. Fala Galera: juventude, violência e cidadania no Rio de Janeiro. Rio de Janeiro: Garamond; 1999.
27. Brasil. Ministério da Saúde. Programa Saúde na Escola [Internet]. Brasília (DF): Ministério da Saúde; 2010. Disponível em: http://dab.saude.gov.br/programa_ saude_na_escola.php (Acessado em 20 de junho de 2012).
Received on: 11/21/2013