ISSN 1546-9239
© 2009 Science Publications
Corresponding Author: Abdelatif Hassini, Laboratory of Application and Analysis of Radiations LAAR, Department of Physics, USTOMB. El M’nouer B.P.1505 Oran, Algeria Tel: +213 74374379 Fax: +213 41560350
Active Fire Monitoring with Level 1.5 MSG Satellite Images
1
Abdelatif Hassini,
2Farid Benabdelouahed,
1Noureddine Benabadji and
1Ahmed Hafid Belbachir
1
Laboratory of Application and Analysis of Radiations LAAR,
Department of Physics USTOMB. El M’nouer B.P.1505 Oran, Algeria
2
University of Jean Monet, Saint Etienne UMR 5600, France
Abstract: The first of the new generation of Meteosat satellites, known as Meteosat Second Generation (MSG-1), was launched in August 2002. As with the current Meteosat series, MSG is spin-stabilized and capable of greatly enhanced Earth observations. The satellite’s 12-channel imager, known formally as the Spinning Enhanced Visible and Infrared Imager (SEVIRI), observes the full disk of the Earth with an unprecedented repeat cycle of 15 min in 12 spectral wavelength regions or channels. Our goal is to collect maximum MSG images data with our real time acquisition system, to trust the continuous observation of the Earth’s full disk with a multi-spectral imager. This research gives an overview of the MSG SEVIRI instrument, the general approach for the active fire monitoring and the description of the algorithm together with the practical application of the tests and the algorithm. The AFMA algorithm (Active Fire Monitoring Algorithm) developed in this work is able to detect most of the existing active fires with a minimum of false alarms. The AFMA algorithm distinguishes between Diurnal and Nocturnal periods of day. The algorithm itself is based on a simple threshold algorithm. A few results are described and discussed.
Key words: Satellite images, SEVIRI, MSG, fires, AFMA algorithm
INTRODUCTION
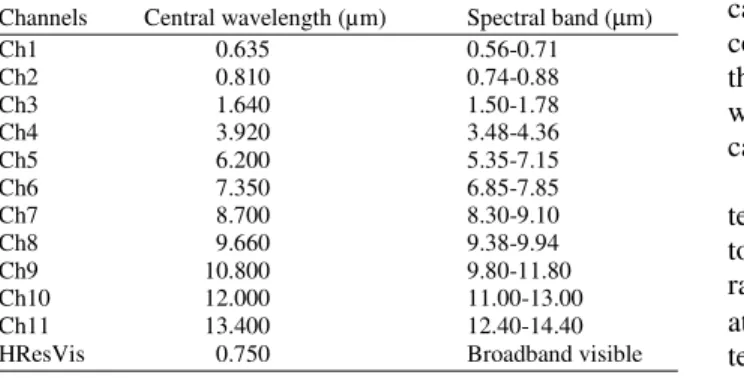
The current generation of geostationary METEOSAT (Meteosat Second Generation, MSG) has 12 channels with a horizontal resolution of 3 km at the Sub-Satellite Point SSP and an image scan rate of 15 min. For the MSG, an algorithm for active fire monitoring has been developed (Active Fire Monitoring Algorithm, AFMA). This algorithm makes use of the MSG channels, in particular of channels Ch4 (IR 3.9) and Ch9 (IR10.8). Table 1 shows the characteristics of the twelve MSG-SEVIRI channels.
Table 1: Characteristics of the MSG-SEVIRI channels
Channels Central wavelength (µm) Spectral band (µm)
Ch1 0.635 0.56-0.71
Ch2 0.810 0.74-0.88
Ch3 1.640 1.50-1.78
Ch4 3.920 3.48-4.36
Ch5 6.200 5.35-7.15
Ch6 7.350 6.85-7.85
Ch7 8.700 8.30-9.10
Ch8 9.660 9.38-9.94
Ch9 10.800 9.80-11.80
Ch10 12.000 11.00-13.00
Ch11 13.400 12.40-14.40
HResVis 0.750 Broadband visible
Each raw image received from the MSG satellite is radiometrically calibrated. The objectives for the radiometric calibration of the level 1.5 images are:
• To assure a linear relation between radiance and counts
• To assure an equalised response among detectors • To apply the derived or received calibration
information to the image data, therefore supplying a stable radiance-to-count relation for the level 1.5 data
The first two points refer to a pure relative calibration where the absolute relationship between counts and radiance is not considered, but rather that the detector output is linear and homogeneous over the whole image. The third point refers to the absolute calibration[1].
Forest and vegetation fires have typical temperatures in the range of 500-1000°K[2]. According to Wien’s Displacement Law, the peak emission of radiance for blackbody surfaces of such temperatures is at around 4 µm (MSG channel Ch4)[3]. For an ambient
located at approximately 11 µm (MSG channel Ch9).
Active fire detection algorithms from remote sensing use this behaviour to detect hot spot fires. MSG fire monitoring algorithms are typically using the combination of measured brightness temperatures in channels Ch4 and Ch9, their differences and their standard deviation over a 3×3 pixel array. Anyway, the main signal for active fires is an increase of the observed brightness temperature in channel Ch4, compared to the ambient temperature of the neighbouring pixels. The sensitivity of the channel Ch4 to hot spots is so high that it shows small sub-pixel fires, which do not have any significant impact upon the Ch9 temperature. However, the measurements in channel Ch4 can be attenuated or misled by CO2 and
water vapour absorption, solar reflectance during day and sub-pixel clouds over hot surfaces[4,5].
The developed algorithm is named AFMA (Active Fire Monitoring Algorithm) tries to filter out the active fires by a combination of threshold tests using channels Ch4 and Ch9. The algorithm and its limitations are described in this research.
MATERIALS AND METHODS
The spinning enhanced visible and infrared imager (SEVIRI): The main components of active fire remote sensing comprise the remotely sensed (e.g., MSG-SEVIRI) data and the AFMA algorithm used to detect fire pixels from the data.
The overall Spinning Enhanced Visible and Infrared Imager (SEVIRI) layout is based on a compact three-mirror telescope and scan assembly. The 42 detectors of the twelve channels are accommodated in the telescope's focal plane in two areas, one at 20°C for solar channels (centred at wavelengths around 0.6, 0.8, 1.6 µm and about 0.75 µm for High Resolution Visible
(HResVis) channel. The thermal infrared detectors (centred at wavelengths around 3.9, 6.2, 7.3, 8.7, 9.7, 10.48, 12.0 and 13.4 µm) are passively cooled down
(85°K or 95°K) to optimise their performance. The compact design allows the insertion of a small black body for full-pupil calibration. The response by every detector to the target's radiation is converted into an electronic signal by means of pre-amplifiers and a main detection unit. The amplification can be adjusted to the needs a various stages of the signal processing. The full image processing from raw counts to level 1.5 images is performed by the IMage Processing Facility (IMPF) branch of EUMETSAT[6].
MSG-1 and MSG-2 receiving station:
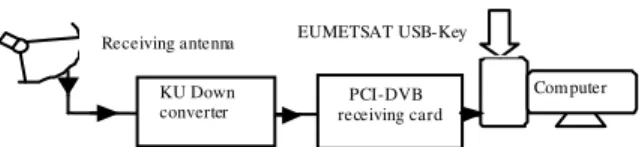
Hardware: To receive MSG-1 and MSG-2 data from
KU Down converter
Com puter PCI-DVB
receiving card Receiving antenna EUMETSAT USB-Key
Fig. 1: Global synoptic of MSG acquisition system
the EUMETSAT (EUropean organization for the exploitation of METeorological SATellites) DVB (Digital Video Broadcasting ) Service, a complete DVB system is installed in our Laboratory and comprise a satellite receiving dish to be mounted outside, an LNB (Low Noise Block) which converts the 11GHz signal down to the 1GHz region and amplifies it to overcome cable loss, good satellite cable terminated with F-connectors to connect the LNB to DVB card and the DVB card itself which fits into one of the PCI slots inside a Personal Computer. Note that a 5-volt PCI slot is required. For Meteosat-8 and Meteosat-9 Eumetsat recommend that to have a separate PC dedicated to data capture and file sharing and that it should be at least a 2 GHz Pentium IV system or equivalent. For data capture, we have currently using a Pentium IV (3 GHz) machine as Receiver PC. We used in our case Windows XP system. The length of the cable from LNB to PC is about 20 m. Figure 1 shows synoptic of the acquisition system that we have installed[7,8].
Software: To receive MSG data from EUMETSAT via Hotbird 6 satellite relay, we have used special softwares, DVB card will communicate with TechniSat software when it installed. It turns the DVB card into a channel through which files are received from Eumetsat and saved on PC.
All compressed acquired data are opened and treated by using algorithms written in IDL language and compiled with ENVI RSI software.
Input datasets: The AFMA algorithm uses data acquired from MSG 1 (METEOSAT 8) and MSG 2 (METEOSAT 9) geostationary satellites; it uses channels Ch4 and Ch9 for the fire detection and channel Ch7 for the identification of bare soil.
From the cloud mask (derived by the SCE algorithm) the clear land surface pixels are extracted. A description of the SCE algorithm is given by Lutz in references[9,10].
collected from MSG satellites are not physically exploitable, they must to be calibrated. After that, Active Fire Monitoring Algorithm (AFMA) is applied to land surfaces to depict fire pixels.
Radiometric calibration of level 1.5 data: Level 1.5 MSG data as produced by EUMETSAT contain rectified SEVIRI images in a 10 bit digital format. The images are not only geolocated and transformed to a GEOS projection, they are also representing a fixed radiometric scale. This scale is provided via two linear scaling parameters in the image header (cal_slope and cal_offset). In the case of the solar channels they refer to the vicarious calibration and in the case of the thermal channels they state a pure scaling law for the radiances obtained from the blackbody calibration. From here, we can reproduce the radiance for each spectral band by the relation:
1.5
L = cal_offset + (cal_slope. C ) (1)
Which, C1.5 presents level 1.5 Pixel Count, cal_slope
present calibration slop, cal_offset present calibration offset.
The calibrated radiance L is expressed in mW.m−2.sr−1.(cm−1)−1.
In this study, after the radiometric calibration, infrared channels are converted to thermal images, in the case of visible channels; they are converted to Terrestrial Albedo images.
The radiometric processing from level 1.0 (raw data) to level 1.5 is performed in the following steps: For the thermal channels:
• Linearisation: The non-linearity of the detection chains has been established on ground. This information is used to remove the effects of non-linearity from the measurement
• Conversion into radiances: A baseline conversion is performed to go from counts into radiances. Changes of the detection chain settings on-board are corrected for
• Equalisation: Remaining inequalities between detectors of a given channel are corrected for using raw image statistics
• Blackbody calibration: The calibration allows correcting the preliminary estimate of the radiance into accurate numbers
• Scaling: To store the radiance values in the
foreseen 10-bit integer format, a linear scaling is performed using cal_slope and cal_offset. These are chosen so that the necessary dynamic range
falls into the available interval [0, 1023]. When converting raw data into level 1.5 image pixels, also the correction for the scan angle dependency of the gain is taken into account. Thus, cal_slope and cal_offset provide the correct scaling for the full level 1.5 images
For the solar channels:
• Conversion into radiances: In fact solar channels are linear. A baseline conversion is performed to go from counts into radiances
• Equalisation: Remaining inequalities between detectors of a given channel are corrected for using raw image statistics
• Scaling: To store the radiance values in the foreseen 10 bit integer format, a scaling is performed that in practise creates level 1.5 pixels which are very close to the raw count value
• Vicarious calibration: Cal_slope and cal_offset are determined by vicarious calibration and put into the level 1.5 Header. An update is only when a new vicarious calibration becomes available
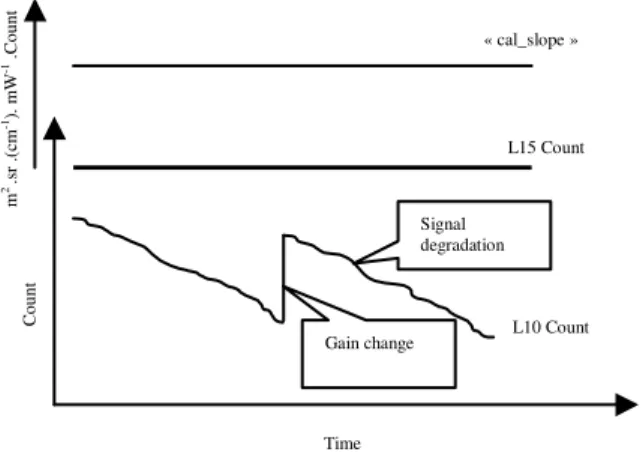
Figure 2 shows the level 1.0 count and the level 1.5 count of an idealised stable IR target.
The raw level 1.0 count degrades in time as contamination increases. At some point, a gain change is performed to maintain image quality. During all this time, the level 1.5 count remains stable as the instrument calibration is used to remove degradation effects from the level 1.5 image. Also, a gain change is transparent to the user. cal_slope represents a pure scaling constant for target radiances to level 1.5 pixel counts, which is not affected by instrument degradation or gain changes.
« cal_slope »
L15 Count L10 Count Signal degradation Gain change C o u n t Time m 2.s r .( cm -1). m W
-1 .
C
o
u
n
t
Active fire monitoring algorithm: The basic principles of the Active Fire Monitoring Algorithm (AFMA) are similar to those already in use for other instruments like GOES[11], AVHRR[12-14] and Modis[15-17].
Active Fire Monitoring Algorithm (AFMA) is only applied to cloud-free land surfaces, which means that off-shore oil burning fires or fires on small islands (e.g., active volcanoes which also fall under the hot spot category) are be monitored by the algorithm. Bare soil land surfaces are also excluded from the processing. Pixels are considered as bare soil, if the surface types are desert or open shrub land, where this classification is taken from a climatologically background information for the MSG field of view[18]. In addition, the brightness temperature difference between channels Ch9 and Ch7 (T9-T7) is used to check for bare soil: Because of the fact that the emissivity of the Ch7 is much smaller for bare soil surfaces than the emissivity of the Ch9, the difference of the two channels is high in these cases.
For the remaining valid pixels, the AFMA algorithm uses the following four criteria to check for fire pixels:
• Brightness temperature of channel Ch4 ( T4) • Standard deviation of channel Ch4 (SDiv4) • Brightness temperature difference of channel Ch4
and Ch9 (T4-T9)
• Standard deviation of channel Ch9 (SDiv9)
The brightness temperature of channel Ch4 (T4) picks up hot spots caused by the fire. The other MSG channels are less sensitive to hot spots. In this test, simple fixed temperature thresholds are used, which are different for day and night (Table 2).
The standard deviation of channel Ch4 (SDiv4) over 3 by 3 pixels around a central hot spot is used to identify the real hot spot versus the natural (heated) background temperature of the surface.
As channel Ch9 is much less sensitive to hot spots, the brightness temperature T9 will not be as high as the brightness temperature T4. This means that the brightness temperature difference of channels Ch4 and Ch9 is also higher than for non-fire pixels.
Table 2: Thresholds for the four fire tests separated for day/night periods
Threshold Active fire
--- ---
Test Day Night Day °K Night °K
T4 Threshold 1 Threshold 5 315 290
SDev Ch4 Threshold 2 Threshold 6 4 4
SDev Ch9 Threshold 3 Threshold 7 2 2
T4- T9 Threshold 4 Threshold 8 10 5
The reduced sub-pixel fire sensitivity of Ch9 is furthermore used to correct for misclassified fire pixels. Pixels that have passed the first three of the above tests can also be missed clouds, highly variable surface types or highly variable terrain elevation. The correction is done by using the standard deviation of channel Ch9, which will be relatively low in fire regions because the fire pixels have similar brightness temperatures as the surrounding non-fire areas.
The standard deviation is calculated on a 3×3 pixel
array around each MSG pixel. Water and cloud pixels are excluded from the calculation of the standard deviation. The standard deviation tests are abandoned if less than 3 pixels can be used for the calculation.
Description of the threshold tests: The algorithm distinguishes between Diurnal and Nocturnal periods of day. The algorithm itself is based on a simple threshold algorithm. From the cloud mask the clear land surface pixels are extracted. In addition the algorithm excludes all pixels, which are defined as desert/bare soil and all pixels for which the Ch9-Ch7 difference is larger than a threshold (= 4°K), from further processing.
Figure 3 and 4 show the conditions for each pixel to be classified as a diurnal fire pixel and as a nocturnal fire pixel respectively. The current thresholds are listed in Table 2. Diurnal period is defined with a local solar
T4 > threshold 1
SDev4 > threshold 2
T4-T9 > threshold 3
SDev9< threshold 4
Diurnal fire pixel
T4 > threshold 5
Sdev 4 >Threshold 6
T4-T9 > threshold 7
Sdev 9<Threshold 8
Nocturnal fire pixel
Fig. 4: AFMA algorithm: Pixel to be classified as a Nocturnal fire pixel
zenith angle lower than 70º and nocturnal period with a solar zenith angle of higher than 90º. For solar zenith angles between 70º and 90º the thresholds are linearly interpolated.
Figure 5 presents a summary flowchart of the different steps used to extract fires pixels by using AFMA algorithm.
RESULTS AND DISCUSSION
The efficiency of each step of the AFMA algorithm was computed from some scenes (12 scans) of 6000 km×11100 km from north of Europe to south of Africa during 2006 fire season. For this training dataset fires were identified by visual inspection after applying all steps denoted in Fig. 5, associated with thresholds of Table 2.
As samples, for diurnal period, the algorithm is applied to Meteosat-8 (MSG-1) data of 1st August 2006 at 13 h 15 min UTC (scan 1). And, for nocturnal period, we used data acquired from 2006, October, 20th, at 21 h 30 min UTC (scan 2).
Figure 6a and b presents respectively, scan 1 and 2 of the twelve channels acquired from SEVIRI sensor after calibration using equation 1 and Table 3.
For the scan 1, during this day, 215 fire pixels were detected by using the AFMA algorithm. The situation is shown in the following.
Fig. 5: The flowchart of the fire-detection algorithm for use with MSG SEVIRI data
Table 3: Calibration Coefficients of scan 1 and scan 2 extracted from the header part of each image files
Channels Cal_slope Cal_offset
Ch.01 -1.1795 0.02313
Ch.02 -1.5161 0.02973
Ch.03 -1.2047 0.02362
Ch.04 -0.1866 0.00366
Ch.05 -0.4242 0.00832
Ch.06 -1.9697 0.03862
Ch.07 -6.4639 0.12674
Ch.08 -5.3020 0.10396
Ch.09 -10.4568 0.20503
Ch.10 -11.3379 0.22231
Ch.11 -8.0380 0.15761
Ch.12 -1.6320 0.03200
Figure 7a shows a part of Channel Ch 4 (IR3.9) as acquired (level 1.5 data). Cities and overlay mask is processed after saving the raw image.
Fig. 6a: Scan 1: The twelve raw images acquired from MSG-1 satellite on 2006. August 1st. at 13:15 UTC
Fig. 6b: Scan 2: The twelve raw images acquired from MSG-1 satellite on 2006. October 20th at 21 h 30 min UTC
In the same scan (i.e., scan 1), major forest fires occurred in Southern regions of Africa (forests of
Fig. 7a: A part of Channel Ch 4 (IR3.9) as acquired (level 1.5 data) on 1st August 2006 at 13h15min UTC. Cities and overlay mask is processed after saving the raw image
Congo-Brazzaville Congo-Kinshasa
N
0 250 Km
Fig. 8a: Channel (CH 4) IR3.9 brightness temperatures on 1st August 2006 at 13 h 15 min UTC. Forest fire pixels in Congo-Brazzaville and Congo-Kinshasa processed with the AFMA algorithm in diurnal period
N
0 250 Km
Fig. 8b: Valid background areas of fire pixels extracted from differences in brightness temperatures between channels Ch4 (IR3.9) and Ch9 (IR10.8)
Figure 8b shows the valid background areas of fire pixels extracted from differences in brightness temperatures between channels Ch4 and Ch9. Bright means large differences. Both, clouds and fires show similar differences and can be clearly separated from
clear surfaces. Yellow squares define the position of each fire pixel in the area of image.
N
0 250 Km
Fig. 8c: Results of the AFMA algorithm for scan1 over Congo-Kinshasa and Congo-Brazzaville. Black points denote active potential fire
Fig. 9a: A part of Channel (CH 4) IR3.9 brightness temperature acquired on 2006. October. 20th at 21h30min UTC. Forest fire pixel in Congo-Kinshasa processed with the AFMA algorithm in nocturnal period
Fig. 9b: A part of Channel (CH 4) IR3.9 brightness temperature acquired on 2006. October. 20th at 21h30min UTC. Forest fire pixel in Guinea processed with the AFMA algorithm in nocturnal period
be separated with the standard deviation in channel Ch4, the standard deviation in channel Ch9 is less sensitive to fires than to cloud edges.
Figure 8c shows the Results of the AFMA algorithm for scan 1 over Kinshasa and Congo-Brazzaville. Black points denote active fires. This image result is combined as fires pixels mask with calibrated channel ch4 in Fig. 8a.
The AFMA algorithm is applied to the nocturnal period of day, by using images of scan 2. During this night, 9 fire pixels were detected. Figure 9a and b present respectively active fire pixel detected in Congo-Kinshasa and Guinea by using AFMA algorithm.
CONCLUSION
The AFMA algorithm (Active Fire Monitoring Algorithm) developed in this work is able to detect most of the existing active fires with a minimum of false alarms.
Application of the AFMA algorithm is non limited by time of day or by regions of the Earth surface (i.e., land surfaces), but this algorithm is only applied to cloud-free land surfaces, which means that off-shore oil burning fires or fires on small islands (e.g., active volcanoes which also fall under the hot spot category) are be monitored by the algorithm. Bare soil land surfaces are also excluded from the processing.
The validation of the algorithm is still on-going and may lead to some further improvements of the algorithm. These will be reflected in the future works.
In particular some of the remaining problems listed below need to be solved, which is:
• Undetected clouds, sub-pixel clouds, fire under
thin Cirrus
• Mixed water (river/lake/coast) and land scenes • Inhomogeneous land surfaces
• Unknown land surface emissivities, in particular in channel CH4
• Dusk and dawn periods with rapidly changing CH4 values.
REFERENCES
1. Buhler, Y. and J. Flewin, 2007. A Planned Change to the MSG level 1.5 image product radiance
definition. Doc. No:
EUM/OPS-MSG/TEN/06/0519, Issue: v1A, EUMETSAT, Darmstadt, Germany, pp: 11-15.
3. Prins, E., J. Schmetz, L. Flynn, D. Hillger and J. Feltz, 2001. Overview of current and future diurnal active fire monitoring using a suite of international geostationary satellites, in Global and Regional Wildfire Monitoring: Current Status and Future Plans, SPB Academic Publishing, The Hague, Netherlands, 8: 145-170.
4. Hassini, A., N. Benabadji, N. Hassini and A.H. Belbachir, 2006. Forest fires smoke detection from SeaWiFS sensor data: Case of Algerian coast. International, Conference on Information and Communication Technologies: From Theory to Applications, IEEE Proceedings, 1: 412-417. 5. Govaerts, Y. and M. Clerici, 2004. MSG-1/SEVIRI
Solar Channels Calibration Commissioning Activity Report, Doc. EUM/MSG/TEN/04/0024, Version 1.0, pp: 28-35.
6. Lutz, H.J., 2007. Radiometric Calibration of MSG SEVIRI level 1.5 Image Data in Equivalent Spectral Blackbody Radiance, EUM/OPS-MSG/TEN/03/0064, Version 1, pp: 4-8.
7. Hassini, A., N. Benabadji and A.H. Belbachir, 2007. Acquisition and processing of MSG level 1.5 images data. International Conference on Physics and its Applications, ICPA’07, Proceedings, pp: 145-150.
8. Hassini, A., N. Benabadji and A.H. Belbachir, 2005. Reception of the APT weather satellite images. AMSE J., Advances B, France, 48: 25-43. 9. Lutz, H.J., 1999. Cloud Processing for Meteosat
Second Generation, EUMETSAT Technical Memorandum, Version 4, pp: 1-8.
10. Lutz H.J., 2007. Cloud Detection for MSG-Algorithm Theoretical Basis Document (ATBD). EUMETSAT, EUM/MET/REP/07/0132, Version 1, pp: 20-27.
11. Weaver J.F. and J.F. Purdom, 1995. Observing forest fires with the GOES-8, 3.9 µm imaging
channel. Weather and Forecasting, 10: 803-808.
12. Giglio L., J.D. Kendall, C.O. Justice, 1999. Evaluation of global fire detection algorithms using simulated AVHRR infrared data. Int. J. of Remote Sensing, 20: 1947-1985.
13. Li, Z., Y.J. Kaufman, C. Ichoku, R. Fraser, A. Trishchenke, L. Giglio, J. Jin and X. Yu, 2001. A Review of AVHRR-Based Active Fire Detection Algorithms: Principles, Limitations and Recommendations, in Global and Regional Vegetation Fire Monitoring from Space: Planning a Coordinated International Effort, SPB Acadenic Publishing, The Hague, Netherlands, pp: 199-225. 14. Sifakis, N., D. Paronis and I. Keramitsoglou, 2004.
Combining AVHRR imagery with CORINE Land Cover data to observe forest fires and to assess their consequences. Int. J. Applied Earth Obser. Geoinform., 5: 263-274.
15. Giglio, L., J. Descloitres, C.O. Justice, Y.J. Kaufman, 2003. An enhanced contextual fire detection algorithm for modis. Remote Sensing Environ., 87: 273-282.
16. Morisette, J.T., L. Giglio, I. Csiszar, C.O. Justice, 2005. Validation of the MODIS active fire product over Southern Africa with ASTER data. Int. J. Remote Sensing, 26: 4239-4264.
17. Justice, C.O., L. Giglio, S. Korontzi, J. Owens, J.T. Morisette, D. Roy, J. Descloitres, S. Alleaume, F. Petitcolin and Y. Kaufman, 2002. The MODIS fire products. Remote Sensing Environ.,
83: 244-262.