Spike Correlations in a Songbird Agree
with a Simple Markov Population Model
Andrea P. Weber, Richard H. R. Hahnloser*Institute of Neuroinformatics UZH/ETH Zurich, Zurich, Switzerland
The relationships between neural activity at the single-cell and the population levels are of central importance for understanding neural codes. In many sensory systems, collective behaviors in large cell groups can be described by pairwise spike correlations. Here, we test whether in a highly specialized premotor system of songbirds, pairwise spike correlations themselves can be seen as a simple corollary of an underlying random process. We test hypotheses on connectivity and network dynamics in the motor pathway of zebra finches using a high-level population model that is independent of detailed single-neuron properties. We assume that neural population activity evolves along a finite set of states during singing, and that during sleep population activity randomly switches back and forth between song states and a single resting state. Individual spike trains are generated by associating with each of the population states a particular firing mode, such as bursting or tonic firing. With an overall modification of one or two simple control parameters, the Markov model is able to reproduce observed firing statistics and spike correlations in different neuron types and behavioral states. Our results suggest that song- and sleep-related firing patterns are identical on short time scales and result from random sampling of a unique underlying theme. The efficiency of our population model may apply also to other neural systems in which population hypotheses can be tested on recordings from small neuron groups.
Citation: Weber AP, Hahnloser RHR (2007) Spike correlations in a songbird agree with a simple Markov population model. PLoS Comput Biol 3(12): e249. doi:10.1371/journal. pcbi.0030249
Introduction
Spontaneous neural activity in the absence of sensory stimulation (e.g., during sleep) often exhibits stereotyped sequences that can resemble sensory or motor sequences [1– 5]. A central question pertaining to such observations is the extent to which spike sequences in single neurons reflect sequential behaviors across larger populations. Sometimes there is strong correspondence, and the spike patterns in single neurons can be precisely predicted from a coarse population readout [6]. However, it is largely unexplored whether population-conditional models of spike trains can go beyond single-neuron statistics and also explain pairwise spike correlations.
Pairwise spike correlations can signal important informa-tion beyond that of firing rates [7,8], and in some sensory systems no higher-order interactions seem to exist beyond that of cell pairs [9]. Spike correlations can be interpreted as evidence either of direct synaptic interactions or of common synaptic inputs. To illustrate the relationship between spike correlations and population models, let us consider neurons that display some regular subthreshold oscillations and occasionally fire a spike at the peaks of oscillation cycles. From single-unit data, we cannot infer the activity distribu-tion across the populadistribu-tion. However, given pairwise spiking data, we can estimate the number of population states from the conditional probability that a cell spikes given that a spike in another cell occurs (which is a measure of spike correlation). For example, if the conditional spike probability (CSP) averaged over cell pairs is one, then all cells must be linked to the same population state, and fire with unit probability when that state is visited. If, on the other hand, CSPs average to 0.2, then the cells can be distributed among at most five equiprobable states. For example, neurons could each be randomly linked to one of five states and fire with
unit probability when that state is visited; or they could all be linked to the same state and fire with probability 0.2 when that state is visited. Which of these cases applies depends on the spread of CSPs: in the one-state case, all CSPs would be narrowly distributed around 0.2, and in the five-state case, CSPs would be bimodally distributed around zero and one (and average to 0.2). The point of this hypothetical example is to illustrate that population-conditional models are con-strained by spike correlations, and therefore such models must be tested on experimental data.
In the robust nucleus of the arcopallium (RA) and the high vocal center (HVC) of zebra finches, neurons exhibit precise and stereotyped high-frequency bursts during singing. The number of bursts produced per song motif varies strongly between neuron types, from about one burst in RA-projecting HVC neurons (HVCRA neurons), to about 12
bursts in RA projection neurons, and up to more than 20 bursts in HVC interneurons (HVCI neurons) (Figure 1A)
[1,10,11]. In awake, non-singing birds, RA and HVC neurons do not burst and are either silent or in a mode of tonic firing
Editor:Karl J. Friston, University College London, United Kingdom
ReceivedSeptember 17, 2007;AcceptedOctober 31, 2007;PublishedDecember 21, 2007
A previous version of this article appeared as an Early Online Release on November 1, 2007 (doi: 10.1371/journal.pcbi.0030249.eor).
Copyright:Ó2007 Weber and Hahnloser. This is an open-access article distributed under the terms of the Creative Commons Attribution License, which permits unrestricted use, distribution, and reproduction in any medium, provided the original author and source are credited.
Abbreviations: CIF, conditional intensity function; CSP, conditional spike probability; HVC, high vocal center; IFR, instantaneous firing rate; ISI, interspike interval; NIf, nucleus interface of the nidopallium; pdf, probability density function; RA, robust nucleus of the arcopallium; Uva, thalamic nucleus uveaformis
[12,13]. And during sleep they display incessant switching between bursting and tonic firing modes; in RA neurons, the sleep-related burst patterns can be highly similar to song-related patterns [4], and often the patterns are time-locked to
bursts in simultaneously recorded RA-projecting HVC neurons (Figure 1Bi) [12].
Inspired by these data, we study a simple Markov model of neural populations that is based on a chain network of synaptic connections among HVCRAneurons [14,15]. Model
spike trains depend on the sequence of population states and are otherwise independent of each other. Formally, state– space models allow for the a priori estimation of the state dynamics from given spike data [16–19]. However, because here we assume knowledge of the state–space topology (i.e., a chain-like network among HVCRA neurons), we are faced
with the simpler problem of estimating the transition probabilities associated with the chain.
We explore to what fraction sleep-related bursts in HVC and RA constitute replay of premotor bursts. We compare our simulations to sets of song- and sleep-related spike data in different HVC and RA neuron types [1,10–12]. These datasets are affected by a nonnegligible variability, as exemplified by averages of sleep-related interspike interval (ISI) distributions in RA neurons (Figure 1Bii). This variability entails model parameters needing to be individually adjusted for each dataset. Our main finding is that the diversity of the data across sets and across behavioral states (waking, singing,
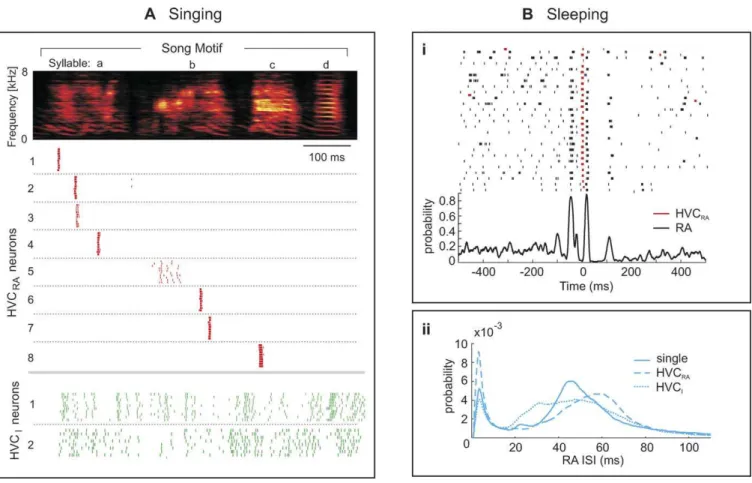
Figure 1.Song and Sleep-Related Firing in HVC and RA Neurons of Zebra Finches
(A) During the production of a song motif (sound spectrogram on top), RA-projecting HVC neurons (HVCRAneurons) produce at most one stereotyped spike burst (red rasters). HVC interneurons (HVCIneurons) produce dense and less-stereotyped spike patterns (green rasters). A more elaborate version of this figure was originally published in [1].
(B) Sleep-related firing in HVCRAand RA neurons. (i) Top: spike-raster plot of a simultaneously recorded HVCRA–RA pair during sleep. RA spikes (black rasters) have been time aligned to HVCRAbursts (red rasters). (i) Bottom: CSP function of the same neuron pair. Also known as the cross-intensity function, the CSP function is an estimate of the conditional RA spiking probability as a function of the time lag to HVCRAspikes (see Methods). (ii) ISI pdfs of RA neurons vary from one dataset to another. ISI pdfs have been averaged either over 29 RA neurons recorded in isolation (full line), or over 26 RA neurons recorded simultaneously with HVCRAneurons (dashed line), or over 50 RA neurons recorded simultaneously with HVCIneurons (dotted line). doi:10.1371/journal.pcbi.0030249.g001
Author Summary
and sleeping) can be essentially ascribed to two macroscopic transition probabilities; these set the likelihood that pop-ulation activity either evolves along the chain of motor states imprinted in the HVCRA network, or flips back and forth
between motor states and a single resting state. Our results strengthen the view that synaptic networks are organized to support well-defined and highly constrained population behaviors.
Results
Model
In our model, HVC population activity is a random variable that evolves in roughly 5 ms steps and is either in the ground state, or in one of 100 song states. The number of song states is chosen such that a total song-motif duration of 500 ms results [20]. Each of the song states corresponds to activation of a virtual group of 50–150 RA-projecting HVC neurons (referred to as HVCRA neuron groups, or simply HVCRA
groups). During singing, HVCRAgroups are activated
sequen-tially with probability p ¼ 1 (Figure 2A). When birds are awake, but not singing, HVC activity remains in the ground state (state 0) with probability q¼1. During sleep, HVCRA
groups are also sequentially activated, but with reduced
probability p , 1, and, the persistence probability in the ground state is also reduced to q , 1 (Figure 2B). By construction, neurons remain for exponentially distributed times in song and ground states during sleep, in agreement with recent estimates [17].
Given a sequence of states that describes HVC population activity, we generated spike trains in individual neurons by random sampling of model ISI probability density functions (pdfs). We assumed that HVCRAneurons are each randomly
linked to exactly one HVCRA group and fired a burst only
when that group was activated; otherwise they remained silent. HVCIand RA neurons were randomly linked to more
than one HVCRA group and fired several bursts per song
motif. For each neuron type, burst ISI pdfs were fixed and were simply derived from measurements (Figure 2C). Inter-estingly, in all neuron types, sleep-related bursts have lower firing rates than song-related bursts (see Figure S1). To accommodate this fact, model pdfs had to be slowed down during sleep (see Methods for details). Finally, when HVC activity was in the ground state, HVCRAneurons remained
silent, whereas RA and HVCIneurons generated ISIs sampled
from gamma functions (Figure 2D). Because waking-related RA and HVCIfiring rates are very diverse [12], the means of Figure 2.Markov Model of HVC Activity during Behavior and Sleep
(A) When birds are awake, but not singing, HVC activity persists in a ground state (state 0) with probabilityq¼1. When birds sing, groups of HVCRA neurons (numbered circles) are sequentially activated with probabilityp¼1 (the dashed arrows indicate song onset and offset). A single HVCRAneuron (red square) is linked with exactly one HVCRAgroup, and single RA and HVCIneurons (blue and green squares) are linked with random subsets ofLRand LIgroups, respectively.
(B) During sleep, HVCRAgroups are sequentially activated with probabilityp,1; with probability 1p, HVC activity transits into the ground state. There, it persists with probabilityq,1; with probability 1q, it transits back into a song state.
(C) Bursts in different neuron types are modeled by the first few milliseconds of averaged song-related ISI pdfspb (s). (D) Tonic firing in RA and HVCIneurons is modeled by gamma functionspa
(s) (black curves). The diversity of waking-related ISI pdfs in these neurons is illustrated by the blue and green curves, each representing a different neuron.
doi:10.1371/journal.pcbi.0030249.g002
gamma functions were kept as free parameters together with
pand q. Descriptions and derivations of model parameters are summarized in Table 1.
Fits to Song-Related and Sleep-Related Data
We found that song-related ISI pdfs beyond the burst scale could be well fit over the entire ISI range (up to 100 ms) by randomly linking RA neurons toLR¼12 HVCRAgroups and
HVCIneurons toLI¼35 groups (Figure 3A and 3B). Note that
the larger the link counts LR and LI, the steeper were the
corresponding exponential tails of the pdfs. However, to also account for the considerable lack of stereotypy mainly in raster plots of HVCIneurons [11], we had to trade off high
link counts against reduced burst probabilities (the proba-bility that a neuron bursts when an HVCRAgroup to which it
is linked is activated). Note that a less than unit burst probability can be interpreted as a reduction in neural responsiveness to excitatory synaptic drive, or as increased inhibition. We obtained good results with burst probabilities in RA neurons ofpR¼0.92 (LR¼13) and in HVCIneuronspI¼
0.63 (LI ¼ 50) (Figure 3C and 3D). Note that first-order
statistics impose the following constraints on the average number of RA and HVCIbursts per song motif: pRLRffi 12
andpILIffi35.
Sleep-related ISI pdfs of RA neurons could be well-fit given a suitable tonic-firing model and suitable persistence prob-abilitiespand q(Figure 4A and 4B). The peak at small ISIs resulted from spikes produced in song states, and the peak at large ISIs from spikes produced in the ground state. Raster plots of simulated RA-neuron activity aligned to HVCRA
bursts looked very realistic (compare Figure 4C and 4D to Figure 1Bi). Autocovariance functions of sleep-related RA spike trains could also be well-fit (see Figure S2).
The parameterspandqcharacterized what we shall refer to as the depth and the coherence of the sleep. By denoting the average number of time steps spent in song states byhnsi ¼p/ (1p) and similarlyhnai ¼p/ (1q) for the ground state (these numbers are known as the survival times in the language of point processes), we defined the sleep depthdby their ratio hnsi/ hnai(experimentally,d could be estimated from burst-rate measurements as d¼ b / (b0 b), where b0 and b are measured burst rates during song and during sleep,
respec-tively). Small ISIs prevailed during deep sleep (Figure 4B,hnsi/ hnai ¼12%) and large ISIs during light sleep (Figure 4A,hnsi/ hnai ¼ 3.6%). The coherence of sleep was defined by the product hnsihnai ¼12%. Model ISI pdfs showed almost no dependence on sleep coherence. For example, by doubling both p and q, sleep-related ISI pdfs in Figure 4A and 4B remained essentially unchanged. However, the sleep coher-ence had a strong influcoher-ence on raster plots: the larger the sleep coherence, the longer was the time interval relative to HVCRAbursts over which stereotyped RA bursting could be
observed (Figure 4C and 4D; note that sleep depths were very similar in Figure 4C and 4D: 19% versus 14%).
RA and HVCIneurons frequently display 1–2 s epochs of
increased burst density during sleep ([12]; Figure 5A, top). From a recent experimental study, we know that these burst epochs are shaped by input from the thalamic nucleus uveaformis (Uva): decreased tonic firing in HVC-projecting Uva neurons leads to increased bursting in HVC and RA neurons, whereas increased tonic firing in HVC-projecting Uva neurons suppresses HVC and RA burst rates (unpub-lished data). Here, we modeled this Uva-mediated control of burst epochs by random fluctuations of the parameterp(we transiently set p¼1 to model a burst epoch; see Methods) (Figure 5A, middle and bottom). By modifyingprather than any other parameter, we satisfied the experimental finding that burst shapes (burst-related ISI distributions) are un-changed during burst epochs. By virtue of burst epochs, raster plots of simulated HVCRA–HVCI pairs were very
realistic and displayed characteristic horizontal bands of long, uninterrupted bursting, coexisting with brief bands of very few bursts (Figure 5B). Without fluctuations inp, HVCI
burst patterns would mostly be either narrow or wide, but not both.
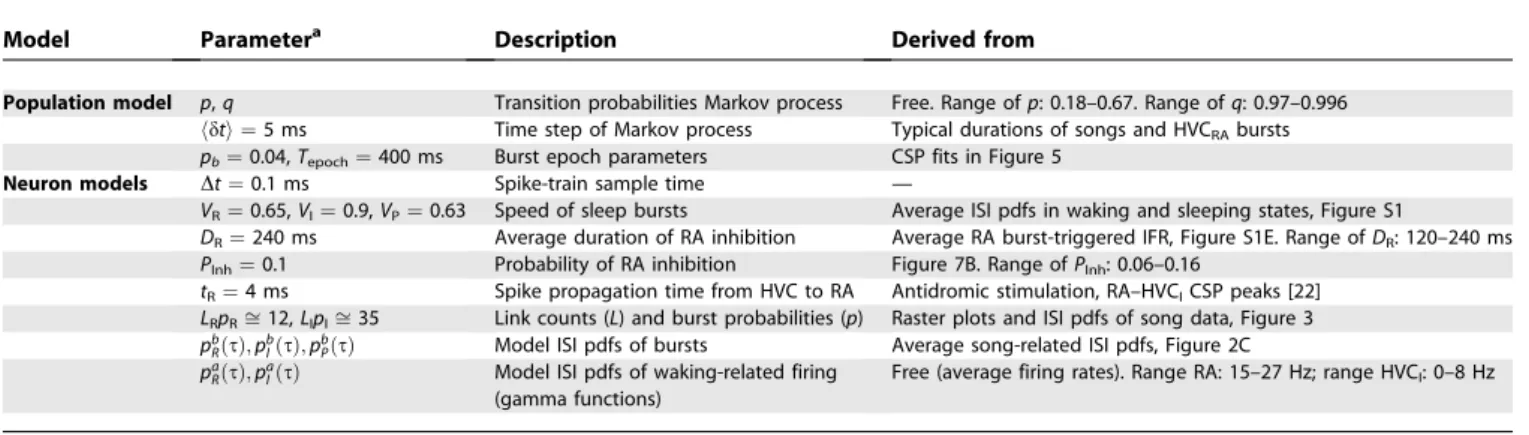
One of the touchstones of our model is whether it can reproduce pairwise correlations in sleep-related spike trains on large time scales (two orders of magnitude beyond the burst scale). We modeled CSP functions by averaging over 50 simulated cell pairs with randomly drawn link sets. It was a simple matter to produce excellent fits of CSP functions in RA–RA and RA–HVCIpairs (Figure 5C and 5D). The effect of pwas to set the width of CSP functions, whereasqand average RA and HVCIfiring rates set the baseline and peak values. Table 1.Model Parameters and Their Derivation
Model Parametera Description Derived from
Population model p,q Transition probabilities Markov process Free. Range ofp: 0.18–0.67. Range ofq: 0.97–0.996
hdti ¼5 ms Time step of Markov process Typical durations of songs and HVCRAbursts pb¼0.04,Tepoch¼400 ms Burst epoch parameters CSP fits in Figure 5
Neuron models Dt¼0.1 ms Spike-train sample time —
VR¼0.65,VI¼0.9,VP¼0.63 Speed of sleep bursts Average ISI pdfs in waking and sleeping states, Figure S1
DR¼240 ms Average duration of RA inhibition Average RA burst-triggered IFR, Figure S1E. Range ofDR: 120–240 ms PInh¼0.1 Probability of RA inhibition Figure 7B. Range ofPInh: 0.06–0.16
tR¼4 ms Spike propagation time from HVC to RA Antidromic stimulation, RA–HVCICSP peaks [22] LRpRffi12,LIpIffi35 Link counts (L) and burst probabilities (p) Raster plots and ISI pdfs of song data, Figure 3 pb
RðsÞ;pbIðsÞ;pbPðsÞ Model ISI pdfs of bursts Average song-related ISI pdfs, Figure 2C pa
RðsÞ;paIðsÞ Model ISI pdfs of waking-related firing (gamma functions)
Free (average firing rates). Range RA: 15–27 Hz; range HVCI: 0–8 Hz
Ranges specified are not representative of overall single-neuron ranges, but represent the ranges used in simulations to fit selected single-neuron data and population averages. aP indicates HVCRA; I, HVCI; and R, RA.
However, CSP function in HVCRA–HVCI pairs and HVCI–
HVCIpairs turned out to be more problematic because it was
impossible to reproduce the high CSP peaks near zero time lag. For HVCRA–HVCIpairs, there was a simple explanation
for this shortcoming: when we simulated only as many model pairs as were available in the experimental dataset (26 instead of 50), then the high CSP peak could be occasionally reproduced due to random link sampling (Figure 5E). Thus, from a bootstrapping point of view, the small difference between model and real CSP functions in HVCRA–HVCIpairs
was not statistically significant. In contrast, the peak CSP in HVCI–HVCI pairs was significantly higher than its model
counterpart: even when sleep activity was restricted to song states only (p¼1), the high peak CSP in HVCI–HVCI pairs
could not be reproduced. A good fit was only possible with substantially higher HVCIburst probability,pI¼0.95. Thus,
we were faced with the paradoxical conclusion that HVCI
neurons burst more reliably during sleep than during singing (this conclusion is paradoxical, because with our estimate of HVCRAburst probabilitypP¼1 during singing andpP¼0.8
during sleep, the presumed HVCRA drive is smaller during
sleep, and sopIshould be smaller as well). We could imagine
two reasons why the CSP peaks of HVCIpairs might be so
high during sleep. First, during sleep, HVCIneurons could be
selectively driven by X-projecting HVC (HVCX) neurons or by
neurons in the nucleus interface of the nidopallium (NIf) that project to HVC (NIfHVCneurons), in addition to their weaker
drive from HVCRAneurons. This explanation by itself seems
somewhat implausible, because it would require that HVCRA
neurons not be driven (or only very weakly driven) by HVCX
or NIfHVCneurons, which appears not to be the case [21–23]).
Therefore, we favored a second explanation, which is that our assumption of random and uniform links in HVCIneurons
must be wrong. In other words, there must be a special subset of HVCRA groups to which HVCI neurons are linked with
higher probability. In fact, such an explanation agrees with song-related data, according to which HVCI population
activity is weakly correlated with sound amplitude and therefore not uniformly distributed over the time course of a song motif [11]. Indeed, when we relaxed the assumption Figure 3.Song-Related ISI pdfs of RA and HVCINeurons
(A,B) Model-based fits of averaged ISI pdfs in RA and HVCIneurons during singing. The arrows delimit the ISI range of the burst models in Figure 2C, i.e., 6 ms and 10 ms, respectively. The RA-neuron data (A) were taken from [10], and the HVCIdata (B) were provided courtesy of A. Kozhevnikov.LR¼12, andLI¼35.
(C,D) Raster plots of song-related spike trains in four RA and four HVCImodel neurons for two different values of link countsLR/Iand burst probabilities pR/I. Spikes are represented as tick marks and drawn in alternating colors for different neurons.
doi:10.1371/journal.pcbi.0030249.g003
that HVCI neurons can be linked to any one of the 100
HVCRAgroups, but to only 56 randomly selected groups, we
obtained a good fit to the CSP peak with standard HVCI
parameterspI¼0.63 (LI¼50) (Figure 5F).
Note that a requirement for the excellent CSP fits was the inclusion of burst epochs. Without burst epochs, the long tails of CSP functions could not be well fit (see Figure S3). Note also that the asymmetry in the average RA–HVCI CSP
function in Figure 5D was largely due to RA inhibition that decreases tonic firing after bursts and due to differences between RA and HVCItonic firing rates.
One of our model assumptions is that any HVCRAgroup
can be activated from within the ground state. We were unable to stringently test this assumption: All of our results remained unchanged when singing-like activity could be initialized in only a random subset of ten or more song states. However, when this number was much smaller (two to four states), unrealistic peaks in correlation functions appeared, thereby setting a lower bound for the number of possible initial HVCRAgroups.
Tests of HVC Ultrasparseness and Sequential Dynamics during Sleep
We tested the validity of our assumptions of ultrasparse-ness and sequential dynamics of HVCRAactivity. Given that
during sleep HVCRAbursts are time-locked to burst patterns
in RA neurons (Figure 1Bi), we decided to use this locking to test whether individual HVCRAneurons are linked to a single
or, potentially, to several HVCRAgroups, and whether during
sleep, HVCRAgroups are activated sequentially or in more
random order.
We determined the experimental CSP distribution of all HVCRA–RA pairs in the time interval [60, 60] ms of HVCRA
spikes (Figure 6). With the exception of extreme (very small and very large) CSPs, the distribution was well-approximated by an exponential curve. The excessive occurrence of extreme CSPs did not happen by chance: the number of CSPs in the bin [0.99, 1] was significantly larger than the number of CSPs in equally sized adjacent bins (p , 0.01, binomial test). The same held true for the number of CSPs in the bin [0, 0.01], which was significantly larger than in adjacent bins. This CSP behavior illustrates that on the population level, RA activity tends to be highly locked to HVCRAbursts within at least660 ms.
We compared the experimental CSP distributions with model distributions for 50 simulated HVCRA–RA pairs under
various model assumptions. For the model in Figure 2, very small and very large CSPs appeared frequently (red curve in Figure 6), in good agreement with the data. Almost no parameter tuning was necessary to achieve a good fit. The heights of extreme CSP peaks were positively correlated with
q. When q was small, the likelihood of repeated switching between ground and song states within 60 ms was large, thereby decorrelating spike trains and forcing extreme CSP values to appear less frequently. CSPs in the intermediate range 0.5–0.95 were positively correlated withp, because with longer RA burst sequences, intermediate CSP values occurred Figure 4.Modeling Sleep-Related Activity (p,q,1)
(A) An RA neuron producing few burst ISIs. A good fit is produced when the survival time of the ground state is long, compared to that of song states (light sleep,qmuch closer to 1 thanp).DR¼80 ms, andVR¼0.7.
(B) A different RA neuron producing many burst ISIs. A good fit was produced by a relatively long survival time of sleep states (deep sleep).DR¼120 ms, andVR¼0.67.
(C,D) Spike raster plots of HVCRAand RA neurons. All HVCRAbursts (red rasters) are aligned at the center of the plots. Corresponding RA spikes (black rasters) are shown below each HVCRAburst. Whenpis large (strongly coherent sleep) (C), stereotyped RA bursting is observed over larger intervals than whenpis small (D).
more often. For a peak at unit CSP to appear, the RA burst probabilitypRhad to be close to one: by decreasingpRfrom
one to 0.8, the peak at unit CSP completely disappeared. Thus, to agree with the data, RA neurons must have a very high burst probability, which is suggestive of a strong drive from HVC.
We then assumed that HVCRA neurons do not burst by
linkage with a single HVCRA group, but that 80% of their
bursts are locked to a first HVCRAgroup, and 20% of bursts
are locked to a second group (in the simulations, the two groups were randomly chosen for each simulated HVCRA
neuron). We expected these double linkages to create a washout effect in which clear RA burst pattern would no longer be seen. Indeed, by remapping just 20% of HVCRA
bursts in this manner, very high and very low CSPs appeared less frequently (green curve in Figure 6), in disagreement with the data. This phenomenon was very robust because increas-ingpup to 99/100 andqup to 999/1000 was insufficient to reproduce the high peak at unit CSP. Thus, ultrasparseness of HVCRA linkage is necessary to explain the abundance of
extreme CSPs.
We also estimated the degree to which HVCRAgroups are
activated in sequence as opposed to random (nonsequential) activation. In principle, our sleep model in Figure 2B allows for almost arbitrary state transitions by means of a brief intermission via the ground state. However, reasonable values for p and q imply that nonsequential HVCRA-group
activation is rare and that such events have little impact on Figure 5.Burst Epochs and Pairwise Correlations
(A) Instantaneous firing rates of a recorded HVCIneuron (top), a simulated HVCIneuron without burst epochs (middle), and a simulated HVCIneuron with burst epochs (bottom). Burst epochs are indicated by arrows.
(B) A sample raster plot of a simultaneously recorded HVCRA–HVCIpair (top) and a comparable plot from model simulations (bottom). The inclusion of burst epochs gives rise to rows with very sparse HVCIbursting (top arrow) and rows with dense HVCIbursting (bottom arrow), as is seen in real data. (C–F) Average CSP functions in different neuron types. The functions are plotted in reference to a spike in the first pair, i.e., with respect to RA spikes in (D) and with respect to HVCRAspikes in (E).
(C) RA–RA neuron pairs (fromn¼29 recorded pairs).p¼6/7, andq¼39/40.
(D) RA–HVCIpairs (n¼50 pairs). The arrow indicates an asymmetry that is reproduced by the model.p¼9/11, andq¼49/50. (E) HVCRA–HVCI(n¼26).p¼7/8, andq¼59/60.
(F) HVCI–HVCIpairs (n¼19). HVCIneurons randomly link to 56 of the 100 HVCRAgroups.p¼7/8, andq¼32/33. In (C–F)LI¼50,pI¼0.63,DR¼240 ms,pR¼0.92, andLR¼13.
doi:10.1371/journal.pcbi.0030249.g005
the observed CSP distribution. To test our model assumption that fixed and sequential state transitions underlie sleep-related activity patterns, we performed simulations in which 20% of transitions between song states were nonsequential but completely random. We found that introducing such randomness into the model resulted in an altered CSP distribution in which zero CSPs appeared very infrequently, in stark disagreement with the data (blue curve in Figure 6). The reason for this lack was that with increasing time lag to HVCRA spikes, stray RA bursts started to appear due to
random transitions, leading to non-zero CSPs. This phenom-enon was very robust as it was not possible to remedy the scarcity of zero CSPs by changingpandq.Note that the peak at unit CSP was unchanged by the introduction of random transitions, presumably because unit CSPs arose only at very small time lags away from HVCRAspikes and thus were not
significantly affected by the random transitions. In con-clusion, the inclusion of few nonsequential transitions leads to severe decorrelation of RA spikes a few tens of milli-seconds away from HVCRA spikes and to shortage of very
small CSPs; therefore, nonsequential transitions of HVC activity must be very rare during sleep. Note that by the same argument, we could also exclude the possibility that two or more HVC-activation sequences can coexist at the same time. If this were the case, then extreme CSPs would be rare, even more so than by relaxing sequential order or ultra-sparseness.
Tests of RA Intrinsic Dynamics and Inhibition
In our model, RA neurons are simply driven by HVCRA
bursts. To test for the possibility that RA burst sequences
can be self-sustaining due to recurrent RA circuitry and in the absence of HVC drive, we performed model simulations in which after each transition into the ground state, RA burst sequences continued to propagate for a random duration uniformly distributed in the time interval 0–15 ms. By doing this, RA neurons produced less than 4% additional burst spikes compared to before. Despite this small addition of spikes, average CSP functions of RA–HVCI
pairs became unrealistically heavy at negative time lags, Figure 7A. This behavior was very robust, though it obviously depended on the estimated HVCRA spike
prop-agation timetR¼4 ms; see Methods and [24]. To assess the
relevance of RA intrinsic dynamics in a manner independ-ent of spike-propagation estimates, we removed single spikes in RA neurons (these are spikes forming ISI pairs of more than 10 ms each). Thus-formed RA–HVCI CSP
functions (with single RA spikes removed) displayed a high peak that in fact could not be reproduced with any set of model parameters pandqunless RA links were correlated with HVCIlinks (good agreement could be achieved when
RA neurons were linked to 13 among the 56 HVCRAgroups
to which HVCI neurons were linked). Thus, rather than
finding evidence for RA intrinsic dynamics, we found the contrary evidence that in order to explain the non-lagging and strong RA–HVCI correlations, RA neurons must be
preferentially linked to and driven by the same HVCRA
groups as are HVCIneurons.
We were also able to test a more subtle prediction of our model, such as the impact of RA-intrinsic inhibition. The key experimental observation is that right after sleep bursts, RA neurons do not immediately reenter the tonic firing mode, but that tonic firing recovers after an estimated recovery time of DR ¼ 240 ms (Figure S1E). We modeled this transient
suppression of tonic firing by RA inhibition. This inhibition had average duration DR and was randomly elicited with
independent probabilityPInhper activated HVCRAgroup (see
Methods). A good fit was achieved usingPInh¼0.1. Due to the
nonspecificity of this inhibition, tonic RA firing was sup-pressed also when the recorded RA neuron did not burst, but some other RA neuron did. The situation was different when we modeled the reduced tonic firing by a soft refractory period with average durationDR¼240 ms, in which case tonic
RA firing was suppressed only after bursts. To distinguish between these two models, we inspected paired RA–neuron recordings for periods when one neuron burst, but the other did not. We then plotted the average instantaneous firing rate (IFR) of the nonbursting neurons, time-aligned to burst onsets. We found that in synchrony with the bursts, there was a brief dip in the IFR. The inhibition model was able to reproduce this phenomenon, but the adaptation model was not, Figure 7B. These findings demonstrate that tonic RA firing during sleep is suppressed by intrinsic inhibition and not by firing adaptation alone.
Discussion
We have translated a popular diagram of songbird premotor dynamics into a simple state-space model of neuron populations. To produce good fits of spike correla-tions measured during sleep, we had to make use of a nonnegligible range of parameter values. We justified this requirement by intrinsic variability of the data that on the Figure 6.HVC States Evolve Sequentially and Are Formed by Distinct
HVCRAGroups
Distribution of CSPs in (n¼46) HVCRA–RA pairs in the interval60 to 60 ms of HVCRAspikes (black histogram). With the exception of two peaks at CSPs zero and one (black arrows), the distribution is well-approximated by an exponential curve (purple line). Shown are the average CSP functions of 50 simulated HVCRA–RA pairs for three different model assumptions: (1) HVCRAneurons fire with probabilitypP¼0.8 in a single HVCRA group (red curve); (2) HVCRA neurons fire in two (randomly selected) HVCRAgroups with probabilities 0.64 and 0.16 (green curve); and (3) activation of HVCRA groups is sequential in 80% of song-like transitions and in 20% it is random (blue curve). The green and blue arrows indicate inadequacies of model assumptions 2 and 3.p¼6/7,q¼
one hand is due to nonstationarities of sleep modeled byp
andq, and on the other hand is due to individual differences in tonic firing rates. The parameters p and q interpolate between firing characteristics associated with two different behavioral states, i.e., waking and singing. We can at this point only speculate about their biophysical interpretations.
The persistence probability p of song states could be a neuromodulatory mechanism that affects vesicle release probability in HVCRA neurons, or their excitability. Such a
scenario seems plausible if sequential activation of HVCRA
groups derives from excitatory synaptic connections between HVCRA neurons. Current evidence indicates that HVC and
RA burst epochs are shaped by a thalamic nucleus. Accord-ingly, the persistence probability p must depend on such extrinsic influences as well. We are more uncertain about the persistence probabilityqof the ground state. Songs of birds are initiated somewhere in the brain with the result of activating a particular HVCRAgroup. During sleep,
initializ-ing signals appear to originate in the NIf that projects to HVC [23]. The parameter q could thus represent vesicle release probability in synapses of HVC-projecting NIf neurons or of synapses (or excitability) within NIf.
An inherent assumption in our model is conditional independence of spike trains given a sequence of population states. This is a strong assumption, as it ignores the fact that cells spike more reliably when their afferents spike more reliably as well. As a consequence, we found that the model tended to underestimate some measured correlations (Figure 5F), yet the differences could be explained by assuming nonhomogeneity of link distributions. Possibly, by doing so, we have overestimated the tendency by which neurons link to preferred HVCRA groups; part of the high CSPs could be
attributable to genuine pairwise interactions. To be able to estimate these interactions in future work, it will be necessary to simultaneously record from larger neuron populations. Our prediction would be that higher-order spike correlations must obey the regularities imposed by population-condi-tional spike-generation mechanisms. If this prediction turns out to be wrong and spike triplets appear more often than predicted, then we might have to revise our model by incorporating mutual dependencies of burst probabilities, which in essence corresponds to introducing higher-order spike correlations.
We were unable to characterize the HVCRA groups to
which HVCI and RA neurons are linked with higher
probability, but we speculate that preference applies to HVCRAgroups that represent syllable onsets, in agreement
with weak predictive correlations between song patterns and activity in HVCIand RA neurons [10,11]. These distinguished
HVCRAgroups could also be leaders that are preferentially
activated in transition from the ground state. Such a scenario seems plausible given that syllable onsets are flexible song elements optimally aligned with global song tempo [25]. Insights into these questions could emerge from applications of our modeling approach to a set of HVC and NIf recordings [23]: because NIf projection neurons tend to burst in time intervals of 100 ms and more, their correlations with HVC neurons might provide evidence of regular spacing between leading HVCRAgroups.
One of the benefits of our modeling approach compared to other approaches is increased simulation efficiency, because the time it takes to generate a model spike train is orders of magnitude shorter than for detailed biophysical models such as conductance-based integrate-and-fire neurons. Thanks to this efficiency, we were able to compare simulated data with real data to great detail, a task that usually becomes exhaustive in simulations of membrane biophysics. We have not hand-picked neurons for model comparison, but tested model predictions on data from all recorded cells and in all relevant behavioral states. Despite the many simplifications of our model, we believe it can be converted into the language of membrane voltages and synaptic potentials. For example, we have implicitly assumed that neurons are intrinsic bursters. It is known that intrinsic bursting can stabilize the Figure 7.RA-Intrinsic Dynamics and Inhibition
(A) When RA burst sequences extend beyond HVCI sequences by a random time uniformly distributed in the interval 0–15 ms, then the left flank of the average RA–HVCICSP function gets uncharacteristically wide (arrows).
(B) Transitive suppression of tonic firing in RA neurons is explained by RA inhibition. Shown are average RA IFR curves in 1.2 s time windows in which one RA neuron does not fire a burst, and time-aligned to burst onset in a simultaneously recorded RA neuron. Conjunctively with the bursts, there is a transient reduction in firing rate of the nonbursting neuron (black curve,n¼50 RA neuron pairs). The model in which RA inhibition suppresses spontaneous firing (red curve) is able to reproduce this transient reduction, but the model in which RA neurons display a soft refractory period after bursts (blue curve) is not.p¼6/7,q¼39/40,LR
¼12,pR¼1,DR¼240 ms, andpb¼0. doi:10.1371/journal.pcbi.0030249.g007
propagation of synchronized activity in conductance-based model neurons [14]. One of the main difficulties would then be to find the appropriate conductance values that imple-ment our estimates of burst probabilities and burst durations. In contrast, comparatively little effort would have to be made to compose synaptic weight matrices, as these are specified by our estimates of link statistics.
It might also be interesting to apply our approach to other neural systems. For example, in the insect olfactory system, odor processing is associated with stereotyped neural sequences in the antennal lobe [26]. Although the diversity of these sequences is thought to have the function of maximizing odor discriminability in downstream areas, it is currently not clear whether odor-evoked sequences are assembled from discrete states and constrained by a small number of state transitions, or whether an almost infinite number of possibilities applies [27]. Our approach would be ideally suited to explore such hypotheses.
Our findings suggest that all sleep-related bursts are in fact replay of song-evoked bursts, as each model sleep burst is clearly associated with one of 100 song-related activity states. Such similarity seems not surprising given that song- and sleep-related activity is generated by the same synaptic circuits. However, what could be the function of such randomized replay? We do not know the answer, but generative probabilistic models as ours have the advantage that they are closely related to some machine learning algorithms [28]. With the growing notion that activity replay during sleep may be involved in memory consolidation and learning processes [29,30], our model provides a sound basis for the quantitative testing of such ideas.
Methods
Markov population model of HVC activity.We model the activity state of HVC at timetas a random variableStthat can be in any one of 101 states, where state 0 is termed the ground state and states 1– 100 are termed song states (Figure 2). When at timetthe random variable is in theithsong state (St¼i.0), we say that theithgroup of HVCRAneurons (orithHVCRA group) is activated. Accordingly, at
timetþdt, the (iþ1)thgroup is activated with probabilityp(a free model parameter): PðStþdt¼iþ1jSt¼iÞ ¼p; alternatively, with probability 1 p, HVC activity transits into the ground state: PðStþdt¼0jSt¼iÞ ¼1p: The space of song states has a ring structure such that when the 100th state is reached, HVC activity transits into state 1 with probabilityp.When at timet, HVC activity is in the ground state, it stays there at timetþdtwith probability q (another free model parameter):PðStþdt¼0jSt¼0Þ ¼q;alternatively, with probability 1q, HVC activity transits into any one of the song states,PðStþdt¼i.0jSt¼0Þ ¼ ð1qÞ=100:
The time steps dtin which HVC dynamics evolve is a random variable that depends on the HVCRAgroup that is active at that time:
dt¼ ðnimtÞdS;i. Here,nisets the fixed maximum time-step duration of theith group (a Gaussian random number with a mean of 9 ms and standard deviation of 1.8 ms),miintroduces temporal fluctua-tions (a Gaussian random variable with a mean 4 ms and standard deviation 0.4 ms), anddSt;iis the Kronecker delta (dSt;i¼1 ifSt¼i, and 0 otherwise). The reason for this doubly random choice of time steps is to avoid any periodicity which would lead to uncharacteristic ultranarrow peaks in correlation functions. For the ground state, time steps are not randomized, but simply set to the average duration of song states, i.e., 5 ms. The large-time behavior of the model output was independent of detailed time-step assumptions.
Model spike trains. Given a sequencefStg0,t,Tof HVC activity states, we generate spike trains in a small set of HVCRA, HVCI, and RA
neurons in the following manner. First, we randomly link each of the neurons to a distinct subset of HVCRAgroups, where the subset size
(the link count) ranges fromLI¼35 to 50 for HVCIneurons, fromLR ¼12 to 13 for RA neurons, and is set to 1 for HVCRAneurons. In the
time interval [t, tþ dt], neuron X is (1) in the burst mode with probabilitypX, ifSi¼i.0 and if neuron X is linked to theithHVCRA
group, or (2) in thetonic (firing)mode otherwise (X¼P for HVCRA
neurons, X¼R for RA neurons, and X¼I for HVCIneurons).
For HVCRAneurons, we chosepP¼1 during singing andpP¼0.8
during sleep [1], though none of the results depended on the actual value ofpP(due to our conditional assessment of spike correlations).
Spikes associated with the two firing modes are generated by time rescaling of a Poisson process [20] usingconditional intensity functions (CIFs). The CIFh(s) (also known as the stochastic intensity function) is the instantaneous spiking probability as a function of the time lags
since the last spike. Mathematically, the CIF is defined by the conditional probabilityh(s)¼P(one spike in [tþs,tþsþDt]j last spike at t), where Dt ¼0.1 ms is the smallest time unit in our simulations. CIFs can be derived from ISI pdfsp(s) according to [20]:
hðsÞ ¼ pðsÞ
1X
s
k¼0 pðkÞ
: ð1Þ
The CIFs associated with burst modes are denoted byhb
(s) (b, as in burst) and are identical for all neurons of a given type; they are derived from averages of measured ISI pdfs (Figure 2C). During sleep, firing rates of burst spikes are typically lower than during singing (see Figure S1 for a comparison), suggesting a weakened synaptic drive during sleep. To account for this fact, when modeling sleep behavior (p,1 andq ,1), we sample burst CIFs hb
(s) at a reduced speed defined byhb
(Vs), whereVP¼0.63 for HVCRAneurons,VR¼0.65 for
RA neurons, andVI¼0.9 for HVCIneurons. The CIFs associated with
tonic firing modes in HVCIand RA neurons are denoted byha(s) (a, as
in awake) and are modeled by gamma functions (Figure 2D). To model spike propagation times from HVC to RA [1,24], we add a fixed delay of 4 ms to all RA spikes. By construction, spike trains restricted to time intervals [t, tþdt] have renewal statistics, but because of frequent state switching of the HVC population, renewal statistics does not apply to large time intervals. All our simulations are performed with a unit time step ofDt¼0.1 ms. For each simulated neuron, we generate spike trains between 2 min and 30 min duration. The following additional assumptions about switching behavior produce good results: when a neuron switches from the tonic mode into the burst mode, we automatically set the first spike of the burst. However, if a neuron remains for two or more consecutive time steps in the burst mode, then we continue to sample the CIF without setting a spike at subsequent time steps (we set a spike only after a state switch).
To model reduced tonic firing in RA neurons after spike bursts (Figure S1E), we incorporate an RA inhibitory mechanism into the model. We assume that in each song state, there is an (independent) probability PInh¼0.1 that a neuron experiences inhibitory input
from RA interneurons [31]. Such inhibitory input lasts for a duration D, whereDis randomly drawn from an exponential distribution with meanDR. As long as an RA neuron receives inhibitory input, it does
not produce tonic spikes (in contrast, RA neurons are allowed to fire burst spikes while subjected to inhibitory input). To test the validity of this inhibition model, we compare it to a different model in which tonic firing is reduced after bursts by means of burst-triggered spike-rate adaptation. That is, when an RA neuron switches into the tonic firing mode, no spike is fired until a random time delay Dpasses since the onset of the last burst, whereDis again randomly drawn from an exponential distribution with mean DR. Both models are
able to explain burst-triggered firing adaptation in single RA neurons (Figure S1E); however, only the inhibition model is able to correctly reproduce transitive firing suppression in RA pairs (Figure 7).
Bursting in RA and HVC neurons is under tight control of input from Uva (unpublished observation). We implement Uva-mediated burst epochs as a Poisson point process: in regular time intervals of
Tepoch¼400 ms and with probability pb ¼0.04, we increase the
persistence of song states top¼1 for a duration ofTepoch. No
fine-tuning of burst epoch parameters Tepoch and pb was necessary to produce good fits in Figure 5C–5F.
Curves in Figures 2 to 5 were fit by manual parameter selection using a graphical user interface written in MATLAB (The Mathworks) and Cþþ. The parameter values that were explored to produce fits in Figures 4 and 5 werep,q, and the average tonic firing rates in RA and HVCI neurons (fixed for each neuron type). No objective fitting
Spike-train analysis. All spike-train analysis is performed using Matlab scripts mixed with fast Cþþroutines. Methods are described in detail in [12] and [24].
The IFRR(t) is defined as the inverse of the ISI enclosing timet. The ISI pdfp(s) (sis the ISI) is defined as the histogram of ISIs normalized to sum to one.
We estimate CSP functionsPBjA(t) for simultaneously recorded or
simulated neuron pairs A and B in terms of the fraction of spikes in neuron A that are associated with at least one spike in neuron B in the relative time window [t½s,tþ½s]:
PBjAðtÞ ¼ 1 NA
XNA
i¼1
h s
2minjjt A
i þtt
B
jj
;
whereNAis the total number of spikes in neuron A,ftAigare the spike
times of neuron A, ftBjg are the spike times of neuron B,
hðxÞ ¼ 1 2þ
1
2signðxÞis the Heavyside function, ands¼5 ms is the halfwidth of the spike clipping window. For more information on CSP functions, consult [24].
Supporting Information
Figure S1.Comparison of Song-Related and Sleep-Related Average ISI pdfs
(A–D) Shown are ISI pdfs (normalized to the first 10 ms) measured during singing and during sleep. In all neuron types, sleep-related bursts have lower firing rates, indicated by the rightward shift of ISI peaks. Matching of singing-related and sleep-related ISI pdfs can be achieved by different stretch factorsV(see Methods).V¼0.65 for RA neurons in (A),V¼0.9 for HVCIneurons in (B),V¼0.63 for HVCRA
neurons in (C), andV¼0.77 for X-projecting HVC neurons (HVCX
neurons) in (D). ISI pdfs were produced based on data in [1,10–12]. (E) RA spike histogram for a range of time lags since the last sleep burst, computed for all RA bursts that were followed by a burst-free period of at least 2 s (the histogram is composed of RA single spikes only). The red curve depicts the fit 1.91.3exp(t/DR), wheretis the
time lag since the last burst, andDR¼240 ms is our estimation of the
RA inhibition time constant.
Found at doi:10.1371/journal.pcbi.0030249.sg001 (94 KB PDF).
Figure S2.Autocovariance Functions of RA Spike Trains during Sleep The autocovariance functionC(t) of a spike trainq(t) (modeled as a sum of delta functions) is a measure of spike density fluctuation and is defined as
CðtÞ ¼ 1 T jtj
ZT
0
qðtþsÞqðsÞdsq2;
whereqis the average firing rate andTis the total duration of the spike train. The characteristic oscillatory behavior of autocovariance functions in RA neurons is well-reproduced by the model.
(A) A short survival time of the ground state leads to fast decay of autocovariance oscillations.DR¼240 ms andVR¼0.7.
(B) A long survival time of the ground state leads to slow decay of oscillations.DR¼120 ms andVR¼0.67.
In (A) and (B),LR¼13 andpR¼0.92.
Found at doi:10.1371/journal.pcbi.0030249.sg002 (85 KB PDF).
Figure S3.Average CSP Functions Fitted without Burst Epochs (A–D) Unlike in Figure 5, no burst epochs (fluctuations inp) were included in the model. Model curves (black) represents the best fits achievable by trial and error. The arrows indicate regions where the quality of fit could not be improved. Same legend as in Figure 5. Found at doi:10.1371/journal.pcbi.0030249.sg003 (49 KB PDF).
Acknowledgments
We would like to thank Klaus Hepp for helpful discussions about the manuscript.
Author contributions.APW performed the model simulations, and RHRH wrote the manuscript.
Funding. This work was supported by a Schweizerischer Natio-nalfonds (SNF) professorship grant to RHRH.
Competing interests.The authors have declared that no competing interests exist.
References
1. Hahnloser R, Kozhevnikov A, Fee MS (2002) An ultrasparse code underlies the generation of neural sequences in a songbird. Nature 419: 65–70. 2. Luczak A, Bartho P, Marguet SL, Buzsaki G, Harris KD (2007) Sequential
structure of neocortical spontaneous activity in vivo. Proc Natl Acad Sci U S A 104: 347–352.
3. Kenet T, Bibitchkov D, Tsodyks M, Grinvald A, Arieli A (2003) Sponta-neously emerging cortical representations of visual attributes. Nature 425: 954–956.
4. Dave AS, Margoliash D (2000) Song replay during sleep and computational rules for sensorimotor vocal learning. Science 290: 812–816.
5. Louie K, Wilson MA (2001) Temporally structured replay of awake hippocampal ensemble activity during rapid eye movement sleep. Neuron 29: 145–156.
6. Tsodyks M, Kenet T, Grinvald A, Arieli A (1999) Linking spontaneous activity of single cortical neurons and the underlying functional archi-tecture. Science 286: 1943–1946.
7. Dan Y, Alonso JM, Usrey WM, Reid RC (1998) Coding of visual information by precisely correlated spikes in the lateral geniculate nucleus. Nat Neurosci 1: 501–507.
8. Hatsopoulos NG, Paninski L, Donoghue JP (2003) Sequential movement representations based on correlated neuronal activity. Exp Brain Res 149: 478–486.
9. Schneidman E, Berry MJ Jr, Segev R, Bialek W (2006) Weak pairwise correlations imply strongly correlated network states in a neural population. Nature 440: 1007–1012.
10. Leonardo A, Fee MS (2005) Ensemble coding of vocal control in birdsong. J Neuroscience 19: 652–661.
11. Kozhevnikov A, Fee MS (2006) Singing-related activity of identified HVC neurons in the zebra finch. J Neurophysiol 97: 4271–4283.
12. Hahnloser HR, Kozhevnikov AA, Fee MS (2006) Sleep-related neural activity in a premotor and a basal-ganglia pathway of the songbird. J Neurophysiol 96: 794–812.
13. Dave AS, Yu AC, Margoliash D (1998) Behavioral state modulation of auditory activity in a vocal motor system. Science 282: 2250–2254. 14. Jin DZ, Ramazanoglu FM, Seung HS (2007) Intrinsic bursting enhances the
robustness of a neural network model of sequence generation by avian brain area HVC. J Comput Neurosci 23: 283–299.
15. Fee MS, Kozhevnikov AA, Hahnloser RH (2004) Neural mechanisms of
vocal sequence generation in the songbird. Ann N Y Acad Sci 1016: 153– 170.
16. Deppisch J, Pawelzik K, Geisel T (1994) Uncovering the synchronization dynamics from correlated neuronal activity quantifies assembly formation. Biol Cybern 71: 387–399.
17. Danoczy M, Hahnloser HR (2005) Efficient estimation of hidden state dynamics from spike trains. Neural Inf Process Syst (NIPS) 18. Available: http://books.nips.cc/papers/files/nips18/NIPS2005_0482.pdf. Accessed 16 November 2007.
18. Yu BM, Afshar A, Snathanam G, Ryu SI, Shenoy KV, et al. (2005) Extracting dynamical structure embedded in neural activity. Neural Inf Process Syst (NIPS) 18. Available: http://www.stanford.edu/;shenoy/GroupPublications/ YuEtAlNIPS2005.pdf. Accessed 19 November 2007.
19. Truccolo W, Eden UT, Fellows MR, Donoghue JP, Brown EN (2005) A point process framework for relating neural spiking activity to spiking history, neural ensemble, and extrinsic covariate effects. J Neurophysiol 93: 1074– 1089.
20. Brown EN, Barbieri R, Ventura V, Kass RE, Frank LM (2002) The time-rescaling theorem and its application to neural spike train data analysis. Neural Comput 14: 325–346.
21. Rosen MJ, Mooney R (2006) Synaptic interactions underlying song-selectivity in the avian nucleus HVC revealed by dual intracellular recordings. J Neurophysiol 95: 1158–1175.
22. Mooney R, Prather JF (2005) The HVC microcircuit: the synaptic basis for interactions between song motor and vocal plasticity pathways. J Neurosci 25: 1952–1964.
23. Hahnloser RH, Fee MS (2007) Sleep-related spike bursts in HVC are driven by the nucleus interface of the nidopallium. J Neurophysiol 97: 423–435. 24. Hahnloser RH (2007) Cross-intensity functions and the estimate of
spike-time jitter. Biol Cybern 96: 497–506.
25. Glaze CM, Troyer TW (2006) Temporal structure in zebra finch song: implications for motor coding. J Neurosci 26: 991–1005.
26. Mazor O, Laurent G (2005) Transient dynamics versus fixed points in odor representations by locust antennal lobe projection neurons. Neuron 48: 661–673.
27. Rabinovich M, Volkovskii A, Lecanda P, Huerta R, Abarbanel HD, et al. (2001) Dynamical encoding by networks of competing neuron groups: winnerless competition. Phys Rev Lett 87: 068102.
28. Hinton GE, Dayan P, Frey BJ, Neal RM (1995) The‘‘wake-sleep’’algorithm for unsupervised neural networks. Science 268: 1158–1161.
29. Deregnaucourt S, Mitra PP, Feher O, Pytte C, Tchernichovski O (2005) How sleep affects the developmental learning of bird song. Nature 433: 710–716.
30. Walker MP, Stickgold R (2006) Sleep, memory, and plasticity. Annu Rev Psychol 57: 139–166.