Incidence and prevalence of diabetes
mellitus in the Americas
Alberto Barceló
1and Swapnil Rajpathak
1Objective. To present the incidence and prevalence of diabetes mellitus in the Americas as found through a thorough review of published information on the subject.
Methods. Data were obtained through a comprehensive review using the MEDLINE and BIREME bibliographical databases. In addition, government publications, conference reports, and meeting documents were identified by contacting government and nongovernmental orga-nizations and other institutions. Incidence and prevalence rates were adjusted by age and sex, when possible, by the direct method using the world Segi population as the standard. The 95% confidence intervals were calculated using the Poisson distribution or the normal distribution.
Results. Diabetes mellitus represents a major public health problem in the Americas, and there is evidence that its prevalence is increasing in some countries.
Conclusions. Given that most Latin American and Caribbean nations are experiencing a demographic transition, it is expected that the prevalence of diabetes will continue to increase rapidly in the near future. Despite the economic constraints faced by the countries of the Amer-icas, there is a clear need for more efforts in the area of diabetes prevention and control.
Diabetes, prevalence, Region of the Americas.
ABSTRACT
Diabetes mellitus is a chronic meta-bolic disease characterized by hy-perglycemia and by disturbances of carbohydrate, fat, and protein metabo-lism. It is associated with an absolute or relative deficiency in the secretion and/or action of the hormone insulin. In the Americas, the number of people with diabetes mellitus was estimated at 35 million in 2000 and is expected to increase to 64 million by 2025. Whereas currently 52% of these people from the Americas live in Latin Amer-ica and the Caribbean, by 2025 the
per-centage will have reached 62%, repre-senting 40 million persons (1). This in-crease results from multiple factors involved in lifestyle changes related to modern life such as the decrease in physical activities and the predomi-nance of hypercaloric diets and the re-sulting obesity. Also playing a major part is the aging process of the popu-lation in developing countries. Given these various factors, an increase in di-abetes mellitus caseload will be more evident in developing countries.
Diabetes increases the risk of prema-ture death mainly due to an increased risk of cardiovascular events. In addi-tion, people suffering from diabetes have a greater risk of developing vi-sual problems and renal disease as well as undergoing lower-extremity amputations.
Diagnostic criteria and classification
In 1985 the World Health Organiza-tion (WHO) published updated crite-ria for the diagnosis of diabetes mel-litus (2). More recently, in 1997, the American Diabetes Association (ADA) published new diagnostic criteria low-ering the fasting plasma glucose con-centration for the diagnosis of the dis-ease from ≥140 mg/dL to ≥126 mg/ dL. WHO published similar criteria for the diagnosis of diabetes in 1999 after a WHO expert committee reviewed the issue and reached the same conclu-sions as the ADA (3, 4). A new cutoff point for plasma glucose concentra-tion 2 hours after an oral dose of 75 mg of glucose was established because of the proven increase in the prevalence of diabetes-related microvascular
com-1 Pan American Health Organization, Washington,
plications (e.g., retinopathy and ne-phropathy) among people with values of ≥200 mg/dL. The previous fasting glucose cutoff point of 140 mg/dL identified subjects with more severe hyperglycemia than the present 2-hour cutoff point of 200 mg/dL. Thus, by lowering the fasting cutoff point to 126 mg/dL, it becomes possible to identify subjects whose hyperglyce-mia is roughly equivalent to that of subjects who test positive on the 2-hour glucose tolerance test.
In addition, in 2000 the ADA rec-ommended using a fasting plasma glu-cose of ≥ 126 mg/dL as the sole criterion for diagnosing diabetes in epi-demiologic studies (5). However, WHO still recommends the 2-hour oral glu-cose tolerance test (OGTT) as the single best diagnostic criterion for such stud-ies, but if this test cannot be performed because of logistic or economic reasons, the fasting plasma glucose alone, as es-tablished by the ADA, may be used in-stead as the basis for the diagnosis (4). According to the updated WHO classi-fication of diabetes, there are two major forms of the disease: type 1 and type 2 (formerly, respectively, insulin-depen-dent diabetes mellitus (IDDM) and non-insulin dependent diabetes melli-tus (NIDDM)). Type 1 diabetes appears mainly in children and young adults, is characterized by an acute onset, and re-quires insulin treatment. Type 2 dia-betes appears insidiously, mainly in adults, and can be treated in a variety of ways, including with a dietary regi-men, oral hypoglycemic agents, insulin, or a combination of these. Type 2 dia-betes is the most common form of the disease, accounting for about 85% to 90% of all cases. It has been linked to potentially modifiable risk factors such as obesity, lack of exercise, and a hy-percaloric diet. As many studies have demonstrated, in most populations there are many people with undiag-nosed type 2 diabetes (6–8). Another important subcategory under type 2 of the disease is gestational diabetes, which is defined as glucose intolerance (of any degree) diagnosed for the first time during pregnancy (9). It is esti-mated that about 4% of pregnant women develop this form of diabetes.
The objective of this paper is to pre-sent the incidence and prevalence of diabetes mellitus in the Americas as found through a comprehensive re-view of published information on the subject.
MATERIALS AND METHODS
We conducted a comprehensive literature search to identify results from apparently unbiased population-based diabetes surveys and registries. The search was conducted using the MEDLINE and BIREME bibliographic databases. The terms used in the search were “diabetes incidence,” “diabetes prevalence,” “diabetes survey,” and “diabetes registry.” Literature that was not indexed, such as gray papers, gov-ernment publications, and conference proceedings, was obtained by contact-ing government offices, nongovern-mental organizations, scientific and di-abetes associations, and the country offices of the Pan American Health Organization (PAHO). Incidence and prevalence rates were adjusted by age and sex, when possible, by the direct method, using the world Segi popula-tion as the standard (10). The 95% con-fidence intervals (95% CIs) were calcu-lated using the Poisson distribution or the normal distribution, as described by King et al. (11). Published articles including diabetes estimates and pro-jections were also reviewed.
RESULTS
Incidence and prevalence of childhood diabetes
The worldwide incidence of type 1 diabetes has been evaluated during the last 20 years through the DiaMond Project (12–14), which oversees the maintenance of registries of children with diabetes around the world. About 24 of these registries operate in the Region of the Americas. There have been other publications in the Re-gion on the incidence of type 1 dia-betes, mainly in children under 15 years of age. Since most registries rely
on more than one source of informa-tion, we assessed their completeness. The subsections below summarize the data for the specific subregions and countries of the Americas, with Table 1 providing additional details.
North America. Amos et al. (15) esti-mated the prevalence of type 1 dia-betes in North America in 1997 among children under 15 years of age at 53.4 per 10 000 population. For that year, prevalence rates ranged from 8.3 per 10 000 population in the United States to 0.3 per 10 000 in Mexico. Prince Ed-ward Island, Canada, has reported the highest incidence of type 1 diabetes in children in the Americas (12, 13). The Montreal, Canada, registry reported an incidence rate of 10.1 per 100 000 for the period 1975–1981 (16). Three registries from the United States were included in the DiaMond report of 2000, all of them covering the period of 1990–1994: Allegheny County, Penn-sylvania (incidence of 17.8 per 100 000 population); Jefferson, Alabama (in-cidence of 15.0 per 100 000), and Chicago, Illinois (incidence of 11.7 per 100 000 population). A registry in Rochester, Minnesota, reported a childhood incidence rate of 20.8 per 100 000 in 1980 (14).
Caribbean. In the Caribbean, the esti-mated prevalence rate of type 1 dia-betes in children under 15 years of age ranged from 6.4 per 10 000 in Puerto Rico to 0.3 per 10 000 in Haiti in 1997 (Table 1). A high incidence rate has been consistently reported by Puerto Rico (19). The lowest childhood inci-dence in the Caribbean was reported for Barbados.
Antigua, Barbados, Dominica, Saint. Croix, Saint Thomas, and Tortola Is-land reported on the incidence of type 1 diabetes among those aged 0 to 19 years. The highest incidence rate was reported for Saint Croix, and the low-est was reported for Saint Kitts (20).
chil-dren under the age of 15 years ranged from 1.1 per 10 000 population in Panama to 0.4 per 10 000 in Guatemala and Honduras in 1997 (Table 1).
South America. In South America in 1997, 31 000 children under 15 years of age were estimated to have type 1 diabetes (15). The greatest prevalence
was estimated for Uruguay (4.9 per 10 000), while the lowest was esti-mated for Peru (0.4 per 10 000) (Table 1). The highest incidence of type 1
TABLE 1. Incidence and estimated prevalence of type 1 diabetes mellitus in children in Latin America and the Caribbean
Adjusted incidence (per 100 000)a
Gender Estimated
Age prevalence
Country Study, year(s), reference (years) Male Female Both (95% CI) (per 10 000)
North America
Canada Montreal, 1971–83 (15) ≤14 9.0 9.1 9.0 (7.7–10.6) 6.4
Prince Edw. Isl., 1990–93 (13) ≤14 28.0 20.8 24.5 (16.38–35.15)
Alberta, 1990–94 (13) ≤14 23.4 24.7 24.0 (20.6–27.8)
Manitoba, 1985–93 (17) ≤14 20.4 (16.2–24.5)b
Manitoba, 1991–93 (13) ≤14 21.4 20.7 21.1 (17.1–25.9)
Mexico Veracruz, 1990–93 (13) ≤14 1.5 (0.7–2.9) 0.3
United States Allegheny, PA, 1990–94 (13) ≤14 19.1 16.4 17.8 (15.5–20.3) 8.3
Jefferson, AL, 1990–94 (13) ≤14 14.6 15.4 15.0 (12.2–18.2)
Chicago, IL, 1990–94 (13) ≤14 10.2 13.3 11.7 (10.5–13.1)
Caribbean
Antigua 1989–93 (20) ≤19 3.5 (0.9–8.8)
Barbados 1989–93 (20) ≤19 2.6 (1.3–4.6)
1990–93 (13) ≤14 2.4 1.6 2.0 (0.32–6.4)
Cuba 1990–94 (13) ≤14 2.5 3.4 2.9 (2.6–3.2) 2.5
Dominican Rep. 2.5
Dominica 1989–93 (20) ≤19 5.1 (2.2–10.1)
1990–93 (13) ≤14 6.6 4.9 5.7 (1.5–14.7)
Haiti ≤14 0.3
Jamaica ≤14 2.5
Puerto Rico 1985–94 (19) ≤14 18.0 (17.6–18.3)b 6.4
1990–94 (13) ≤14 16.2 18.7 17.4 (16.3–18.6)
St. Croix 1989–93 (20) ≤19 10.1 (4.4–19.9)
St. Thomas 1989–93 (20) ≤19 6.3 (2.6–15.7)
Tortola 1989–93 (20) ≤19 3.8 (0.1–21.1)
Trinidad and Tobago ≤14 2.8
U.S. Virgin Isls. 1990–94 (13) ≤14 14.7 11.5 13.1 (7.6–21.0)
Central America
Costa Rica ≤14 0.8
El Salvador ≤14 0.5
Guatemala ≤14 0.4
Honduras ≤14 0.4
Nicaragua ≤14 0.5
Panama ≤14 1.1
South America
Argentina Avellaneda, 1990–94 (13) ≤14 5.6 7.5 6.5 (4.3–9.5) 4.3
Córdoba, 1991–92 (13) ≤14 6.2 7.9 7.0 (5.2–9.3)
Corrientes, 1992–94 (13) ≤14 2.9 5.7 4.3 (2.2–7.5
Tierra del Fuego, 1993–94 (13) ≤14 20.2 8.0 (2.2–17.6)
Bolivia ≤14 0.6
Brazil Passo Fundo, 1996 (21) ≤14 12.0b 4.0
São Paulo, 1990–92 (13) ≤14 6.9 9.1 8.0 (5.5–11.1)
Chile Santiago, 1990–92 (13) ≤14 1.7 1.5 1.6 (1.3–2.0) 1.4
Santiago, 1990–93 (22) ≤14 2.4b
Colombia 1990 (13) ≤14 4.7 2.9 3.8 (2.9–4.9) 1.8
Ecuador 1.9
Paraguay 1990–94 (13) ≤14 1.0 0.8 0.9 (0.7–1.1) 1.0
Peru 1990–91(13) ≤14 0.2 0.6 0.4 (0.2–0.6) 0.4
Uruguay 1992 (31) ≤14 8.3 8.3 8.3 (5.4–12.1) 4.9
Venezuela 1992 (13) ≤14 0.1 0.2 0.1 (0.09–0.18) 2.4
diabetes among children was also re-ported in Uruguay (8.3 per 100 000), while the lowest was reported in Venezuela (0.1 per 100 000). Tierra del Fuego, Argentina, reported an incidence rate of 20.2 per 100 000 among boys, but this rate was based on only 4 cases, and no case was re-ported among girls, for a total in-cidence of 8.0 per 100 000 for both sexes. In the Americas, only the Co-lombian registry reported statisti-cally significant differences between boys and girls (4.7 vs. 2.9 per 100 000, respectively).
Diabetes in adult populations
Most countries in Latin America and the Caribbean do not carry out epi-demiological surveillance for diabetes in adults. Therefore, information on the prevalence of this type of diabetes in those nations is limited. Some sur-veys have been conducted but not usually as part of national or regional policies for diabetes surveillance. Ac-cordingly, surveys of diabetes carried out in Latin America and the Ca-ribbean have been sporadic, and they differ in important methodological
features such as selection of the study population, age, sampling method, and diagnostic criteria. For this reason, comparison between studies is often problematic. Nevertheless, diabetes surveys provide the only data avail-able on the epidemiology of this disease. The characteristics of the dia-betes surveys conducted in the Ameri-cas are shown in Table 2. Most of the selected studies used the oral glucose tolerance test (OGTT) as a diagnostic test along with the WHO 1985 diag-nostic criteria (2). The largest survey conducted in the Americas, which
in-TABLE 2. Characteristics of diabetes surveys of adults conducted in the Americas
Sample Age Diagnostic Glucose
Country Population, reference Year size (years) testa load (g) Criteria
North America
Canada Native, River Desert (25) 1995 131 30–64 OGTT 75 WHO 1985
Native, Lac Simon (25) 1995 168 30–64 OGTT 75 WHO 1985
Mexico Mexico City (26) 1992 646 35–64 OGTT 75 WHO 1985
Mexico City (27) 1994 805 20–90 FPG — 140 mg/dL
United States Three ethnic groups (28) 1988–94 2 844 40–74 OGTT 75 WHO 1985
Pima Indians (30) 1982–90 3 733 25+ OGTT 75 WHO 1985
Caribbean
Barbados Bridgetown (31) 1993 464 40–79 FPG — 140 mg/dL
Cuba Santiago C (32) 1987 500 15+ OGTT 75 WHO 1985
Havana (33) 1998 250 25+ OGTT 75 WHO 1985
Guadeloupe Guadeloupe (34) 1989 1 049 18+ OGTT 75 WHO 1985
Jamaica Jamaica (6) 1995 2 109 15+ OGTT 75 WHO 1985
Spanish Town (35) 1999 1 303 25+ OGTT 75 WHO 1985
Trinidad & Tobago St. James (36) 1985 2 516 35–69 OGTT 75 WHO 1985
South America
Argentina La Plata (38) 1987 809 20–74 OGTT 50 WHO 1985
Avellaneda (39) 1979 596 20–69 OGTT 50 150 mg/dL
Bolivia Four cities (8) 1998 2 500 25+ OGTT 75 WHO 1985
Brazil Nine cities (40) 1986–88 21 847 30–69 OGTT 75 WHO 1985
Rio de Janeiro (41) 1986–88 2 051 30–69 OGTT 75 WHO 1985
São Paulo, Issei (42) 1996 238 40–79 OGTT 75 WHO 1985
São Paulo, Nisei (42) 1996 292 40–79 OGTT 75 WHO 1985
Chile Santiago (45) 1979 1 110 20+ OGTT 50 150 mg/dL
Valparaíso (44) 1997 3 120 25–64 OGTT 75 WHO 1985
Mapuche (45) 1983 510 20+ OGTT 75 WHO 1985
Mapuche (46) 1998 319 20+ OGTT 75 WHO 1985
Aymara (47) 1998 196 20+ OGTT 75 WHO 1985
Colombia Urban (7) 1993 670 30+ OGTT 75 WHO 1985
Paraguay Urban (48) 1992 1 094 20–74 OGTT 75 WHO 1985
Peru Three zones (49) 1997 302 30+ OGTT 75 WHO 1985
Suriname Main ethnic groups (50) 1985 1 218 30+ OGTT 50 180 mg/dL
Uruguay Urban-rural (51) 1966 484 30+ OGTT b 150 mg/dL
Venezuela Urban (51) 1966 480 30+ OGTT b 150 mg dL
Urban (52) 1997 669 30+ OGTT 75 135 mg/dLc
Mérida (53) 1980 398 30–69 FPG — 140 mg/dL
aDiagnostic tests: OGTT = oral glucose tolerance test; FPG = fasting plasma glucose. bGlucose load: 1 g/kg of body weight.
cluded 21 847 persons, was carried out in Brazil in 1986–1988.
North America. The most recent esti-mate of the prevalence of diagnosed diabetes among adults in Canada, as revealed by the 1996–1997 National Population Health Survey, was 3.2% (24). In the United States, the National Health and Nutrition Examination Survey (NHANES) periodically con-ducts a cross-sectional nationally rep-resentative survey among participants aged 20 years and over who complete a household interview. As part of this survey, a subsample of 2 844 subjects between the ages of 40 and 74 years underwent an OGTT between 1988 and 1994. Based on WHO diagnostic criteria, the prevalence rate of dia-betes (previously and newly diag-nosed) increased from 11.4% in 1976–1980 to 14.3% in 1988–1994 (28). Diabetes prevalence rates for Mexi-can-Americans were twice as high as for non-Hispanic whites. About 20% of non-Hispanic blacks in the United States were affected by diabetes; the prevalence rate in this group was the second highest after that of Mexican-Americans (Table 3). The Pima Indi-ans from the state of Arizona have shown the highest prevalence of dia-betes in the Americas and one of the highest in the world. The reported age- and sex-adjusted rate for this group was 21.1% in 1978 (29). After adjusting for age and sex with the world population as the standard, the prevalence of diabetes for Pima Indi-ans 25 years of age or older in 1982– 1990 was 51.4% overall for males and females (30).
Caribbean. We found no reports showing survey results for the Do-minican Republic, Haiti, Martinique, the Netherlands Antilles, and Puerto Rico. Among the surveys found that used OGTT as the diagnostic test, the highest crude prevalence rate of dia-betes was reported by Jamaica in 1995, 17.9%. The lowest crude rate (4.6%) was reported in Santiago, Cuba, but a
higher prevalence was reported more recently in Havana (11.8%). All Carib-bean countries with surveys found had age- and sex-adjusted prevalence rates for diabetes of over 10%.
In Barbados, a diabetes survey that employed a fasting plasma glucose of > 140 mg/dL as the diagnostic crite-rion found a crude prevalence rate of 17%; after age and sex adjustment, that rate dropped to 16.4%.
Central America. No publications showing the prevalence of diabetes in Central America and meeting our methodological requirements for inclu-sion could be found. The 1998 National Household Survey in Costa Rica re-ported a prevalence rate of diagnosed diabetes among adults of 2.8% in the general population and 9.4% among those aged 40 years or over (37).
South America. No published reports were found showing results of glu-cose tolerance tests in Ecuador and Guyana. Among the surveys using OGTT and the WHO diagnostic crite-ria, the highest crude prevalence rate of diabetes was reported among Jap-anese immigrants to Brazil (Issei (sec-ond generation), 16.2%; Nisei (first generation), 12.6%). The adjusted prevalence rate for East Indians in Suriname (12.7%) was the highest in South America, but this study used an oral glucose load of 50 g for the 2-hour test and a cutoff blood glucose value of 180 mg/dL. Most South American studies reported diabetes prevalence rates of between 6% and 9%. The low-est crude prevalence rate was reported for the Aymara Indians in Chile (1.5%). The Mapuche Indians from Chile showed a low prevalence rate (1.0%) in 1985, but a more recent sur-vey reported a prevalence rate of 4.1% in this group. A study conducted in Uruguay and Venezuela in 1966, using an oral load of 1 g of glucose per kg of body weight and a cutoff point of 150 mg/dL, reported prevalence rates of 6.9% and 7.3% for these countries, respectively.
Adjusted prevalence rates among subjects aged 35 to 64 years
Among people 35 to 64 years old, in the countries for which data were available, the prevalence of diabetes was highest in Jamaica (15.6%) (Table 4). Mexico, Trinidad and Tobago, and Bolivia also presented prevalence rates over 10%. Moderate prevalence rates (3%–10%) were observed in the rest of the countries. The lowest prevalence rate was observed in La Plata, Argen-tina (3.0%). Jamaican, Mexican, and Chilean males had prevalence rates of over 10%. Moderate prevalence rates for diabetes were observed in males from the rest of the countries. Women were at higher risk in Jamaica, Mexico, Trinidad and Tobago, and Bolivia, while Brazilian, Colombian, Para-guayan, and Surinamese women had moderate prevalence rates (3%–9%). Argentine women presented the low-est prevalence rate (2.6%).
DISCUSSION
As evidenced by the data presented in this article, in some areas of the Americas there is a pronounced lack of information regarding diabetes. None-theless, it is obvious that diabetes rep-resents a major public health problem for the Americas, and there is evidence that its prevalence is increasing (33, 46). Given that most Latin American and Caribbean countries are experi-encing a demographic transition, the prevalence of diabetes is expected to increase rapidly in the near future.
Rev Panam Salud Publica/Pan Am J Public Health
10(5), 2001
305
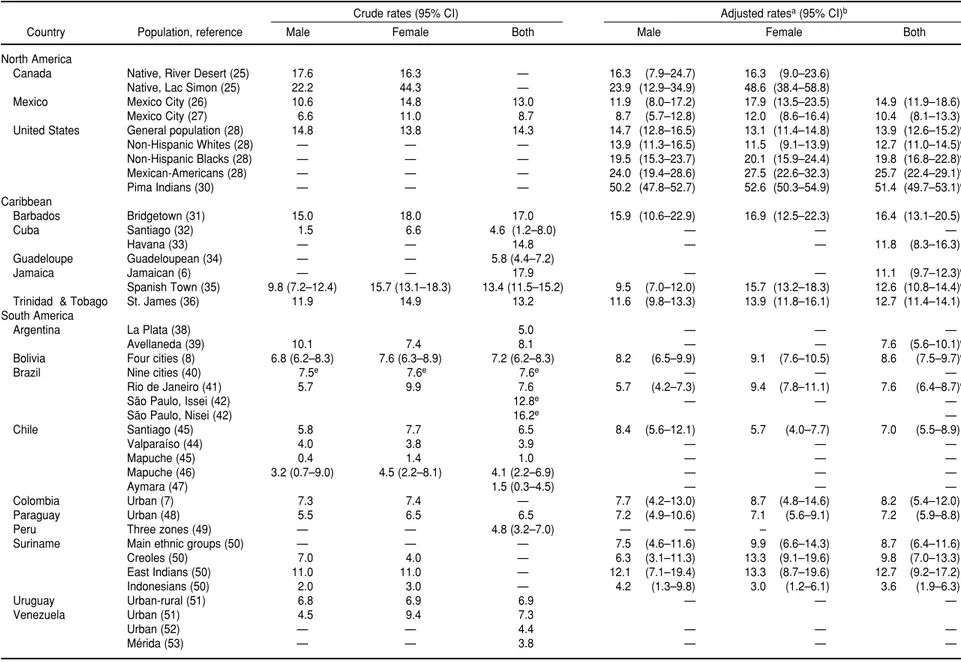
TABLE 3. Survey results showing the prevalence (%) of diabetes mellitus among adult populations of the Americas
Crude rates (95% CI) Adjusted ratesa(95% CI)b
Country Population, reference Male Female Both Male Female Both
North America
Canada Native, River Desert (25) 17.6 16.3 — 16.3 (7.9–24.7) 16.3 (9.0–23.6)
Native, Lac Simon (25) 22.2 44.3 — 23.9 (12.9–34.9) 48.6 (38.4–58.8)
Mexico Mexico City (26) 10.6 14.8 13.0 11.9 (8.0–17.2) 17.9 (13.5–23.5) 14.9 (11.9–18.6)
Mexico City (27) 6.6 11.0 8.7 8.7 (5.7–12.8) 12.0 (8.6–16.4) 10.4 (8.1–13.3)
United States General population (28) 14.8 13.8 14.3 14.7 (12.8–16.5) 13.1 (11.4–14.8) 13.9 (12.6–15.2)c
Non-Hispanic Whites (28) — — — 13.9 (11.3–16.5) 11.5 (9.1–13.9) 12.7 (11.0–14.5)c
Non-Hispanic Blacks (28) — — — 19.5 (15.3–23.7) 20.1 (15.9–24.4) 19.8 (16.8–22.8)c
Mexican-Americans (28) — — — 24.0 (19.4–28.6) 27.5 (22.6–32.3) 25.7 (22.4–29.1)c
Pima Indians (30) — — — 50.2 (47.8–52.7) 52.6 (50.3–54.9) 51.4 (49.7–53.1)c
Caribbean
Barbados Bridgetown (31) 15.0 18.0 17.0 15.9 (10.6–22.9) 16.9 (12.5–22.3) 16.4 (13.1–20.5)
Cuba Santiago (32) 1.5 6.6 4.6 (1.2–8.0) — — —
Havana (33) — — 14.8 — — 11.8 (8.3–16.3)
Guadeloupe Guadeloupean (34) — — 5.8 (4.4–7.2)
Jamaica Jamaican (6) — — 17.9 — — 11.1 (9.7–12.3)d
Spanish Town (35) 9.8 (7.2–12.4) 15.7 (13.1–18.3) 13.4 (11.5–15.2) 9.5 (7.0–12.0) 15.7 (13.2–18.3) 12.6 (10.8–14.4)c
Trinidad & Tobago St. James (36) 11.9 14.9 13.2 11.6 (9.8–13.3) 13.9 (11.8–16.1) 12.7 (11.4–14.1)c
South America
Argentina La Plata (38) 5.0 — — —
Avellaneda (39) 10.1 7.4 8.1 — — 7.6 (5.6–10.1)d
Bolivia Four cities (8) 6.8 (6.2–8.3) 7.6 (6.3–8.9) 7.2 (6.2–8.3) 8.2 (6.5–9.9) 9.1 (7.6–10.5) 8.6 (7.5–9.7)c
Brazil Nine cities (40) 7.5e 7.6e 7.6e — — —
Rio de Janeiro (41) 5.7 9.9 7.6 5.7 (4.2–7.3) 9.4 (7.8–11.1) 7.6 (6.4–8.7)c
São Paulo, Issei (42) 12.8e — — —
São Paulo, Nisei (42) 16.2e —
Chile Santiago (45) 5.8 7.7 6.5 8.4 (5.6–12.1) 5.7 (4.0–7.7) 7.0 (5.5–8.9)
Valparaíso (44) 4.0 3.8 3.9 — — —
Mapuche (45) 0.4 1.4 1.0 — — —
Mapuche (46) 3.2 (0.7–9.0) 4.5 (2.2–8.1) 4.1 (2.2–6.9) — — —
Aymara (47) 1.5 (0.3–4.5) — — —
Colombia Urban (7) 7.3 7.4 — 7.7 (4.2–13.0) 8.7 (4.8–14.6) 8.2 (5.4–12.0)
Paraguay Urban (48) 5.5 6.5 6.5 7.2 (4.9–10.6) 7.1 (5.6–9.1) 7.2 (5.9–8.8)
Peru Three zones (49) — — 4.8 (3.2–7.0) — — –
Suriname Main ethnic groups (50) — — — 7.5 (4.6–11.6) 9.9 (6.6–14.3) 8.7 (6.4–11.6)
Creoles (50) 7.0 4.0 — 6.3 (3.1–11.3) 13.3 (9.1–19.6) 9.8 (7.0–13.3)
East Indians (50) 11.0 11.0 — 12.1 (7.1–19.4) 13.3 (8.7–19.6) 12.7 (9.2–17.2)
Indonesians (50) 2.0 3.0 — 4.2 (1.3–9.8) 3.0 (1.2–6.1) 3.6 (1.9–6.3)
Uruguay Urban-rural (51) 6.8 6.9 6.9 — — —
Venezuela Urban (51) 4.5 9.4 7.3
Urban (52) — — 4.4 — — —
Mérida (53) — — 3.8 — — —
aStandardized using the world population (10).
b95% confidence intervals based on the Poisson distribution. c 95% confidence intervals based on a normal distribution. d Standardized by age.
and disability among young adults make this disease a considerable bur-den to society (54–57). Public health actions to ensure access to quality care in this population are urgently needed. Although type 2 diabetes appears with more frequency in people over 40 years of age, there are reports showing a growing prevalence of this clinical type among children in various seg-ments of the United States population (58–61). It is not clear whether this phe-nomenon is already occurring in LAC, but it is anticipated that a similar trend will emerge unless prevention strate-gies are introduced in the LAC nations. Of special note are the prevalence rates of diabetes mellitus observed among native American populations and other ethnic and minority groups in the various countries of the Amer-icas. In the state of Arizona in the United States, more than half of the adult Pima Indians are known to have diabetes, and other Native Americans from the United States and Canada also have an increased prevalence of diabetes. Other ethnic and minority
groups in the United States, such as Mexican-Americans and non-Hispanic blacks, are also disproportionately af-fected by diabetes (28).
In most urban populations of Latin America and the Caribbean, the preva-lence of diabetes among adults is be-tween 6% and 8%. While the Mapuche Indians of Chile were practically free of diabetes in 1985, they showed prev-alence rates of 3.2% among males and 4.5% among females in 2000. These re-sults suggest that an acculturation process, with the predominance of a lack of physical activity and a hyper-caloric diet, may be occurring in this na-tive community, and the same process may be occurring across Latin America.
It is evident from the results of vari-ous surveys in LAC that diabetes is particularly affecting people from the lower socioeconomic classes, as evi-denced by higher prevalence rates for people with lower educational levels in Bolivia (8) and in Jamaica (6). This may be because of higher exposure to major risk factors such as hypercaloric diet, low physical activity, and obesity.
According to new evidence from the Finnish Diabetes Prevention Study (62) and elsewhere, more than half of the diabetes cases can be prevented among those at higher risk. Diabetes preven-tion and control programs are urgently needed and are potentially cost-effec-tive strategies that can reduce the huge burden of diabetes (63). Disease control programs should address the compar-atively higher prevalence of diabetes reported among women, the less edu-cated, and low-income populations in the Americas. Despite economic con-straints, there is a clear need for inter-vention. A coordinated action plan to deal with the current epidemic of dia-betes is critical in order to take the available technological advances in the field of diabetes prevention and con-trol and to translate them into afford-able public health actions.
Acknowledgements. The authors would like to thank Maureen Harris and Peter Bennett for their support in providing data for the completion of this paper.
TABLE 4. Adjusted diabetes prevalence ratesa(%) among individuals 34–64 years of age in selected countries of Latin America and the Caribbean
Adjusted rate (95% CI)b
Country Population, reference Male Female Both
Mexico Mexico City (27) 11.9 (8.0–17.2) 17.9 (13.5–23.5) 14.9 (11.9–18.6)
Jamaica Spanish Town (35) 12.7 (9.1–17.4) 18.4 (14.9–22.8) 15.6 (13.1–18.6)
Trinidad and Tobago St. James (36) 9.3 (7.7–10.9) 12.5 (10.4–14.5) 10.9 (9.6–12.1)c
Argentina La Plata (37) 3.4 (1.5–6.7) 2.6 (1.0–5.7) 3.0 (1.6–5.1)
Bolivia Four cities (9) 9.5 (7.2–11.8) 10.6 (8.6–12.7) 10.1 (8.5–11.6)c
Brazil Rio de Janeiro (40) 6.0 (4.8–7.6) 9.7 (7.7–12.1) 7.9 (6.7–9.2)
Chile Santiago (42) 10.1 (5.9–16.1) 6.7 (4.3–10.0) 8.4 (6.0–11.4)
Colombia Urban (8) 7.6 (4.1–12.8) 8.6 (4.7–14.4) 8.1 (5.3–11.8)
Paraguay Urban (46) 7.6 (4.9–11.3) 8.6 (6.2–10.9) 8.9 (6.3–10.0)
Suriname All races (47) 7.3 (4.3–11.6) 8.7 (6.0–10.6) 8.0 (6.0–10.6)
aTruncated rate adjusted using the world population (10) by the direct method. b95% confidence intervals based on the Poisson distribution.
c95% confidence intervals based on a normal distribution.
1. King H, Aubert RE, Herman WH. Global burden of diabetes, 1995–2025. Diabetes Care 1998;21:1414–1431.
2. World Health Organization. Diabetes mellitus: report of a WHO study group on
diabetes mellitus. Geneva: WHO; 1985. (WHO Technical Report Series No. 727). 3. Expert Committee on the Diagnosis and
Classification of Diabetes Mellitus. Report of the Expert Committee on the Diagnosis
and Classification of Diabetes Mellitus. Diabetes Care 1997;20:1183–1197. 4. World Health Organization. Definition,
WHO consultation. Geneva: WHO; 1999. (WHO/NCD/NCS 99.2).
5. Expert Committee on the Diagnosis and Classification of Diabetes Mellitus. Report of the Expert Committee on the Diagnosis and Classification of Diabetes Mellitus. Diabetes Care 2000; 23(Supp 1):54–55. 6. Ragoobirsingh D, Lewis-Fuller E,
Morri-son EY. The Jamaican Diabetes Study: a protocol for the Caribbean. Diabetes Care 1995;18(9):1277–1279.
7. Aschner P, King H, Triana de Torrado M, Marina Rodriguez B. Glucose intolerance in Colombia: a population-based survey in an urban community. Diabetes Care 1992;16(1):90–93.
8. Barceló A, Daroca MC, Rivera R, Duarte E, Zapata A. Diabetes in Bolivia. Rev Panam Salud Publica 2001;10(5):318–323. 9. Metzger BE, Coustan DR, eds.
Proceed-ings of the Fourth International Work-shop-Conference on Gestational Diabetes Mellitus. Diabetes Care 1998;21(Suppl 2):B1–B167.
10. Segi M. Cancer mortality for selected sites in 24 countries (1950–57). Sendai: Tohuku University School of Medicine; 1960. 11. King H, Rewers M. Global estimates for
prevalence of diabetes mellitus and im-paired glucose tolerance in adults. WHO Ad Hoc Diabetes Reporting Group. Dia-betes Care 1993;16(1):157–177.
12. WHO Multinational Project for Childhood Diabetes. WHO Diamond Project Group. Diabetes Care 1990;11(10):1062–1068. 13. Karvonen M, Viik-Kajander MV,
Molt-chanova E, Libman I, LaPorte R, Tuomi-lehto J. Incidence of childhood type 1 diabetes worldwide. Diabetes Mondiale (DiaMond) Project Group. Diabetes Care 2000;23:1516–1526.
14. Diabetes Epidemiology Research Inter-national Group. Geographic patterns of childhood insulin-dependent diabetes mellitus. Diabetes 1988;37:1113–1119. 15. Amos AF, McCarty DJ, Zimmet P. The
ris-ing global burden of diabetes and its com-plications: estimates and projections to the year 2010. Diabet Med 1997;14(Suppl 5):S1–S85.
16. Siemiatycki J, Colle E, Aubert D, Camp-bell S, Belmonte MM. The distribution of type 1 (insulin-dependent) diabetes melli-tus by age, sex, secular trend, seasonality, time clusters and space-time cluster: evi-dence from Montreal 1971–1983. Am J Hygiene 1986;124:545–560.
17. Blanchard J, Dean H, Anderson K, Wajda A, Ludwig S, Depew N. Incidence and prevalence of diabetes in children aged 0–14 years in Manitoba, Canada, 1985– 1993. Diabetes Care 1997;20(4):512–515. 18. LaPorte R, Matsushima M, Yue-Fong
Chang. Prevalence and incidence of in-sulin-dependent diabetes mellitus. In: Na-tional Diabetes Data Group. Diabetes in America. Bethesda, Maryland, United States of America: National Institutes of Health; 1995. pp. 34–46. (NIH Publication No. 951468).
19. Fraser de Llado TE, González de Pijem L, Hawk B. Incidence of IDDM in children
living in Puerto Rico. Puerto Rican IDDM Coalition. Diabetes Care 1998;21(5):744– 746.
20. Tull ES, Jordan OW, Simon L, Laws M, Smith DO, Vanterpool H, et al. Incidence of childhood-onset IDDM in Black African-heritage populations in the Ca-ribbean. The Caribbean African Heritage IDDM Study (CAHIS) Group. Diabetes Care 1997;20(3):309–310.
21. Lisboa HRK, Graebin R, Butzke L, Rod-riguez CS. Incidence of type 1 diabetes mellitus in Passo Fundo, RS, Brazil. Bra-zilian J Med Biol Res 1998;31:1553–1556. 22. Carrasco E, Pérez F, Calvillán C, López G,
Wolff C, Castaño A, et al. Incidencia de diabetes mellitus insulino dependiente en Santiago de Chile (1990–1993). Rev Med Chile 1996;124:561–566.
23. Carrasco E, Pérez F, Santos JL, López G, Calvillan M, Wolff C, et al. One of the lowest validated incidence rates of in-sulin-dependent diabetes mellitus in the Americas: Santiago, Chile. Diabetes Res Clin Pract 1996;34 Suppl:S153–S157. 24. Health Canada. Diabetes in Canada.
Ot-tawa: Laboratory Center for Disease Con-trol; 1999.
25. Delisle HF, Rivard M, Ekoe JM. Preva-lence estimates of diabetes and other car-diovascular risk factors in the two largest Algonguin communities of Quebec. Dia-betes Care 1995;18(9):1255–1259. 26. Stern MP, Gonzalez C, Mitchell BD,
Villa-pando E, Haffner SM, Hazuda HP. Ge-netic and environmental determinants of type II diabetes in Mexico City and San Antonio. Diabetes 1992;41:484–492. 27. Posadas-Romero C, Yamamoto-Kimura L,
Lerman-Garber I, Zamora-Gonzalez J, Fajardo-Gutierrez A, Velazquez L, et al. The prevalence of NIDDM and associated coronary risk factors in Mexico City. Dia-betes Care 1994;17(12):1441–1448. 28. Harris MI, Flegal KM, Cowie CC,
Eber-hard MS, Goldstein D, Little RR, et al. Prevalence of diabetes, impaired fasting glucose, and impaired glucose tolerance in U.S. adults: the third National Health and Nutrition Examination Survey, 1988–1994. Diabetes Care 1998;21(4): 518–524. 29. Knowler WC, Bennett PH, Hamman RP,
Miller M. Diabetes incidence and preva-lence in Pima Indians: a 19-fold greater incidence than in Rochester, Minnesota. Am J Epidemiol 1978;108(6):497–505. 30. Knowler WC, Saad MF, Petitt DJ, Nelson
RG, Bennett PH. Determinants of diabetes mellitus in the Pima Indians. Diabetes Care 1993;16(1):216–227.
31. Foster C, Rotimi C, Fraser H, Sundarum C, Liao Y, Gibson E, et al. Hypertension, diabetes, and obesity in Barbados: find-ings from a recent population-based sur-vey. Ethn Dis 1993;3(4):404–412.
32. Salvador Álvarez MJ, Pérez Paz HM. Prevalencia de diabetes mellitus en la po-blación adulta de un área de salud del municipio de Santiago de Cuba. Rev Cub Epidemiol 1987;25(21):205–213.
33. Díaz-Díaz O, Hernández M, Collado F, Seuc A, Márquez A. Prevalencia de
dia-betes mellitus y tolerancia a la glucosa al-terada, sus cambios en 20 años en una comunidad de Ciudad de la Habana. Pri-mera reunión científica conjunta GLED/ EDEG, Programa Científico, Buenos Ai-res, Argentina, 1999.
34. Mouter JP, Kangambeza-Nouvier P, Don-net JP, Pileire B, Echvege E, Patterson AW. Diabetes mellitus and public health in Guadeloupe. West Indian Med J 1990; 39(3):139–143.
35. Wilks R, Rotimi C, Bennett F, McFarlane-Anderson N, Kaufman JS, McFarlane-Anderson SG, et al. Diabetes in the Caribbean: results of a population survey from Spanish Town, Jamaica. Diab Med 1999;16:875–883. 36. Beckles, GLA. Diabetes mellitus and
hy-pertension: prevalence and mortality risk in urban Trinidad (The St. James cardio-vascular survey 1977–85). In: Caribbean Workshop on Standardization of Diabetes Mellitus and Hypertension in the Com-munity. The control of hypertension in the Caribbean community. Bridgetown: Pan American Health Organization; 1988. pp. 38–53.
37. Morice A, Roselló M, Arauz AG, Sánchez G, Padilla G. Diabetes mellitus in Costa Rica. Serie de Documentos Técnicos. San José: INCIENSA; 1999.
38. Hernández RE, Cardonet LJ, Libman C, Gagliardino JJ. Prevalence of diabetes in an urban population of Argentina. Dia-betes 1984;81:18–20.
39. de Sereday M, Di Toro CH, Correa A, Nusimovich B, Kapeluschnik D. Encuesta de prevalencia de diabetes: metodología y resultados. Bol Oficina Sanit Panam 1979; 86(4):293–305.
40. Malerbi DA, Franco LJ. The Brazilian Co-operative Group on The Study of Diabetes Prevalence. Multicenter study of the prev-alence of diabetes mellitus and impaired glucose tolerance in the urban Brazilian population aged 30–69 yr. Diabetes Care 1992;15(11):1509–1516.
41. Oliveira JEP, Milech A, Franco LJ. The prevalence of diabetes in Rio de Janeiro, Brazil. Diabetes Care 1996;19(6):663–665. 42. Franco LJ. Diabetes in
Japanese-Brazilians: influence of the accultura-tion process. Diabetes Res Clin Pract 1996;34(Suppl):S51–S55.
43. Mella I, García de los Ríos M, Parker M, Covarrubias A. Prevalencia de la diabetes mellitus: una experiencia en grandes ciu-dades. Bol Oficina Sanit Panam 1983; 94(2):157–165.
Objetivo. Describir la incidencia y prevalencia de la diabetes sacarina en el conti-nente americano, de acuerdo con los resultados de una revisión exhaustiva de la lit-eratura publicada acerca de este tema.
Métodos. Los datos se obtuvieron mediante una completa revisión de las bases de
datos MEDLINE y BIREME. Además se contactaron las organizaciones gubernamen-tales y no gubernamengubernamen-tales y otras instituciones para identificar las publicaciones gu-bernamentales y los informes de conferencias y reuniones. Las tasas de incidencia y prevalencia se ajustaron por edad y sexo, utilizando, siempre que fuera posible, el método directo, con la población de Segi como estándar. Los intervalos de confianza del 95% se calcularon utilizando la distribución de Poisson o la distribución normal.
Resultados. La diabetes constituye un importante problema de salud pública en
América y hay pruebas de que su prevalencia está aumentando en algunos países.
Conclusiones. Dado que la mayoría de los países latinoamericanos y caribeños están
sufriendo una transición demográfica, es de esperar que la prevalencia de la diabetes siga aumentando rápidamente en un futuro próximo. Pese a las limitaciones económi-cas de muchos países, hay una evidente necesidad de realizar un mayor esfuerzo en el campo de la prevención y control de la diabetes.
RESUMEN
Incidencia y prevalencia de la
diabetes en América
rural Mapuche population from Chile. Nutrition 2001;17(3):236–238.
47. Santos JL, Perez Bravo F, Carrasco E, Calvillan M, Albala C. Low prevalence of type 2 diabetes despite a high average body mass index in the Aymara natives from Chile. Nutrition 2001;17:305–309. 48. Jiménez JT, Palacios M, Cañete F, Barrio
Canal LA, Medina U, Figueredo R, et al. Prevalence of diabetes mellitus and asso-ciated cardiovascular risk factors in an adult urban population in Paraguay. Dia-betic Medicine 1998;15:334–338.
49. Seclen S, Leey J, Villena A, Herrera B, Menacho JC, Carrasco A, et al. Preva-lencia de diabetes mellitus, hipertensión arterial, hipercolesterolemia y obesidad, como factores de riesgo coronario y cere-brovascular en población adulta de la costa, sierra y selva del Perú. Lima: Cole-gio Médico del Perú; 1997.
50. Schaad JDG, Terpstra J, Oemrawsingh I, Nieuwenhuijzen Kruseman AC, Bouwhuis-Hoogerwerf MI. Diabetes prevalence in the three main ethnic groups in Surinam (South America): a population survey. Neth J Med 1985;28:17–20.
51. West KJ, Kalbfleisch JM. Glucose toler-ance, nutrition and diabetes in Uruguay, Venezuela, Malaysia and East Pakistan. Diabetes 1966;15:9–18.
52. Nucete HJ, Mendoza SG, Romero P, So-moza B, Zerpa A. Diabetes mellitus en al-gunas poblaciones del estado de Mérida, Venezuela. Acta Científica Venezolana 1980;31:588–592.
53. Pérez Carrillo JC, Cortes Mogollón MP, Henríquez Villalba FM, Lira Cabrera C,
Chacín Álvarez LF. Prevalencia de dia-betes mellitus y otros factores de riesgo cardiovascular en la región central de Venezuela. Archivo Hospital Vargas 1997; 39(3–4):123–128.
54. Collado-Mesa F, Díaz-Díaz O, Melián-Torres R, Suárez-Pérez R, Vera-González M, Aldana-Padilla D. Mortality of child-hood-onset IDDM patients: a cohort study in Havana City Province, Cuba. Diabetes Care 1997;20(8):1237–1241. 55. Diabetes Epidemiology Research
Inter-national Study. InterInter-national analysis of insulin-dependent diabetes mellitus: a preventable mortality perspective. Am J Epidemiol 1996;142(6):612–618.
56. Dorman JS, LaPorte RE, Kuller LH, Cruickshanks KJ, Orchard TJ, Wagener DK, et al. The Pittsburgh insulin-depen-dent diabetes mellitus (IDDM) morbidity and mortality study: mortality results. Di-abetes 1984;33:271–276.
57. Kostraba JN, Klein R, Dorman JS, Becker DJ, Drash AL, Maser RE, et al. The epi-demiology of diabetes complications study. IV. Correlates of diabetic back-ground and proliferative retinopathy. Am J Epidemiol 1991;133(4):381–391. 58. Fagot-Campagna A, Burrows NR,
Wil-liamson DF. The public health epidemiol-ogy of type 2 diabetes in children and adolescents: a case study of American Indian adolescents in the Southwestern United States. Clin Chim Acta 1999; 286(1–2):81–95.
59. Fagot-Campagna A, Pettitt DJ, Engelgau MM, Burrows NR, Geiss LS, Valez R, et al. Type 2 diabetes among North American
children and adolescents: an epidemio-logic review and a public health perspec-tive. J Pediatr 2000;136(5):664–672. 60. Dabelea D, Hanson RL, Bennett PH,
Roumain J, Knowler WC, Pettitt DJ. In-creasing prevalence of type II diabetes in American Indian children. Diabetologia 1998;41:904–910.
61. Neufeld ND, Raffel LJ, Landon C, Chen YD, Valdheim CM. Early presentation of type 2 diabetes in Mexican-American youth. Diabetes Care 1998;21(1):80–86. 62. Tuomilehto J, Lindstrom J, Erikson J,
Valle TT, Hamalainen H, Ilanne-Parikka P, et al. Prevention of type 2 diabetes mel-litus by changes in lifestyle among sub-jects with impaired glucose tolerance. N Engl J Med 2001;344(18):1343–1350. 63. Gagliardino JJ, Echegoyen G. A model
ed-ucational program for people with type 2 diabetes: a cooperative Latin American implementation study (PENID-LA). Dia-betes Care 2001;24:1001–1007.