Abstracts and Reports
POLIOMYELITIS IN THE AMERICAS, 1969-1984
The Expanded Program on Immunization (EPI) has made major advances since it was launched in the Americas in 1977. Immunization coverage approximately doubled between 1977 and 1984; and, as a consequence, the incidence of the six EPI diseases (measles, poliomyelitis, tuberculosis, diphtheria, tetanus, and pertussis) has been greatly reduced. These achievements have been particularly dramatic in the case of polio.
From 1969 through 1984 a total of 53,25 1 poliomyelitis cases were reported in the Ameri- cas. In the early years of this period (from 1969 through 1977), an average of 4,274 cases were reported annually; in 198 1 - 1983 the annual aver- age was considerably lower (1,115 cases); and in 1984 only 525 cases were reported (Table 1).
Because of incomplete reporting in some countries, these figures may not represent all of the cases that actually occurred. However, the downward trend is clearly evident, even though progressively improved reporting systems have
brought larger proportions of existing cases to the attention of public health authorities in recent years. All subregions in the Americas have shown a decline in the incidence of reported polio cases since the EPI was launched in 1977.
A breakdown of reported cases by country is shown in Table 2. Almost all countries have made notable progress in bringing polio under control. Between 1975-1977 and 1984 there was a tenfold reduction in the average number of polio cases reported annually, and the number of countries in the Americas reporting cases dropped from 19 to 11.
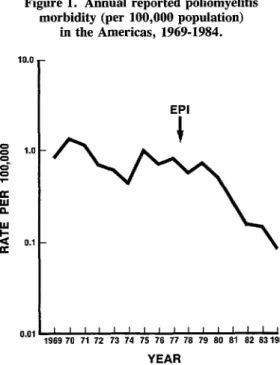
Figure 1 (a semilog chart) shows the annual incidence (per 100,000 population) of paralytic poliomyelitis in all of the Americas between
1969 and 1984. In 1984 the reported incidence for the Region fell below the goal of 0.1 cases per 100,000 population that the Ten-Year Health Plan for the Americas had set for 1979. Twenty- six countries had kept the incidence below that level for at least five years as of 1984 (Table 3).
Table 1. The average numbers of poliomyelitis cases reported annually in the Americas, by geographic subregion, in various periods before and after EPI implementation, and the percentagechange compared to the earliest period.
Pre-EPI stage 1
implementation post-EPI (1969-1977) (1978.1980)
stage 2 post-EPI (1981-1983)
stage 3 post-EPI (1984)
Region (annualavg.) No. ofcases (annual avg.) No. ofcases Change (annual avg.) No. of cases Change No. of cases Change
NorthernAmerica:
Middle America: “ContinentaYa Caribbean
South America: Tropical Temperate
Total
20 23 15% 9 -55% 8 -60%
1,062 1,140 7% 473 -55% 312 -71%
29 1 -97% 19 -34% 0 -100%
3,011 2,465 -18% 599 -80% 205 -93%
151 22 -85% 14 -91% 0 -100%
4,274 3,651 -15% 1,115 -74% 525 -88%
‘Includes the Dominican Republic and Haiti.
390 PAHO BULLETIN l vol. 19, no. 4, 1985
Table 2. The number of poliomyelitis cases reported in the Americas, by country, 19751984.
Avg. number of
cases per year Number of cases
Subregion and country 1975-1977 1978-1980 1981 1982 I983 1984
Northern America: Bermuda Canada United States
Caribbean: Anguilla
AntiguaandBarbuda Bahamas Barbados
British Virgin Islands Cayman Islands Cuba Dominica
Dominican Republic Grenada Haiti Jamaica Montseaat Saint Lucia St. ChristophedNevis St. Vincent and the Grenadines Trinidad and Tobago Turks and Caicos Islands
Continental Middle America: Belize CostaRica El Salvador Guatemala Honduras Mexico Nicaragua Panama
Tropical South America: Bolivia Brazil Colombia Ecuador French Guiana Guyana Paraguay Peru Suriname Venezuela
Temperate South America: Argentina
Chile Uruguay
Total:
Number of countries reporting cases:
-a 1 13
- 4
20 7
- - - - - - 63 - 25 - 107 - 16 - - 72 35 - - - - - - - - - - 38 39 78 710 26 - 2 23 116 101 966 36 - - 52 42 18 186 46
138 121 15
2,807 1,854 122
525 305 576
45 10 11
2 74 136 44 20 120 34
60 71
149 150
- 1
68 30
2
6
4,772
22
3,877
19 18
5 - - 1,464 16 - 9 70 35 58 - - - - 16 136 8 98 10 69 187 11 - 10 - 969 17 - 1
12 7
- - - - - - - 7 -
62 63
88 19
208 17
8 16
232 137
- -
7
45 82
88 18
5
I -
- -
11 3
111 102
- -
26
-
911 525
15 II
l ABSTRACTS AND REPORTS 391
Figure 1. Annual reported poliomyelitis morbidity (per 100,000 population)
in the Americas, 1969-1984.
Table 3. Countries in the Americas having reported polio- myelitis incidences of less than 0.1 cases per 100,000
population for five or more years as of 1984.
EPI
0.01 ’ ’ ’ ’ ’ ’ ’ ’ ’ ’ ’ ’ ’ ’ ’ ’
1969 70 71 72 73 74 75 76 77 76 79 60 81 62 63 1964
YEAR
This high degree of polio control can be cred- ited primarily to steadily increasing vaccination coverage of the target populations. The use of special immunization tactics, such as national vaccination days scheduled two or three times a year, has contributed significantly to this in- creased vaccination coverage. Overall, data from reporting countries indicate that the propor- tion of children under one year old in the Americas who received three doses of polio vac- cine increased from about 34% in 1978 to 78% in 1984 (Table 4).
Anguilla
Antigua and Barbuda Bahamas
Barbados Bermuda Canada Cayman Islands Chile
Costa Rica Cuba Dominica Grenada Guadeloupe
Martinique Montserrat Panama Puerto Rico Saint Lucia St. Christopher/Nevis St. Vincent and the Grenadines Trinidad and Tobago Turks and Caicos Islands United States
Uruguay Virgin Islands (UK) Virgin Islands (US)
In the 1970s program success was measured in terms of the number of countries that had achieved the Ten-Year Health Plan goal of re- ducing the poliomyelitis incidence to less than 0.1 case per 100,000 population. From here on, however, success will be measured by the ab- sence of any disease cases due to wild poliovirus, because the high vaccination coverages already achieved in the Americas have made it feasible to think in terms of eradication. (For a more detailed account of the current campaign against poliomyelitis, see “PAHO Director announces campaign to eradicate poliomyelitis from the Americas by 1990” that appeared in our second 1985 issue. ‘)
Source: Pan American Health Organization, Poliomyelitis in the Americas, 1985, EPI Newsletter 7(3):3-6, 1985.
‘Pan American Health Organization, Bull Pan Am Health Organ 19(2):213-215, 1985.
MALARIA CHEMOPROPHYLAXIS PROBLEMS AMONG
TRAVELLERS TO ENDEMIC AREAS