Vol. 20, No. 4 December 1999
IN THIS ISSUE... • Floods in Venezuela
• Integrated Management of Childhood Ilness. “Healthy Children: Goal 2002”
• Norms and Standards in Epidemiology: Case Definitions - Diphtheria and Pertussis • News:
Floods in Venezuela
Heavy rainfall led to tragic floods and mudslides in Vene-zuela during the month of December. The meteorological phenomena involved: 1) the movement of a cloud line, pro-duced by a frontal system, on the northern coastal area of the country, 2) a high diffluence produced by an anticyclo-nic dorsal that sustained the mass ascent, and 3) the orogra-phy (coastal mountain range) where the humid air rose. As a result, the level of precipitation reached 1,207 mm between the 1st and the 18th of December, with 381 mm on the 15th of December, and 410 mm on the 16th. According to the avail-able data, the daily, monthly and yearly historical records were broken during those days. The average precipitation for a month of December was 57 mm, and the maximum pre-cipitation ever reached was 221 mm in 1985. The average yearly precipitation in Venezuela was 523 mm, and the maxi-mum ever observed was 961 mm of rain in 1951. Therefore, the level of rain was more than twice the yearly average, and 20% more than the worst floods ever registered in 48 years.
The strong rains caused landslides in the mountains that surround the capital, producing floods and alluvions accompanied by rocks and mud, dragging everything in their way and causing heavy damage in eleven states. The most affected states were Vargas, Miranda, Distrito Federal (Cara-cas), Falcón, Anzoátegui, Nueva Esparta, Zulia and Sucre. In these states, the rains produced mud slides, floods, over-flowing of rivers and dams, and the collapse of the principal channels of communication, as well as drainage and water supply networks.
The Venezuelan government, through the Civil Defense, has officially recorded 349 dead as of the 31st of December, however, technically justified estimations put the death toll at a much higher level. Information from the Ministry of Exterior Relations at the same time mentioned between 10 and 20,000 deaths. Official figures indicate a total of 419,222 people affected by the disaster, which left 85,380 people in-jured and 2,545 missing, while 81,137 dwellings were dam-aged and 26,147 completely destroyed.
The affected people were evacuated from the danger zone and relocated in shelters, which resulted in the creation of 360 shelters in 14 states, where 53,629 people have been lodged. For better surveillance and control after the disaster, Venezuelan health authorities launched a daily syndromic notification system in those shelters. The sheltered popula-tion mainly presented diarrheal, respiratory and viral symp-toms (characterized only by fever and overall discomfort).
The Venezuelan epidemiological surveillance system has also intensified the compulsory reporting of communicable diseases in the rest of the affected population and continued with the immediate reporting of diseases. The epidemiologi-cal surveillance of routinely observed diseases showed a risk of:
•
Malaria: the trend of the disease was ascending in thecountry until the disaster occurred. There is a risk of increase in the number of cases, considering risk factors such as heavy rainfall, the formation on large lakes and the displacement of population to affected areas as a consequence of the disaster.
•
Dengue: this disease was present in all the Venezuelanstates, with a majority of cases in Zulia, Falcón and Dis-trito Federal, which were all affected by the rains.
•
Cholera: the State of Sucre presented the majority ofcases before the December events, with more than 60% of all cases, and was one of the most affected by the disaster.
•
Leptospirosis: the majority of cases has beenconcen-trated in Distrito Federal, Aragua and Carabobo for the last 5 years.
•
Yellow fever: there are 3 sources of yellow feverIn view of the above, the Ministry of Health is main-taining a strict surveillance of these diseases in order to avoid outbreaks or epidemics, which could start and spread easily due to the country’s sanitary conditions after the disaster. It should be noted that health situation rooms have been crea-ted in the most affeccrea-ted states as well as at the national level, to facilitate the flow of information necessary for decision-making.
In terms of environmental sanitation, close to 600,000 people were left without water supply at the national level, making the lack of safe water the most important problem in Venezuela after the disaster. The most critical states are Var-gas and Miranda where, according to official data, at least 60% of the water supply systems were damaged.
Repairs observed so far show that Hidroven, with the support of the Ministry of the Environment and Health and Social Development, is reestablishing water supply systems at a fast pace. Indeed, a few weeks after the floods occurred, water services have been partially or totally restored in 8 of the 11 affected states, leaving a decreasing number of people without this vital service. Nevertheless, a lot remains to be done in the most affected states, where almost all installa-tions suffered important damage.
Similarly, there is concern about the level of wastewater, since a large majority of sewerage systems were damaged, which suggests that there will not be an adequate canaliza-tion system to support the water service once it is reestab-lished. Actions that are being carried out include the rees-tablishment of the sewerage and rain drainage systems, as well as the construction or rehabilitation of pumping stations for underwater outfalls.
Another emerging problem is the adequate management of solid waste, since the municipal dumps in all flooded areas remain incapacitated. As a result, the waste is creating envi-ronmental health problems and in light of the situation, a plan of action has been developed, with broad community parti-cipation, in order to minimize the health and environmental hazards (such as the presence of vectors and rodent reser-voirs of diseases). Specific actions include the superficial burial of the waste, as well as its incineration.
Health services were also severely affected in the 8 states involved in the tragedy. According to the information pro-vided by the Ministry of Health and Social Development, 29% (9/31) of hospitals and 36% (251/687) of ambulatory ser-vices were damaged in the affected areas. In the state of Vargas, the most stricken by the floods, all the hospitals and 72% of all ambulatory services were damaged, leaving the population without health services for several weeks. With great effort and the support of civil, military, national and international volunteers, the Ministry of Health was able to
provide primary care through temporary emergency posts and mobile units.
The Pan American Health Organization has closely sup-ported Venezuela since the beginning of the tragedy, through different areas of technical cooperation established with the country, and has mobilized financial and technical resources at the national and international level. In response to the disaster, PAHO/WHO is providing technical cooperation in the following areas: epidemiological surveillance, health ser-vices, environmental health, food protection, support in the coordination and management of humanitarian supply, infor-mation, education and communication.
Since the emergency situation started in Venezuela in the middle of December, PAHO/WHO has been facilitating the coordination and communication between the national institutions’ authorities and the international community, in the areas related to health. At the request of the Ministry of Health, the Organization has played a key role in coordina-ting actions and donations, in order to strengthen national efforts with international support and avoid duplication of humanitarian assistance. In the PAHO/WHO local office, a person in charge was assigned to each priority area, and experts from other countries of the Americas were mobilized, both Venezuela national employees and staff from the Orga-nization. The local office was also reinforced by administra-tors with expertise in supply management and informatics in order to ensure a more efficient flow of goods and services.
Integrated Management of Childhood Illness (IMCI)
“Healthy Children: Goal 2002”
Introduction
The new initiative “Healthy Children: Goal 2002” was officially launched on the 1 December, 1999, with the objec-tive of preventing the death of 100,000 children under 5 years of age in the Americas by the year 2002, through the use of the Integrated Management of Childhood Illness (IMCI) strat-egy elaborated by the Pan American Health Organization/ World Health Organization and the United Nations Children’s Fund.
The latest United Nations population and mortality figures, corresponding to the 5-year period 1995-2000, esti-mate that over half a million deaths will occur each year in children under 5 in the countries of the Region of the Amer-icas with more than 10,000 births annually. According to PAHO/WHO estimates, over one-third of those deaths are due to communicable diseases, which shows that these causes are still a significant child health problem.
Although mortality from communicable diseases has declined in all the countries in recent decades, the percentage of decline has varied. Developing countries that have achieved lower infant mortality rates (IMR) are those that have shown a steeper decline in mortality from communicable diseases.
Similarly, in all countries of the Region of the Americas that currently have an estimated IMR of under 30 per 1,000 live births, communicable diseases represent at most 25% and generally less than 20% of deaths in children under 5. In contrast, in all the countries with an IMR of over 30 per 1,000 live births, communicable diseases account for over 30% of deaths and are, in some countries, the cause of over half of all deaths in children under 5.
Prospects for Reducing Mortality from
Commu-nicable Diseases in Children
The possibility of reducing mortality from communica-ble diseases is confirmed by the significant decline in the number of deaths from these causes observed in many coun-tries of the world, and of the Region of the Americas in partic-ular. Numerous factors related, on the one hand, to the gener-al development of populations and the improvement of their living conditions and, on the other, to the availability of ef-fective interventions for the prevention, early diagnosis, and successful treatment of communicable diseases in children, played a role in that drop.
If the rate of decline in mortality from communicable dis-eases were to increase, based on the declines observed, 100,000 deaths of children under 5 could be prevented just in terms of deaths from those diseases. In the 14 countries of the Region of the Americas where the IMR still exceeds 30 per 1,000 live births, 95,000 deaths would be prevented, which would increase the drop in mortality due to communicable diseases to the level reached by other countries when they had a similar IMR.
Interventions
Reaching this goal would be contingent upon a series of factors that involve more than adequate prevention, early diagnosis, and treatment measures. However, these specific interventions can have a significant impact, particularly on mortality, for the following reasons:
•
Access to basic measures to prevent diarrheal diseases, such as exclusive breast-feeding during the first 4 to 6 months of life, the use of potable water, and better food hygiene, can help reduce the incidence and severity of bouts of diarrhea, even in population groups that still do not have access to running water, with the consequent impact of reducing deaths from this cause.•
Access to and use of oral rehydratation therapy (ORT) to manage diarrhea in the home, and knowledge of the warning signs for seeking early consultation can reduce the number of cases of serious dehydratation and the number of deaths from diarrhea.•
Proper management of diarrhea by health workers, in-cluding adequate case evaluation, classification, and management, can help prevent cases from worsening, cure them more quickly and effectively, and reduce the number of deaths from this cause in children.•
Early detection and proper treatment of bouts of acute respiratory infections (ARI), particularly pneumonia, also help bring down the frequency of severe cases and pre-vent a large number of deaths from this cause.treat-ment, will help reduce the incidence of septicemia and meningitis associated with these causes, with the con-sequent impact on mortality from these illnesses.
The examples cited above, which refer only to the pre-vention and proper management of diarrhea and ARI, are very important since these illnesses are the cause of 80 to 90% of deaths from communicable diseases in children under 5. Controlling other illnesses and health problems, including vaccine-preventable diseases (measles, diphtheria, whoo-ping cough, tuberculous meningitis) or malnutrition, will also help to reduce the number of deaths in childhood.
In order to reduce mortality in children under 5 in the Region of the Americas, it is essential to put this information and the care needed for the prevention, early diagnosis, and proper treatment of these health problems within the reach of the population, particularly the most vulnerable groups.
The reasons mentioned above, as well as others that contribute to the improvement of the overall health condi-tions of children under 5 and their families, are currently in-cluded in the Integrated Management of Childhood Illness (IMCI) strategy prepared by PAHO/WHO and UNICEF dur-ing the first five years of the 1990s. For this reason, the IMCI strategy is the main intervention proposed to achieve a sig-nificant reduction in the number of deaths from communi-cable diseases in children under 5.
The IMCI strategy includes a basic set of prevention, early diagnosis, and treatment measures that covers the ill-nesses and health problems that most frequently affect the health of children under 5. Moreover, the strategy not only includes actions to be carried out through the health struc-ture, but also a community component aimed at improving the capacity of families and the community to care for chil-dren at home. Thus, the IMCI strategy acts not only through palliative actions to reduce the risk children face when they become ill, but also through prevention and promotion ac-tions aimed at improving the health status of children, making them less susceptible to disease and reducing their risk of contracting those diseases.
Implementation of the IMCI strategy in a community makes it possible to:
•
Give the population access to basic measures for pre-vention, early diagnosis, and proper treatment ofchil-dren under 5, as well as information on care for chilchil-dren when they are healthy and when they are ill (including recognition of warning signs to seek early consultation outside the home), through all health workers (institu-tional and non-institu(institu-tional, public or private, etc.)
•
Include other people who participate in the care of chil-dren under 5 in the dissemination of the knowledge need-ed to improve care for children in the home. These in-clude institutional personnel (governmental and non-governmental) and volunteers, as well as the families themselves.•
Identify other health problems of mothers and families that can affect the health of children and of the commu-nity in general.Through the use of prevention, early diagnosis, and prop-er treatment of the leading causes of mortality in children under 5, IMCI is a suitable strategy to increase the rate at which mortality from communicable diseases is reduced. In addition, since one of the components of the IMCI strategy is aimed at improving child feeding practices and knowledge, including exclusive breast-feeding during the first four to six months and proper feeding thereafter, implementing the IMCI strategy can reduce the number of cases and deaths from malnutrition in children. Finally, by looking into other health problems of children and their families, the IMCI strategy can also reach more pregnant women, give them access to prena-tal check-ups, and advise them on the most appropriate place for delivery and on proper care during delivery. It thus con-tributes to the improvement of coverage and quality of peri-natal care and affects mortality from this cause, which ac-counts for a high percentage of deaths in children.
Implementation of the IMCI strategy can therefore be the main tool for achieving the desired reduction in the num-ber of deaths in childhood. Even if the drop does not reach the levels observed in other countries (which are also associ-ated with other interventions that improved the overall living conditions of the population), it is estimated that by affec-ting other causes of death of children under 5, the strategy will reduce by at least 100,000 the number of deaths of chil-dren in this age group in the Region of the Americas.
General Guidelines for Implementation
vul-nerable groups, is guaranteed access to the IMCI strategy and if knowledge and implementation of the recommenda-tions to improve the care of children during the first years of life are promoted among the population. To this end, govern-ment commitgovern-ment to this initiative and broad intersectoral participation will be required in support of the activities.
Emphasis on the most vulnerable population groups In order to have the fastest impact, it will be essential to gear implementation efforts toward areas where the most vulnerable population lives.
Bearing in mind the general characteristics of the Region of the Americas, specific plans will have to be developed and implemented for the areas with the highest mortality, both in relative (mortality rate and percentage of deaths from com-municable diseases), and absolute terms (number of deaths from communicable diseases). These population groups will certainly include more or less scattered rural populations and urban fringe populations.
The initial steps in implementing the initiative will in-clude identifying, within each country, the areas with the greatest population concentration and high infant mortality. In this first stage of identifying priority areas, different actors who could participate in the implementation effort will also be identified, and available data will be adjusted in order to have an adequate baseline for monitoring and evaluating the proposed goal.
Identification of higher priority areas for immediate im-plementation of the IMCI strategy will not preclude develop-ment and execution of activities in other areas of each coun-try. Implementation of the IMCI strategy in areas with lower mortality will have the additional advantage of increasing the areas available for training and the number of people avail-able to support the implementation processes in areas with fewer resources.
Preparation of local plans of operations for implementation The design of plans of operation will include, among others, the following activities essential for implementation of the IMCI strategy:
•
Training of all persons involved in child health care to implement the IMCI strategy, both at the institutional and non-institutional levels. This will include not only health workers in charge of children’s health care (insti-tutional, non-insti(insti-tutional, volunteers), but also otherpersonnel involved in caring for children under 5, in-cluding day-care teachers and assistants, community food kitchen workers, social workers, etc.
•
On-going provision of essential supplies for treatment, especially drugs, including oral rehydration salts, vac-cines, basic antibiotics, and malaria pills.•
Regular supervision of trained staff to support the effec-tive implementation of the IMCI strategy.•
Provision of Information, education, and communication to broadly disseminate the knowledge, skills, and prac-tices that improve the health status of children and con-tribute to disease prevention, early detection of warning signs, and seeking care from the appropriate personnel.•
Continuous monitoring and periodic evaluation of ac-tivities and results to promptly identify problems, and design and implement appropriate solutions.Coordination and Participation
Given the importance of the task to be carried out and the various factors involved in achieving the proposed goal, internal and external coordination mechanisms will be estab-lished to strengthen the different efforts towards better child health already under way.
In this regard, coordination with other units, programs, and divisions will be strengthened, including not only those that control disease and health problems but also those that promote conditions favorable to health. This includes efforts aimed at promoting and generating healthy spaces, work in educational institutions to achieve healthy schools, and ac-tions designed to improve sanitary condiac-tions and reduce the risk of disease transmission, among others.
Ties will be strengthened for joint work at the country level between the health and education sectors, in order to achieve the active participation of children and adolescents in the activities that will help improve the health status of children under 5.
At the regional and national levels, closer ties with uni-versities and scientific associations will be forged in order to produce an environment favorable to the implementation of the IMCI strategy and to support its gradual incorporation into teaching. This will be directed not only at undergraduate and graduate health worker education but also at other per-sonnel that participates in actions related to caring for chil-dren and families, such as social workers, educators, etc.
Taking advantage of the experience gained in the coun-tries in incorporating the IMCI strategy within health sector reform processes, coordination with other care sectors, such as social security and private health care, will be also pro-moted in order to help quickly increase the population’s ac-cess to the IMCI strategy.
Steps to Be Taken
Achieving universal access of the population to the IMCI strategy and thus preventing deaths in childhood will require joint efforts among the different governmental and non-governmental sectors, as well as a call for broad partici-pation from the entire population in order to dedicate the efforts and resources of the entire community to children. PAHO/WHO, in coordinating this effort, will support the countries in developing general and specific intervention plans aimed at incorporating the IMCI strategy as a basic tool for child health care throughout the health structure, and in establishing the coordination ties needed to expand its implementation, through community personnel to reach the community.
Would you like to access
the largest and most authoritative
source of health information for the Americas?
http://www.paho.org/English/SHAhttp://www.paho.org/Spanish/SHA
Health Analysis:
Risks of dying and income inequalities
Death is the event of higher social cost and continues to constitute a fundamental element in the health situation analysis of populations. Mortality rates are not only an in-dicator of the magnitude of this event, but also an inin-dicator of the absolute risk of dying, by cause, and for the age group, population and time that are considered. As a result, it is not surprising that the effect and impact of socioeco-nomic inequalities on the mortality of the population remain an area of attention in the study of socioeconomic health inequalities.
Much empirical evidence has established the direct re-lationship between socioeconomic inequality and mortali-ty, and enriched the discussion on the matter of equity in health. It is generally considered that the level of economic development is a determinant of the health situation in a defined space-population and as such, it is assumed that the risk of dying is a condition—and mortality a result -dependent on the quantity of available resources for social investment. From the methodological standpoint, this im-plies observing the health phenomenon in the population, i.e., mortality, at the various levels of a hierarchical socio-economic scale.
In line with this methodological approach, this article presents a summary of mortality trends in the Americas be-tween 1980 and 1994, in two opposite and differentiated age
groups: children under 1 year of age and adult from 45 to 64 years, in relation to a hierarchical socioeconomic scale con-structed with the values of the 1995 per capita Gross National Product (GNP) of the countries and territories of the Region, and previously published by PAHO/1 (Table 1). By means of the mortality ratio, i.e., an indicator of the relative risk of dy-ing, the ecological approach incorporates an analytical dimen-sion that contrasts different causes of death in the study of mortality trends in the Americas.
Income inequalities and risk of dying in infancy
Infant mortality presents a sustained downward trend in all the countries and territories of the Americas. In the last 50 years this trend has represented, in general, a reduction of 300% in the infant mortality rate in each of the five groups of countries classified by their level of economic income. The slope of the decline slows down from the threshold value of 40-45 deaths per 1,000 live births. The dispersion of this indi-cator—given by the interquartile range–in every group of eco-nomic income is being reduced progressively, which suggests an increase in the homogeneity between groups, i.e., a reduc-tion of the inequalities in the risk of dying in infancy within each group (Figure 1). By contrast, the presence of inequali-ties in infant mortality among the groups of economic income persists in time; for example, the ratio of the median values of infant mortality rate for group I and group V has remained constant in the last three 5-year periods: 6.3 (72.5/11.5), 6.1
Table 1: Classification of the countries of the Americas by economic income. Distribution of the 1995 per capita Gross National Product (GNP)
by a hierarchical clustering analysis
GNP per capita 1995 (current US$)
GROUP Median Minimum Maximum COUNTRIES AND TERRITORIES
I 19,380 10,600 26,980 Aruba, Bahamas, Bermuda, Canada, United States, Cayman Islands, British Virgin Islands.
II 6,560 5,170 8,030 Anguilla, Antigua & Barbuda, Netherlands Antilles, Argentina, Barbados, Turks and Caicos Islands, Puerto Rico, Saint Kitts & Nevis, Uruguay.
III 3,020 2,610 4,160 Belize, Brazil, Costa Rica, Chile, Dominica, Granada, Mexico, Panama, Saint Lucia, Trinidad & Tobago, Venezuela.
IV 1,566 1,340 2,310 Colombia, Cuba, Ecuador, El Salvador, Guatemala, Jamaica, Paraguay, Peru, Dominican Republic, Saint Vincent & The Grenadines.
V 595 250 880 Bolivia, Guyana, Haiti, Honduras, Nicaragua, Suriname.
Source: Special Program for Health Analysis. Pan American Health Organization. 1998
(60.5/10.0) and 6.1 (49.0/8.0). This implies that a child under one year of age living in a country of Group V continues to exhibit 6 times more risk of dying before 1 year of age than another child living in a country of Group I.
Viewed broadly, infant mortality can be considered as having two major groups of contributing causes: communi-cable diseases and perinatal conditions. The impact of the first component is associated with broad changes in living conditions (safe water, sanitation, education, etc.), while the impact of the second component is more directly related to the access to high quality services and technology. A high rate of infant mortality can usually be reduced significantly first by means of interventions that address the communica-ble disease component. Subsequently, efforts to further re-duce infant mortality through interventions that address the perinatal component will have less of an impact and entail higher costs. The trend of this behavior in the Region of the Americas can be observed by means of the ratio between mortality rates from perinatal conditions and from communi-cable causes. A ratio of perinatal to communicommuni-cable causes of 1:1 implies that each component has equal weight in the in-fant mortality rate, thus indicating a higher potential for re-duction. The greater the ratio, the greater the weight of the perinatal component compared to the communicable disease component and the more dependent further efforts to reduce that rate will be on investing in high-quality technology. In the Americas, a very clear pattern can be seen in this indica-tor among income groups: the ratio of perinatal to communi-cable causes dimin-ishes—and, in fact, gets closer to 1 - as
the group of coun-tries exhibits smaller economic income, which indicates a greater relative weight of the communica-ble diseases in the higher infant mortality rates in the Region. Thus, for the 5-year period between 1990 and 1994, the medi-an value of the perinatal/communicable ratio was 14.7 in Group I, while it was 5.4 in Group II, 1.8 in Group III, 1.7 in Group IV and 1.3 in Group V (Figure 2).
On the other hand, a long-term trend is also confirmed in this indicator, i.e., the ratio of perinatal causes to communica-ble diseases causes has increased in recent decades in all the economic income groups, which confirms the significant re-duction in the infant mortality rates, especially as a result of interventions intended to reduce the communicable disease component observed through the countries of the Region in the same period. This upward trend is more clearly discer-nible in the higher-income countries, i.e., the ones that had curtailed communicable diseases as a cause of infant mortal-ity in 5-year periods. Thus, while in Group I the median value of the perinatal/communicable ratio went from 9.9 in 1980-85 to 14.7 in 1990-95, it went from 1.6 to 1.8 in Group III, and from 1.4 to 1.3 in Group V in the same 5-year periods.
Income inequalities and risk of dying in adulthood
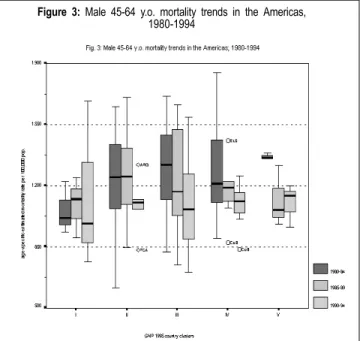
Unlike the situation with infant mortality, the trend of mortality in the 45-64 age group in the Region of the Ameri-cas shows differences by sex. In general terms, the magni-tude of mortality, and thus the risk of dying, in males of this age group (aprox. 1,200±400 per 100,000) is twice that of
Figure 1: Infant mortality trends in the Americas, 1980-1994
Source: PAHO. Health in the Americas, 1998. Vol. 1
Figure 2: Perinatal/Communicable mortality rate ratio,
under 1 year old
women (aprox. 700±200 per 100,000) in the period studied. Among males, there is no clear trend neither to the increase nor to a progressive reduction between 1980 and 1994 in any of the groups of countries: although the 5-year median val-ues tend to the decline, the ranges of its distribution tend to the increase, which somewhat stabilizes the overall trend (Fig-ure 3). In addition, the absence of a group-to-group pattern in mortality in males from 45 to 64 years is noticeable. The risk of dying is relatively similar in males of this age, re-gardless of their pertainance to a group of countries and, thus, of their per capita income. This contrasts with the mor-tality pattern observed among women from 45 to 64 years who, in addition to a confirmed moderate long-term down-ward trend within each country group—in particular Groups IV and V - display a clear gradient between groups: mortality is systematically higher in the groups of countries with smaller per capita income (Figure 4). It is possible to suggest that differences in the risk profiles by specific mortality causes, such as the relative impact of prevention measures, preva-lence of healthy habits and access to health services among others, can help explain this inequality.
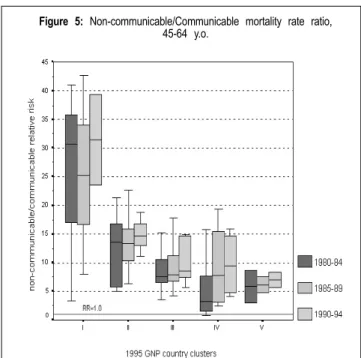
Recent decades have witnessed a kind of epidemiologi-cal polarization in the Americas, with chronic noncommuni-cable diseases becoming more prominent in mortality profiles as a result of demographic changes — especially the aging of the population - and of lifestyle changes in the various social groups. The trend of this behavior in the Region of the Americas can be observed by means of the ratio between mortality from noncommunicable causes (neoplasms and
dis-eases of the circulatory system) and communicable causes in the adult population. A ratio of noncommunicable to com-municable causes of 1:1 implies that the two components of mortality in adults have a equal weight. The higher the ratio, the greater the relative weight of the noncommunicable com-ponent and the more advanced the stage of epidemiological polarization, with the resultant implications in terms of in-vestments, service access, and opportunity for health care. As did the pattern observed in the ratio of perinatal to com-municable causes in children under 1 year of age, the ratio of noncommunicable to communicable causes for the age group 45-64 years old in both sexes in the Americas presents a gradient across groups, i.e., this indicator of relative risk de-creases as the group of countries exhibits smaller economic income, which indicates the greater relative contribution of noncommunicable diseases in adult mortality in the most developed countries of the Region. Thus, in the 5-year peri-od 1990-94, the median of the noncommunicable/communi-cable ratio in Group I was 31.5, while it was 14.8 in Group II, 8.5 in Group III, 9.4 in Group IV and 7.0 in Group V (Figure 5). On the other hand, a long-term trend is also confirmed in this indicator, i.e., the ratio of noncommunicable to com-municable causes has risen over the past few decades in all country groups, being more pronounced among lower-income countries which are precisely the ones that continue to have a larger communicable component in their adult mortality pro-file and are the ones that are reducing this component more
Figure 3: Male 45-64 y.o. mortality trends in the Americas,
1980-1994
Source: PAHO. Health in the Americas, 1998. Vol. 1
Figure 4: Female 45-64 y.o. mortality trends in the Americas,
1980-1994
Summer Courses in Epidemiology in 2000
! The Department of Epidemiology, Biostatistics, and Oc-cupational Health of McGill University will hold its 15th Annual Summer Programme in Epidemiology and Biostatis-tics from May 8 to June 30, 2000. This Program offers health professionals the opportunity to gain familiarity with the prin-ciples of epidemiology and biostatistics. The language of instruction is English. Courses may be taken for Academic Credit, Continuing Medical Education (CME) or for a Profes-sional Interest Certificate.
The May session (May 8 – June 2, 2000) includes courses in epidemiology, biostatistics, health care technolo-gy assessment, topics in clinical epidemiolotechnolo-gy, epidemiolo-gy and environmental health assessment, cancer epidemiol-ogy, clinical trials, and cardiovascular disease epidemiology.
The June session (Jun 5 - 30, 2000) includes courses on protocol development, analysis of multivariable data, in-fectious and parasitic disease epidemiology, health in devel-oping countries, pharmacoepidemiology, injury prevention (epidemiology, surveillance & policy).
For more information, contact Diane Legault, Summer Programme Coordinator, Department of Epidemiology, Bio-statistics and Occupational Health, McGill University, Pur-vis Hall, 1020 Pine Avenue West, Room 38-B, Montreal, Que-bec, Canada, H3A 1A2, Tel: (514) 3973, Fax: (514) 398-4503, email: summer@epid.lan.mcgill.ca
! The Johns Hopkins University School of Hygiene and Public Health will hold its 2000 Graduate Summer Institute of Epidemiology and Biostatistics from June 19 to July 7, 2000. A total of 25 courses will be offered, ranging in length from a week-end to three weeks:
Three-week courses
" Principles of Epidemiology " Methods in Epidemiology - A " Nutritional Epidemiology
" Applications of the Case-Control Method " Infectious Disease Epidemiology
" Epidemiologic basis for tuberculosis control " Design and Analytical Methods in Cohort Studies " Clinical Trials: Issues and Controversies
" Statistical Reasoning in Public Health I " Statistical Computing in Public Health
One-week courses
" Regression Analysis in Public Health " Survival Analysis
" Introduction to the SAS Statistical Package
" New Paradigms/New Approaches to Management of Epidemiologic Studies
" Outcomes and Effectiveness Research
" Epidemiologic Methods for Planning and Evaluating Health Services
" Molecular Biology for Cancer Epidemiology rapidly. Thus, while the noncommunicable/communicable
ratio in Group I went from 30.7 in 1980-85 to 31.5 in 1990-95, it went from 3.3 to 9.4 in Group IV, and from 5.9 to 7.0 in Group V in the same 5-year periods. The patterns of this indicator did not present significant variations by sex in this age group.
The ecological analysis presented here illustrates the gains in health achieved by the countries of the Americas with regard to the reduction of the risk of dying, particularly in infancy. At the same time, it shows the considerable socio-economic health inequalities that persist in the Region and emphasizes the importance of the mortality structure, i.e., the distribution of mortality by cause, age, and sex, in the analy-sis of health inequalities and, accordingly, in the identifica-tion of possible specific intervenidentifica-tions that can positively affect this situation .
Figure 5: Non-communicable/Communicable mortality rate ratio,
45-64 y.o.
Source: PAHO. Health in the Americas, 1998. Vol. 1
" Molecular Epidemiology of Cancer " Epidemiology of HIV/AIDS
" Introduction to the Risk Sciences and Public Policy " Teaching Epidemiology
" Tobacco Control: National and International Approaches " Analysis of Longitudinal Data
" Perinatal Epidemiology
" Epidemiology of Emerging Infections
Week-end course
" Clinical Research: An Introduction to Design and Analysis
For further information, contact: Ayesha Khan, Program Coordinator, Graduate Summer Institute of Epidemiology and Biostatistics, Department of Epidemiology, School of Hygiene and Public Health, The Johns Hopkins university, 615 N. Wolfe Street, Baltimore, MD 21205, USA. Tel: (410) 955-7158, Fax: (410) 955-0863, email: akhan@jhsph.edu, website:
www.jhsph.edu/Departments/Epi/summer.html.
!The University of Michigan School of Public Health an-nounces its 35th Graduate Summer Session in Epidemiology to be held from July 9 to 28, 2000. One and three-week courses will be offered, including topics such as: fundamen-tals of biostatistics and epidemiology, epidemiology for health practitioners, cancer, injuries, clinical trials, infectious dis-eases, pharmacoepidemiology, computer applications, epi-demiologic measures, logistic model, survival follow-up data, environmental and occupational epidemiology, behavioral modification, law, health economics, biomarkers and epide-miology, social epideepide-miology, longitudinal studies, PC-SudAAN, global health, cardiovascular epidemiology. CME Credit Available is available.
For application and information contact: Jody Gray, Grad-uate Summer Session in Epidemiology, The University of Michigan, School of Public Health, 109 Observatory St., Ann Arbor, MI 48109-2029, USA, Telephone: (734) 764-5454, Fax: (734) 764-3192, Email: umichgss@umich.edu, Website: www.sph.umich.edu/epid/GSS
! The Tenth Summer Session in Intermediate Epidemiology, sponsored by the Special Program for Health Analysis of the
Pan American Health Organization, will take place from July 10 to 28, 2000 at the College of Public Health of the University of Southern Florida in Tampa, Florida. Courses offered are: intermediate methods in epidemiology, statistics applied to epidemiology and the use of software packages, and the use of epidemiology in the programming and evaluation of health services.
Students are required to have approved training in epi-demiology. Courses will be conducted in Spanish, but parti-cipants must be able to read English. Applications must be received before May 19, 2000.
For more information and application, contact: Dr. Car-los Castillo-Salgado, Chief, Special Program for Health Ana-lysis (SHA), Pan American Health Organization, 525 Twenty-third Street, NW, Washington, DC 20037. Tel: (202) 974-3327, Fax: (202) 974-3674.
! The Eighteenth International Course in Applied Epidemi-ology, conferring diploma status recognized by the National Autonomous University of Mexico, will take place from July 3 to 28, 2000 in Mexico, D.F., under the coordination of the Department of Epidemiology of the Ministry of Health of Mexico. Courses, divided into two levels (basic and interme-diate), are designed to provide training in two broad areas: theoretical and methodological aspects of epidemiological practice, and specific subjects of applied epidemiology. They include, among others: basic and intermediate epidemiology, basic and intermediate biostatistics, epidemiological surveil-lance, Epi-Info 6.04, management of Health Services, design of research protocols, infectious disease epidemiology, so-cial and cultural factors in epidemiological research and more.
Applications must be received by June 30, 2000.
For further information, please contact: Dirección Gen-eral de Epidemiología, Francisco P. Miranda No. 177, Col. Unidad Lomas de Plateros, Delegación A. Obregón, C.P. 01480, Mexico, D.F., Mexico. Tel: 55 93 36 61, Fax: 56 51 62 86
! The Biostatistics Program of the Ohio State University will hold its Summer Program in Applied Statistical Methods from 18 to 30 June, 2000. Weekly courses include: Statistical Meth-ods and Web-based Technology in Clinical Trials, Applied Logistic Regression, Analysis of Correlated Data, Sampling of Human Populations - Sample Design and Analysis, How Statisticians Can Improve the Scientific Literature - The Sta-tistical Report and Reporting Statistics, StaSta-tistical Methods in Medical Research, Applied Survival Analysis, Statistical Methods in Human Genetics, and Categorical Data Analysis. A one-day course, Applied Regression Analysis, will also be offered.
Case definitions
Rationale for surveillance
Diphtheria is a highly contagious bacterial disease that is transmitted from person to person through close physical and respiratory contact. It can cause large epidemics in areas of low vaccination coverage. The control of diphtheria is based on the following measures: 1) primary disease preven-tion through maintenance of high vaccine coverage rates, 2) prevention of secondary transmission through rapid iden-tification and post-exposure treatment of close contacts, and 3) prevention of complications and mortality by early diag-nosis and proper disease management. Surveillance data can be used to monitor levels of coverage.
Recommended case definitions
Clinical case definition: An illness characterized by laryngi-tis or pharyngilaryngi-tis or tonsillilaryngi-tis and an adherent membrane of the tonsils, pharynx and/or nose with an average incubation period of 2-5 days.
Laboratory criteria: Isolation of bacterial agent Corynebac-terium diphtheriae from a pharyngeal swab or a fourfold rise in serum antibody (only if both serum samples were obtained before the administration of diphtheria toxoid or antitoxin), or histopathologic diagnosis of diptheria.
Case classification
Probable: A case that meets the clinical case definition. Confirmed: A probable case that is laboratory confirmed or epidemiologically linked to a laboratory confirmed case. Note: Persons with positive C. diphtheriae cultures not meet-ing the clinical case definition (asymptomatic carriers or cuta-neous diphtheria) should not be reported as probable or con-firmed diphtheria cases. Respiratory disease caused by non-toxigenic C. diphtheriae should be reported as diphtheria.
Recommended surveillance measures
•
Routine weekly reporting of case-based data of sus-pected cases from municipalities to central level. Zero re-porting should be required and validated.•
All outbreaks should be investigated immediately and lab-oratory confirmed; during an outbreak, case-based data should be collected.•
To describe the changing diphtheria epidemiology in coun-tries with low diphtheria incidence (generally wherecover-age is > 80%), additional information on cover-age group and immunization status should be collected;
•
Feedback every month to all participants of the surveil-lance system is recommended.Recommended minimum data elements
Case-based data: (i) unique identifier, (ii) date of birth, (iii)
geographic location, (iv) date of onset of symptoms, (v) date of first treatment, (vi) laboratory results with information re-garding toxigenicity, (vii) treatment type, (viii) date of each DTP-containing shot received, (ix) date of last dose, (x) out-come (alive, dead, unknown), and (xi) case classification (prob-able, confirmed, discarded)
Principal use, of data for decision-making
•
Detect and investigate outbreaks to understand the epi-demiology of diphtheria in the country, why the outbreak occurred (e.g. failure to immunize, vaccine failure, and ac-cumulation of susceptibles/waning immunity, new toxigenic strain), ensure proper case management, and implement control measures.•
Monitor case fatality rate. If high, determine cause (e.g. poor case management, lack of antibiotics or antitoxin, pa-tients not seeking timely treatment) so that corrective mea-sures can be taken.•
Monitor incidence rate to assess impact of control efforts.•
Determine age-specific incidence rate, and incidence rate by geographical area to identify risk groups and temporal trends.•
Monitor immunization coverage per geographical area to identify areas of poor performance for special vaccination campaigns.Surveillance indicators
•
% of reporting sites that report each week.•
% of reported suspected cases investigated within 3 days.•
% of cases reported with complete vaccination history re-corded.•
% of persons with clinical symptoms that had laboratory confirmation.•
% of total laboratory-confirmed cases with known source of infection.Rationale for surveillance
Pertussis (whooping cough) is a highly contagious acute bacterial disease involving the respiratory tract. It is trans-mitted by direct contact with discharges from the respiratory mucous membranes of infected persons by the airborne route. Worldwide, an estimated 20-40 million cases and 200,000 deaths occur annually. Case fatality rates in developing coun-tries can reach 15%. High routine coverage with effective vaccine is the mainstay of prevention. Surveillance data on the disease can monitor the impact of immunization programs as well as identify high-risk areas, age groups for targeted immunization, and outbreaks.
Recommended case definitions
Clinical case definition: A person with a cough lasting at least two weeks with at least one of the following:
1. Paroxysms (i.e. fits) of coughing 2. Inspiratory “whooping”
3. Post-tussive vomiting (i.e. vomiting immediately af-ter fits of coughing) and without other apparent cause. Laboratory criteria: Isolation of bacterial agent Bortadella pertussis or detection of genomic sequences by polymerase chain reaction (PCR).
Note: Direct fluorescent antibody (DFA) testing of nasopha-ryngeal secretions has been shown to have low sensitivity, and variable specificity, and should NOT be relied upon as a criterion for laboratory confirmation.
Case classification
Suspected: A case that meets the clinical case definition. Confirmed: A person with a cough that is laboratory-con-firmed or epidemiologically linked to a laboratory conlaboratory-con-firmed case.
Recommended surveillance measures
•
Routine monthly reporting of aggregated data of suspect-ed cases from municipalities to central level. Zero report-ing should be required and validated.•
All outbreaks should be investigated immediately and lab-oratory confirmed; during an outbreak, case-based data should be collected.•
To describe the changing pertussis epidemiology incoun-Pertussis (Whooping cough)
tries with low pertussis incidence (generally where cover-age is > 80%), additional information on cover-age group and immunization status should be collected;
•
Feedback every month to all participants of the surveil-lance system is recommended.Recommended minimum data elements
Aggregated data (monthly): (i) Number of confirmed cases,
(ii) number of third doses of DTP-containing vaccine admin-istered to infants, (iii) completeness/timeliness of monthly reporting.
Case-based data: (i) unique identifier, (ii) date of birth, (iii)
geographic location, (iv) date of onset of symptoms, (v) clin-ical symptoms, (vi) laboratory results, (vii) date of each DTP-containing shot received, (viii) outcome (alive, dead, un-known), and (ix) case classification (suspected, confirmed, discarded).
Principal uses of data for decision-making
•
Investigate outbreaks to understand the epidemiology ofpertussis in the country, why the outbreak occurred (e.g. failure to immunize, vaccine failure, and accumulation of susceptibles/ waning immunity) and to ensure proper case management.
•
Monitor case fatality rate. If high, determine cause (e.g. poor case management, lack of antibiotics or supportive care, patients not seeking timely treatment).•
Monitor incidence rate to assess impact of control efforts.•
Determine age-specific incidence rate, and incidence rate by geographical area to identify risk groups.Surveillance indicators
•
% of reporting sites that report each month.•
% of reported suspected cases investigated within 3 days.•
% of cases reported with complete vaccination history re-corded.•
% of persons with clinical symptoms that had laboratory confirmation.Basic Indicators 1999: mortality differences by gender
* lab: latest available biennium ... data not available - Zero magnitude
Source: PAHO, Health Situation in the Americas. Basic Indicators 1999. Special Program for Health Analysis, PAHO/SHA/99.01
general mortality rates (all causes) mortality rates from communicable diseases mortality rates from malignant neoplasms
(100.000 pop) (1990-94, lab) (100.000 pop) (1990-94, lab) (100.000 pop) (1990-94, lab)
males females total male females total male females
Country estim. adjust. estim. adjust. estim. adjust. estim. adjust. estim. adjust. estim. adjust. estim. adjust. estim. adjust.
Anguilla 733.1 ... 809.8 ... 103.6 ... 104.0 ... 103.2 ... 124.3 ... 119.6 ... 129.0 ... Antigua & Barbuda ... ... ... ... ... ... ... ... ... ... ... ... ... ... ... ... Argentina 904.9 881.0 708.0 559.1 53.1 47.9 58.3 57.6 48.2 39.9 157.3 138.2 176.8 171.9 139.5 112.3
Aruba ... ... ... ... ... ... ... ... ... ... ... ... ... ... ... ...
Bahamas, The 624.6 848.6 471.5 570.8 35.6 47.1 41.4 61.7 30.0 36.5 84.6 119.1 95.1 153.0 74.4 94.4 Barbados 915.5 829.8 890.7 574.5 46.8 34.1 50.6 44.3 43.3 26.4 179.5 138.1 195.8 174.2 164.7 116.6
Belize ... ... ... ... ... ... ... ... ... ... ... ... ... ... ... ... Bermuda ... ... ... ... ... ... ... ... ... ... ... ... ... ... ... ... Bolivia 1,069.3 1,331.2 957.2 1,138.4 ... ... ... ... ... ... ... ... ... ... ... ... Brazil 829.9 1,116.1 575.7 741.8 81.7 110.7 94.9 131.6 68.7 91.4 93.8 125.1 102.0 145.3 86.0 108.6 Canada 755.5 601.0 641.5 400.6 30.3 20.0 29.7 22.6 31.0 18.0 199.4 143.2 219.6 172.9 179.7 120.2 Cayman Islands ... ... ... ... ... ... ... ... ... ... ... ... ... ... ... ...
Chile 587.8 720.8 497.6 502.1 62.6 69.7 65.2 81.2 60.3 60.1 118.3 132.7 116.7 147.5 120.7 123.4 Colombia 650.8 884.2 518.0 682.5 44.1 64.1 44.3 69.1 45.2 60.0 82.8 122.6 73.5 120.8 96.8 129.2 Costa Rica 401.1 591.0 313.0 428.4 23.9 32.6 26.4 37.9 21.3 27.7 75.0 112.9 80.4 129.9 69.5 98.0 Cuba 734.3 669.2 597.4 519.0 46.4 42.9 52.5 49.6 40.4 36.3 127.6 114.1 146.0 132.3 109.1 97.0 Dominica ... ... ... ... ... ... ... ... ... ... ... ... ... ... ... ... Dominican Republic 605.1 840.9 482.7 668.5 ... ... ... ... ... ... ... ... ... ... ... ...
Ecuador 680.3 895.1 547.9 689.3 115.9 144.0 123.7 159.1 107.8 129.6 78.3 107.0 73.3 106.5 83.5 109.3 El Salvador 737.2 935.7 525.5 655.4 80.4 106.5 87.4 120.2 74.2 93.4 58.0 76.6 44.5 61.2 74.2 94.1 French Guiana ... ... ... ... ... ... ... ... ... ... ... ... ... ... ... ... Grenada ... ... ... ... ... ... ... ... ... ... ... ... ... ... ... ... Guadeloupe ... ... ... ... ... ... ... ... ... ... ... ... ... ... ... ... Guatemala 667.0 924.5 542.1 739.6 ... ... ... ... ... ... ... ... ... ... ... ...
Guyana ... ... ... ... ... ... ... ... ... ... ... ... ... ... ... ... Haiti 1,214.4 1,516.3 1,075.5 1,342.7 ... ... ... ... ... ... ... ... ... ... ... ... Honduras 605.1 843.3 482.7 671.6 ... ... ... ... ... ... ... ... ... ... ... ... Jamaica ... ... ... ... ... ... ... ... ... ... ... ... ... ... ... ... Martinique ... ... ... ... ... ... ... ... ... ... ... ... ... ... ... ... Mexico 582.9 817.9 441.7 596.3 63.5 83.6 68.8 93.0 58.3 74.9 57.1 82.9 54.0 84.5 60.3 82.1
Montserrat ... ... ... ... ... ... ... ... ... ... ... ... ... ... ... ... Netherlands Antilles ... ... ... ... ... ... ... ... ... ... ... ... ... ... ... ... Nicaragua 729.0 978.6 578.2 770.4 148.8 161.9 162.1 177.2 135.6 146.8 58.6 93.4 48.5 80.6 69.7 108.8 Panama 579.6 733.1 455.0 564.7 ... ... ... ... ... ... ... ... ... ... ... ... Paraguay 640.5 957.2 573.0 762.6 86.6 111.6 94.0 125.6 79.0 98.4 75.1 107.6 67.7 107.5 82.9 108.1 Peru 745.3 973.5 607.7 767.1 ... ... ... ... ... ... ... ... ... ... ... ...
Puerto Rico 910.2 805.3 594.2 465.4 52.3 42.3 59.4 50.7 45.7 34.8 123.1 101.1 149.3 127.9 98.4 78.5 Saint Kitts & Nevis ... ... ... ... ... ... ... ... ... ... ... ... ... ... ... ... Saint Lucia ... ... ... ... ... ... ... ... ... ... ... ... ... ... ... ... Saint Vincent
& the Grenadines ... ... ... ... ... ... ... ... ... ... ... ... ... ... ... ... Suriname 538.5 766.4 440.8 541.4 62.9 76.1 64.3 85.5 60.4 67.3 63.8 88.7 61.3 94.8 66.1 83.9 Trinidad & Tobago 761.0 912.1 632.9 695.9 42.0 47.4 46.5 54.5 37.5 40.4 92.2 106.8 95.2 115.8 89.3 99.5
Basic Indicators 1999: mortality differences by gender (cont.)
* lab: latest available biennium ... data not available - Zero magnitude
Source: PAHO, Health Situation in the Americas. Basic Indicators 1999. Special Program for Health Analysis, PAHO/SHA/99.01
mortality rates from diseases of the circulatory system mortality rates from external causes
(100.000 pop) (1990-94, lab) (100.000 pop) (1990-94, lab)
total male females total male females
Country estim. adjust. estim. adjust. estim. adjust. estim. adjust. estim. adjust. estim. adjust.
Anguilla 370.3 ... 317.2 ... 423.0 ... 31.1 ... 36.4 ... 25.8 ...
Antigua & Barbuda ... ... ... ... ... ... ... ... ... ... ... ...
Argentina 361.2 302.6 385.8 369.5 337.1 246.1 55.6 51.6 81.5 77.6 29.8 26.9
Aruba ... ... ... ... ... ... ... ... ... ... ... ...
Bahamas, The 144.8 207.8 140.7 226.2 149.1 191.3 57.1 59.2 95.9 99.6 19.5 21.2 Barbados 375.8 258.9 334.7 290.9 413.9 236.2 40.3 36.6 59.0 56.5 23.0 18.3
Belize ... ... ... ... ... ... ... ... ... ... ... ...
Bermuda ... ... ... ... ... ... ... ... ... ... ... ...
Bolivia ... ... ... ... ... ... ... ... ... ... ... ...
Brazil 245.3 334.2 263.9 381.0 227.6 293.3 85.4 86.8 141.2 141.7 30.0 32.8 Canada 275.1 180.4 285.2 217.1 265.2 149.0 46.4 39.7 64.4 57.1 28.6 22.6
Cayman Islands ... ... ... ... ... ... ... ... ... ... ... ...
Chile 163.9 184.4 161.6 208.5 167.2 165.6 65.3 68.5 102.0 109.9 27.8 28.8 Colombia 178.8 276.2 167.0 284.8 198.9 272.2 151.3 131.5 241.7 210.3 43.5 45.0 Costa Rica 111.2 173.4 117.5 195.5 104.7 153.3 41.5 46.9 63.8 71.6 18.3 21.7 Cuba 282.7 241.4 299.0 263.9 266.0 219.8 79.3 72.3 102.9 93.5 55.1 50.2
Dominica ... ... ... ... ... ... ... ... ... ... ... ...
Dominican Republic ... ... ... ... ... ... ... ... ... ... ... ...
Ecuador 141.7 197.6 143.4 211.3 140.0 185.4 88.3 85.6 130.2 130.9 35.8 38.4 El Salvador 141.2 190.2 139.1 192.7 146.5 190.7 121.6 125.4 198.7 209.8 41.8 43.8
French Guiana ... ... ... ... ... ... ... ... ... ... ... ...
Grenada ... ... ... ... ... ... ... ... ... ... ... ...
Guadeloupe ... ... ... ... ... ... ... ... ... ... ... ...
Guatemala ... ... ... ... ... ... ... ... ... ... ... ...
Guyana ... ... ... ... ... ... ... ... ... ... ... ...
Haiti ... ... ... ... ... ... ... ... ... ... ... ...
Honduras ... ... ... ... ... ... ... ... ... ... ... ...
Jamaica ... ... ... ... ... ... ... ... ... ... ... ...
Martinique ... ... ... ... ... ... ... ... ... ... ... ...
Mexico 111.4 168.7 110.0 178.1 113.1 160.2 72.7 79.3 118.7 131.1 26.7 30.2
Montserrat ... ... ... ... ... ... ... ... ... ... ... ...
Netherlands Antilles ... ... ... ... ... ... ... ... ... ... ... ...
Nicaragua 143.5 242.3 139.2 246.5 149.3 240.7 88.2 103.7 136.6 161.4 38.4 45.9
Panama ... ... ... ... ... ... ... ... ... ... ... ...
Paraguay 246.3 379.8 247.0 413.3 246.1 352.8 53.9 58.4 79.8 89.6 26.9 28.6
Peru ... ... ... ... ... ... ... ... ... ... ... ...
Puerto Rico 244.6 191.6 268.5 225.6 222.3 162.2 69.2 64.2 118.8 112.3 22.7 20.3 Saint Kitts & Nevis ... ... ... ... ... ... ... ... ... ... ... ...
Saint Lucia ... ... ... ... ... ... ... ... ... ... ... ...
Saint Vincent
& the Grenadines ... ... ... ... ... ... ... ... ... ... ... ... Suriname 173.1 254.9 174.8 285.9 166.6 223.6 55.9 60.1 84.0 92.7 27.3 29.5 Trinidad & Tobago ... 318.9 ... 345.7 ... 293.8 ... 55.3 ... 84.2 ... 26.9
Turks & Caicos Islands 179.6 218.0 161.9 237.7 196.6 220.5 56.6 62.2 81.0 88.5 32.8 37.0 United States of America 363.5 228.5 354.3 264.3 372.3 197.7 57.6 50.8 83.8 75.5 32.2 26.7
Uruguay ... ... ... ... ... ... ... ... ... ... ... ...
Venezuela 147.8 257.6 155.8 293.0 139.7 225.5 70.8 73.6 114.4 117.9 25.6 28.4 Virgin Islands (UK) ... 430.3 ... 467.4 ... 409.6 ... 91.1 ... 149.4 ... 32.4
PAHO's Epidemiological Bulletin is published quarterly in English and Spanish.
Catalogued and indexed by the United States National Library of Medicine
Printed on acid-free paper. PAN AMERICAN HEALTH ORGANIZATION
Pan American Sanitary Bureau, Regional Office of the
WORLD HEALTH ORGANIZATION
525 Twenty-Third Street, N.W. Washington, DC 20037
Internet: http://www.paho.org/english/sha/beindexe.htm
Basic Indicators 1999: selected demographic and morbidity indicators
(a) 1993 registered figure; (b) 1997 registered figure; (c) 1996 registered figure; (d) 1995 registered figure; (e) 1986 registered figure; (f) 1998 registered figure; (g) 1982 registered figure; (h) 1983 registered figure; (i) 1989 registered figure.
total crude measles incidence tuberculosis cholera malaria malaria malaria dengue AIDS annual
population birth rate registered confirmed incidence rate reported risk areas API reported confirmed incidence rate
(thousands) (1.000 pop) deaths cases (100.000 pop) 1997 cases population (1.000 pop) cases cases (1.000.000 pop)
Country 1999 1999 1998 1998 total BK+ 1998 (%) 1998 1998 1998 1998 1996
Anguilla 8 18.4 a - - … … - - - - … …
Antigua & Barbuda 67 21.6 b - - … … - - - - 4 204.9
Argentina 36,577 19.5 58 9,469 34.6 14.9 12 0.7 1.1 269 822 62.1
Aruba 98 16.9 c … … … … - - - - … 14.8
Bahamas, The 301 21.9 - - 30.9 19.8 - - - - 336 1,321.6
Barbados 269 12.5 - - 2.3 1.9 - - - - 852 498.1
Belize 235 29.6 - - 39.7 21.4 28 63.8 23.9 1,986 8 173.5
Bermuda 64 13.9 c - - … … - - - - … 273.8
Bolivia 8,142 32.1 1 1,004 126.7 83.1 466 36.8 284.2 41,882 49 3.7
Brazil 167,988 19.9 … 2,135 51.1 26.7 2,571 4.2 146.0 449,002 530,578 110.2
Canada 30,857 11.3 … 12 6.2 1.5 - - - - … 31.0
Cayman Islands 37 15.6 d - - … … - - - - 2 86.6
Chile 15,019 19.2 - 4 26.5 10.4 24 - - - … 25.5
Colombia 41,564 23.6 - 104 21.7 16.4 442 35.2 56.9 115,794 63,182 30.1
Costa Rica 3,933 22.7 - 20 17.7 16.2 - 24.1 19.9 1,701 2,628 58.0
Cuba 11,160 12.5 - - 13.0 6.9 - - - - … 9.0
Dominica 71 19.1 c - - 8.5 7.0 - - - - 1 207.6
Dominican Republic 8,364 23.2 - 10 69.2 33.1 - 4.2 20.2 644 3,049 51.5
Ecuador 12,411 24.6 - - 79.2 61.4 3,724 21.1 - 31,261 4,606 5.7
El Salvador 6,154 26.7 - - 28.0 14.5 8 37.4 - 1,182 1,688 72.0
French Guiana 174 25.2 e … … … … - 9.2 217.1 3,462 534 410.1
Grenada 93 21.3 c - - 4.3 2.2 - - - - 4 189.6
Guadeloupe 450 16.2 … 2 … … … - - - … 169.4
Guatemala 11,090 35.6 - 1 28.2 19.8 5,970 26.8 34.8 34,843 4,655 81.5
Guyana 855 20.7 - - 48.1 12.4 - 52.5 86.7 38,917 42 171.8
Haiti 8,087 31.3 … 3 136.8 74.3 - 93.2 - 34,449 … 119.3a
Honduras 6,316 32.1 - - 67.4 26.4 306 72.9 11.3 37,751 22,218 168.2
Jamaica 2,560 21.2 - 1 4.7 2.8 - - - - 1,551 211.6
Martinique 392 14.2 … … … … - - - - 44 105.4
Mexico 97,365 23.6 - - 25.0 10.7 71 35.6 3.4 13,983 23,639 27.0
Montserrat 11 16.8 e - - … … - - - - … 78.7b
Netherlands Antilles 215 16.4 … … … … - - - - 9 367.5c
Nicaragua 4,938 34.8 - - 64.5 38.4 1,437 31.5 12.2 14,507 13,592 5.9
Panama 2,812 21.6 - - 39.2 21.7 - 11.0 - 1,039 2,717 87.0
Paraguay 5,358 30.6 - 70 39.2 17.6 - 39.8 1.7 2,048 … 14.9
Peru 25,230 24.0 … 10 172.6 112.8 41,717 44.8 54.7 175,135 988 48.9
Puerto Rico 3,839 17.0 … … 6.8 3.3 - - - - 17,241 514.7
Saint Kitts & Nevis 39 19.7 c - - … … - - - - … 145.0
Saint Lucia 152 25.2 d - - 10.3 7.5 - - - - 1 94.0
Saint Vincent
& the Grenadines 113 18.0 f - - … … - - - - 88 160.6
Suriname 415 19.7 - - 16.2 6.2 - 11.3 255.7 11,653 1,151 46.8c
Trinidad & Tobago 1,289 13.9 - - 21.1 4.0 - - - 12 3,120 317.7
Turks & Caicos Islands 16 25.5 g - - … … - - - - … 315.0a
United States of America 276,028 13.6 … 89 7.3 2.5 15 - - 884 … 207.9
Uruguay 3,313 17.3 - 2 22.0 13.1 - - - 48.7
Venezuela 23,706 24.1 - 4 26.3 14.2 313 2.6 24.7 16,807 37,586 29.9
Virgin Islands (UK) 21 19.5 i - - 15.0 … - - - - 1 75.8