CLAUDIO RAMOS CONTI claudio_conti@hotmail.com PhD in Business Administration from Fundação Getulio Vargas, Escola Brasileira de Administração Pública e de Empresas – Rio de Janeiro – RJ, Brazil
RAFAEL GOLDSZMIDT rafael.goldszmidt@fgv.br Professor at Fundação Getulio Vargas, Escola Brasileira de Administração Pública e de Empresas – Rio de Janeiro – RJ, Brazil
FLÁVIO CARVALHO DE VASCONCELOS lavio.vasconcelos@fgv.br Dean of Fundação Getulio Vargas, Escola Brasileira de Administração Pública e de Empresas - Rio de Janeiro – RJ, Brazil
FORUM
Submitted 03.02.2014. Approved 08.19.2014
This article is co-authored by a member of RAE’s Scientiic Editorial Board and was evaluated by double blind review process with impartality and independence. Scientiic Editors: Gleen Morgan and Maria José Tonelli
STRATEGIES FOR SUPERIOR
PERFORMANCE IN RECESSIONS: PRO OR
COUNTER-CYCLICAL?
Estratégias para desempenho superior em recessões: pro ou contra-cíclicas?
Estrategias para el desempeño superior en las recesiones: ¿pro o contra cíclicas?
ABSTRACT
Recessions are recurring events in which most irms sufer severe impacts while others are less afected or may even prosper. Strategic management has made little progress in understanding such performan-ce diferenperforman-ces. In a sperforman-cenario of decreased demand, intensiied competition, and higher unperforman-certainty, most irms try to survive by pro-cyclically cutting costs and investments. But irms could take advantage of undervalued resources in the market to counter-cyclically invest in new business opportunities to overtake competitors. We survey Brazilian irms in various industries about the 2008-2009 recession and analyze data using PLS-SEM. We ind that while most irms pro-cyclically reduce costs and invest-ments in recessions, a counter-cyclical strategy of investing in opportunities created by changes in the market enables superior performance. Most successful are irms with a propensity to recognize opportu-nities, an entrepreneurial orientation to invest, and the lexibility to eiciently implement investments.
KEYWORDS | Recession, cycle, opportunity, entrepreneurship, lexibility.
RESUMO
Recessões são eventos recorrentes nos quais a maioria das empresas sofre impactos severos enquan-to outras são menos afetadas ou até prosperam. A gestão estratégica tem feienquan-to pouco progresso para entender tais diferenças de desempenho. Em um cenário de demanda reduzida, competição aumen-tada e muitas incertezas, a maioria das empresas tenta sobreviver cortando custos e investimentos, de maneira pró-cíclica. Mas as empresas poderiam aproveitar os recursos subestimados no mercado para investir, contra-ciclicamente, em novas oportunidades de negócios para superar a concorrência. Pesquisamos empresas brasileiras em várias indústrias sobre a recessão de 2008-2009 e analisa-mos dados usando PLS-SEM. Descobrianalisa-mos que enquanto a maioria das empresas reduzem custos e investimento pró-ciclicamente durante as recessões, uma estratégia contra-cíclica de investir em oportunidades criadas pelas mudanças no mercado possibilitam desempenho superior. Firmas com propensão a reconhecer oportunidades, com orientação empresarial para investir e com flexibilidade para implementar os investimentos de modo eficiente são as mais bem sucedidas.
PALAVRAS-CHAVE | Recessão, ciclo, oportunidade, empreendedorismo, flexibilidade.
RESUMEN
Las recesiones son eventos recurrentes en los cuales la mayoría de las empresas sufre impactos se-veros mientras que otras son menos afectadas o incluso, hasta prosperan. La gestión estratégica ha tenido poco progreso para entender tales diferencias de desempeño. En un escenario de demanda reducida, mayor competencia y muchas incertidumbres, la mayoría de las empresas intenta sobrevi-vir recortando costos e inversiones, de manera procíclica. Pero las empresas podrían aprovechar los recursos subestimados en el mercado para invertir, contra cíclicamente, en nuevas oportunidades de negocios para superar a la competencia. Estudiamos empresas brasileñas en varias industrias sobre la recesión de 2008-2009 y analizamos datos usando PLS-SEM. Descubrimos que mientras que la mayoría de las empresas reducen costos e inversiones procíclicamente durante las recesions, una estrategia contra cíclica de inversor en oportunidades creadas por los cambios en el mercado hacen posible un desempeño mayor. Firmas con propensión a reconocer oportunidades, con orientación empresarial para invertir y con flexibilidad para implementar las inversiones de modo eficiente son las más exitosas.
PALABRAS CLAVE | Recesión, ciclo, oportunidad, emprendedorismo, flexibilidad.
INTRODUCTION
Today’s global marketplace is characterized by increased tur-bulence due to major shocks such as the 2008-2009 recession (Li & Tallman, 2011; Ma, Yiu, & Zhou, 2014), one of the most important global economic events since the Great Depression (Crotty, 2009). Economists have thoroughly studied recessions (Zarnowitz, 1985), mostly from a macroeconomic perspective to understand their causes and consequences for countries. Be-yond countries, however, recessions can transform industries (Latham & Braun, 2011) and severely afect the performance or even survival of irms (Srinivasan, Rangaswamy, & Lilien, 2005). Most importantly, while most irms sufer severe impacts from recessions, others are less afected or even prosper (Gulati, Nohria, & Wohlgezogen, 2010), and the reasons for such hetero-geneity in irm performance are not fully understood (Geroski & Gregg, 1997). Particularly within strategic management, there has been little investigation on how irms should deal with re-cessions (Bromiley, Navarro, & Sottile, 2008).
Recessions create a scenario of decreased demand, in-tensiied competition, and high uncertainty (Grewal & Tansu-haj, 2001) that leads most irms to reduce their operations in a pro-cyclical strategy of cutting costs and investments in various functional areas such as production, marketing, and research and development (Tellis & Tellis, 2009). Nevertheless, several scholars contend that irms can take advantage of lower prices to counter-cyclically invest during recessions (Navarro, Bromi-ley, & Sottile, 2010). For instance, Procter and Gamble, Chevro-let, and Camel lourished during the Great Depression because they advertised heavily (Srinivasan et al., 2005).
The purpose of this research is to examine pro-cyclical and counter-cyclical strategies during recessions and their ef-fects on performance. More speciically, we aim to: (i) investi-gate whether most irms pursue pro-cyclical or counter-cyclical strategies during recessions; (ii) identify irms’ characteristics and capabilities that foster the use of counter-cyclical strat-egies; and (iii) verify whether pro-cyclical or counter-cyclical strategies enable irms superior performance during recessions.
The impact of recessions on irm performance and how irms should react is an unexplored research stream (Bromiley et al., 2008;Mascarenhas & Aaker, 1989). Our study contrib-utes to the strategy literature in business cycle management. In particular, we answer a call for scholars to analyze how irms absorb and react to economic downturns (Kaytaz & Gul, 2014; Latham & Braun, 2008) and to examine organizational factors (Srinivasan, Lilien, & Sridhar, 2011) that inluence investment preferences in these environments (Zona, 2012). To our knowl-edge, this is the irst study to propose an integrative model with
several variables to investigate recessions and to empirically test it with survey data.
RECESSIONS AND THEIR
CONSEQUENCES TO FIRMS
Recessions are recurring events, part of business cycles com-prising periods of economic growth followed by periods of eco-nomic contraction (Latham & Braun, 2011). They are technical-ly deined as a decrease in real gross domestic product for two consecutive quarters (Claessens & Kose, 2009). Economic the-ories try to explain recessions, but with a country-wide perspec-tive. In this paper, we take a business approach and focus on three important consequences of recessions for irms – change in demand patterns, increase in competition, and increase in uncertainty.
First, recessions reduce the demand for most irms’ prod-ucts and services (Srinivasan et al., 2011). This is due to lower employment, which leads to decreased disposable income, and it is also due to decreased consumption conidence created by job insecurity (Dutt & Padmanabhan, 2011; Hall, 2005). Besides this general demand reduction, recessions alter demand pat-terns (Mansoor & Jalal, 2011) – the variability in customer popu-lations and preferences. The impact of recessions varies among consumers of diferent income levels, with lower income class-es sufering the most (Grusky, Western, & Wimer, 2011). The im-pact of recessions also varies among industries and segments. Consumers become more price conscious (Hampson & McGol-drick, 2013) and “downtrade” to cheaper items and stores (Ang, Leong, & Kotler, 2000;Kaytaz & Gul, 2014) or substitutes (Dutt & Padmanabhan, 2011;Srinivasan et al., 2011). Discretionary such as leisure and luxury items sufer more (Mansoor & Jalal, 2011; Zurawicki & Braidot, 2005), while necessities such as housing and health care are less afected (Dutt & Padmanabhan, 2011; Kamakura & Du, 2012). The demand for durable goods is par-ticularly reduced due to credit restrictions (Gertler, Kiyotaki, & Queralto, 2012) and the possibility of purchase postponement (Lamey, Deleersnyder, Steenkamp, & Dekimpe, 2012).
Third, recessions generate uncertainties (Latham & Braun, 2008;Parnell, Dent, O’Regan, & Hughes, 2012). Although the di-rection of changes in demand and pricing is mostly known, their levels and timing are diicult to predict. As recessions vary great-ly in amplitude and duration (Zarnowitz, 1985), irms cannot fore-see for how long consumers will postpone purchases or for how long competitors will resist the pressure to cut prices.
THEORY DEVELOPMENT AND
HYPOTHESES
The scenario of decreased demand, intensiied competition, and high uncertainty brings severe negative impacts to most irms, while some others are less afected or even prosper in re-cessions (Dutt & Padmanabhan, 2011). We study the strategies, pro-cyclical or counter-cyclical, that enable irms to have supe-rior performance. By supesupe-rior performance, we mean either of two situations. In the irst case, a irm may be less afected than competitors by the negative impacts of the recessionary envi-ronment, even though its absolute performance may decline compared to the moment prior to the recession. In the second case, which is less common, a irm may beneit from the reces-sion more than competitors and even improve its performance. Especially in severe cases, recessions represent risk to the survival of irms (Parnell et al., 2012). Forced to rethink their strat-egies (Geroski & Gregg, 1997), irms may choose various cours-es of action. They may adopt a pro-cyclical behavior of cutting costs and expenditures, react with a counter-cyclical behavior of increasing investments, respond with a combination of both, or even do nothing while waiting for macroeconomic recovery.
Most irms adopt a pro-cyclical strategy. During reces-sions, proits decrease (Beaver, 2002), bank credit is restrict-ed or more expensive (Ivashina & Scharfstein, 2010), and equity markets typically “dry up” (Latham & Braun, 2008). With limited funding, irms have to reduce costs, bypass projects, and cut in-vestments (Campello, Graham, & Harvey, 2010).
But several irms realize that just surviving the storm is not enough and adopt a counter-cyclical strategy. Despite an undeniable need to preserve short-term cash, irms must in-vest for future growth, as some long-term industry trajectories and related irm objectives should not change (Dye, Sibony, & Viguerie, 2009). Firms can take advantage of undervalued as-sets in the market (Mascarenhas & Aaker, 1989) to develop new business opportunities, diferentiate themselves, and overtake competitors (Nunes, Drèze, & Han, 2010). They are able to both achieve immediate returns (Srinivasan et al., 2005) and prepare for long-term success (Franke & John, 2011).
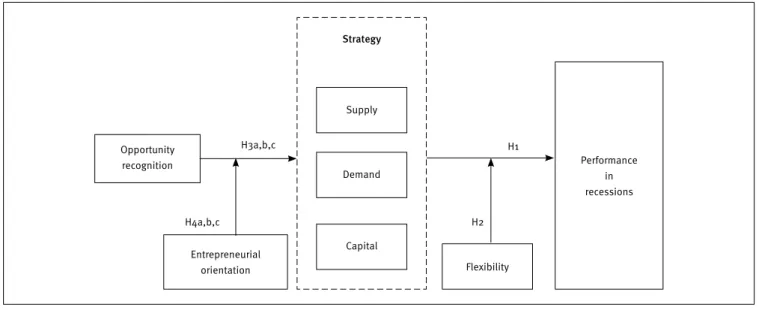
While several authors recommend counter-cyclical strat-egies, empirical tests of their beneits are limited. Reviews of prior studies are provided by Latham & Braun (2011), who note a positive link between counter-cyclical strategies and perfor-mance, and by Srinivasan et al (2011), who warn about mixed re-sults. Most importantly, except for Navarro et al (2010) and Gu-lati et al (2010), the majority of research on the topic limits the analysis to one area: marketing, R&D or capital expenditures. To ill this gap, we assess irms’ concomitant responses to reces-sions in various types of investments. Adjusting the model pro-posed by Navarro et al (2010), we study the cyclical strategies pursued by irms grouped in three independent areas(supply, demand, and capital). Our framework of hypotheses is shown in Figure 1.
Figure 1.
Framework of hypotheses
Strategy
Supply
H1
H2 H3a,b,c
H4a,b,c
Demand
Capital
Flexibility Opportunity
recognition
Entrepreneurial orientation
Supply strategies
In line with Navarro et al (2010), our supply dimension compris-es three subdimensions: staing, production, and purchasing.
Firms’ staing strategies tend to be pro-cyclical. Mislead-ing expectations durMislead-ing economic expansions (Gore, 2010) result in overestimated sales, production, and staing needs. Entering recessions, irms try to stabilize their inances through eiciency measures such as employee layofs (Latham & Braun, 2011). Nev-ertheless, a counter-cyclical staing strategy may be beneicial in two ways. First, layof avoidance boosts the usually low employ-ee morale during downturns. Instead of worrying about job secu-rity (Gulati et al., 2010), employees can focus on their tasks and maintain productivity. They also tend to continue with the irm during recovery, which prevents rehiring at increased costs. Sec-ond, high recession unemployment (Hall, 2005) raises the pool of qualiied labor available in the market, which allows hiring at lower wages (Mascarenhas & Aaker, 1989).
Firms’ production strategies are also usually pro-cyclical. As demand decreases, sales latten, and inished goods inven-tories pile up during recessions, irms cut production (Zarnow-itz, 1985). However, a counter-cyclical strategy of increasing pro-duction may be recommended to avoid product shortages that prevent revenue opportunities and market share gain at the be-ginning of the recovery (Bromiley et al., 2008). Furthermore, during recessions, irms can take advantage of lower labor costs and lower materials costs.
Firms’ purchasing strategies are usually also pro-cycli-cal. Appropriate inventory levels depend on accurate sales fore-casts. Again, misleading expectations during upturns lead to overestimated sales and production forecasts, resulting in an increase in raw materials purchases. Thus, irms enter reces-sions with excess inventories (Navarro et al., 2010). As reces-sions reduce demand and sales, irms cut production and use fewer materials, so inventories increase even further. Then, the intuitive measure is to reduce purchases to lower invento-ry costs (Apaydin, 2011). Nonetheless, a counter-cyclical strate-gy of raising purchases during recessions may be recommend-ed. Firms can take advantage of lower prices and possibly better credit terms from suppliers to guarantee inputs for which there may be shortages after suppliers cut production.
Demand strategies
Our demand dimension comprises marketing investments, pric-ing, and R&D investments. To Navarro et al (2010), we added the R&D subdimension since investments in marketing and in R&D usually accompany one another (Gulati et al., 2010).
Academic research has documented marketing pro-cy-clical behavior. Advertising and promotions increase during ex-pansions and are cut in contractions (Srinivasan et al., 2011), when most irms view them as dispensable luxuries (Apaydin, 2011). However, several authors recommend that companies fo-cus on marketing and be more aggressive to capitalize on the changes in consumption patterns during downturns (Ang et al., 2000). As most irms reduce their advertising in recessions, me-dia owners ofer lower rates. Hence, irms that advertise achieve higher return on their investments (Apaydin, 2011).
Firms’ cyclical behavior in pricing is less clear than in marketing investments. There is pressure for irms to cut pric-es (Ang et al., 2000; Kamakura & Du, 2012) to keep sales level, since as a result of lower income, consumers reduce consump-tion, become more price conscious, and “downtrade” to cheap-er items. Nevcheap-ertheless, empirical evidence indicates that most irms do not change (Geroski & Gregg, 1997) or even raise prices during recessions (Lamey et al., 2012; Mansoor & Jalal, 2011). A recommendation for cyclical strategy is also complex. Econom-ic theory suggests that irms respond to reduced demand by lowering prices. But a marketing perspective warns that pricing cuts may reduce brand equity and hinder long-term positioning (Latham & Braun, 2011). Moreover, consumers will expect lower prices to continue after economic recovery, which would reduce long-run revenues (Apaydin, 2011).
The pro-cyclical innovation behaviors (Lamey et al., 2012) and R&D (Latham & Braun, 2011) have been documented by ac-ademic research. Pressed to control costs to maintain liquidity during recessions, irms reduce R&D programs, thereby increas-ing short-term cash low (Srinivasan et al., 2011). However, irms that add new features and upgrade their products to match new demand patterns in downturns may perform better (Apaydin, 2011). Furthermore, irms can take advantage of lower costs during recessions to reach higher returns on their R&D invest-ments (Gulati et al., 2010).
Capital strategies
Our capital dimension comprises credit policy, capital expen-ditures in ixed assets, and acquisitions. From Navarro et al (2010), we have dropped the capital inancing subdimension, as those authors obtained high cross-loadings for it in their fac-tor analysis.
pay-ment terms (Ang et al., 2000). To keep sales at a reasonable lev-el, irms usually succumb to customers’ pressures and expand their credit (Mascarenhas & Aaker, 1989). However, during re-cessions, irms should carefully monitor customers’ perfor-mances and adjust credit policies, accelerating collections and tightening credit terms to reduce the risk of nonpayment (Dye et al., 2009).
Firms’ pro-cyclical patterns of expenditures in ixed as-sets are observed by the capital investment literature (Navar-ro et al., 2010). Geroski & Gregg (1997) report that investment in plants and equipment usually falls markedly in recessions, more than investment in intangibles (like marketing and R&D). Similarly, Latham & Braun (2011) mention that irms often sell assets to stabilize their inances. Nonetheless, this pro-cycli-cal pattern can lead to overinvestments and consequent excess capacity during the upturn, followed by exaggerated cuts and undercapacity in recessions (Apaydin, 2011). On the contrary, irms could take advantage of lower prices during recessions to invest in property, plants, and equipment in order to guaran-tee adequate capacity and modern equipment; this would help them ofer superior products and gain market share both in the recovery (Bromiley et al., 2008) and during the downturn (Gula-ti et al., 2010).
Acquisitions are most likely pro-cyclical (Geroski & Gregg, 1997), as irms tend to buy during expansions and sell during re-cessions. Recession-driven changes in market structure (Hamp-son & McGoldrick, 2013) may alter assets relevance and value, making many of them available for sale in a irm’s businesses portfolio. As irms try to preserve cash, divestitures are more common than acquisitions (Latham & Braun, 2011). Comple-menting this rationale from the opposite perspective, it is dii-cult for a potential acquirer to convince its management of the viability of acquisitions, given the low growth projections for target irms (Navarro et al., 2010). However, counter-cyclical ac-quisitions in recessions may be a better idea, as prices tend to be lower for two reasons. First, as irms in inancial trouble put parts of their businesses for sale (Campello et al., 2010), the number of takeover candidates increases (Franke & John, 2011), reducing prices. Second, potential acquirers have less cash available, decreasing the likelihood of overpayment for target irms (Ma et al., 2014), a problem that is common in upturns. Therefore, irms that counter-cyclically make acquisitions during recessions tend to beneit from a lower price-to-value rate (Bro-miley et al., 2008).
In sum, during recessions, irms can take advantage of higher availability of qualiied resources at lower prices to make counter-cyclical investments in supply-, demand-, and capi-tal-related areas. Hence, we ofer the following hypothesis:
H1: Counter-cyclical strategies of increased investments in supply-, demand-, and capital-related areas during reces-sions lead to superior change in performance.
The moderating efect of lexibility
The success of counter-cyclical investments in recessions de-pends on irms’ capabilities. We argue that lexibility helps irms eiciently implement counter-cyclical strategies that enable su-perior performance.
Flexibility is deined as a irm’s ability to rapidly change its policies and procedures to adapt to changes in the environ-ment that bring uncertainty and signiicantly impact perfor-mance (Aaker & Mascarenhas, 1984;Rowe & Wright 1997). We believe in a strong it between lexibility and recessionary envi-ronments, as recessions bring changes, uncertainty, and insta-bility (Grewal & Tansuhaj, 2001; Ma et al., 2014), a context that demands lexibility.
Recessions change demand patterns, behavior, and rel-ative power of competitors and suppliers, as well as the in-dustry’s regulative environment. Opportunities that arise for counter-cyclical investments are related to this new market structure that requires adaptations in products, resources, and processes.
In mild recessions, changes in market structure are limited, and exploitation of opportunities probably requires no more than switching focus among segments. Operational lexibility to adjust production schedules and product mix is useful and usually suicient for implementation of the new, counter-cyclical strategy.
In severe recessions, market changes are deeper, and exploitation of opportunities requires diferent resources. But new resource acquisition or development are restricted by low-er availability of cash and time constraints. Thus, strategic lex-ibility becomes important for quick relocation of resources from their original departments and adaptation to new purposes (Wang, 2008) and also for efective coordination of this new re-source coniguration (Zhou & Wu, 2010). This way, the irm can eiciently implement the new, counter-cyclical strategy and ex-periment with new products (McGrath, 1999) to reach other con-sumers.
In sum, operational, strategic, and structural lexibility al-low changes in irms’ products, resources, and processes. Thus, the more a irm is lexible, the more eicient is the implementa-tion of investments in supply-, demand-, and capital-related ar-eas to improve performance. Hence, we ofer the following hy-pothesis:
H2: Flexibility moderates the relationship between strategy and performance such that increased lexibility strengthens the positive efect of a counter-cyclical strategy of invest-ments on the change in performance during recessions.
Despite the advantages of investments during reces-sions, only a few irms adopt this counter-cyclical strategy. We claim that two irm characteristics increase their probability of counter-cyclically investing – opportunity recognition and entre-preneurial orientation.
The efect of opportunity recognition
Diferent irms follow diferent strategies during recessions, partly because they difer in the extent to which they view reces-sions as threats or opportunities (Latham & Braun, 2011). These diferent views depend mostly on how employees it informa-tion received into their cognitive structures to interpret the en-vironment (Plambeck & Weber, 2010). Similar to Srinivasan et al (2005), we deine opportunity recognition in recessions as a irm’s propensity to create or recognize opportunities arising from the recession.
In the recessionary context of uncertainty, opportunities are not obvious to everyone (McGrath, 1999). A propensity to recognize opportunities is a consequence of employees having a mindset to sense and capture beneits from changes in the environment (McGrath & MacMillan, 2000). Only alert individu-als can identify when and where new knowledge can be applied to create feasible goods and services (Ireland, Hitt, & Sirmon, 2003). And only those irms that perceive these opportunities ind interesting projects that are worth investing in. Hence, we ofer the following hypothesis:
H3: Opportunity recognition in recessions increases irms’ use of counter-cyclical strategies of investments in sup-ply- (H3a), demand- (H3b), and capital-related (H3c) areas during recessions.
The efect of entrepreneurial orientation
A second characteristic of irms that may increase their prob-ability of counter-cyclically investing during a recession is
en-trepreneurial orientation (EO). Enen-trepreneurial concepts it the recessionary environment, as they are usually associated with disruptions in the economy (Hill & Mudambi, 2010), such as those created by recessions.
Srinivasan et al (2005) suggest that irms vary not only in the extent to which they see opportunities within these disrup-tions, but also in their ability to capitalize on a perceived op-portunity. We argue that this ability depends on a willingness to act, part of a irm’s EO in its three dimensions. The proactive-ness dimension is essential because if a irm is not proactive, it will not take action to exploit the opportunity. An entrepreneur-ial irm anticipates future needs (Lumpkin & Dess, 1996) and moves ahead quickly, even with incomplete information (Green, Covin, & Slevin, 2008).
The innovativeness dimension is important because if the irm does not favor creative change, an integral part of inno-vativeness, it will not take the necessary steps to exploit the op-portunity (Ireland et al., 2003). Entrepreneurs creatively engage with the opportunities presented by the changing environment (Gupta, MacMillan, & Surie, 2004).
Finally, the risk-taking dimension is fundamental be-cause if the irm does not have risk-taking propensity, it will not invest in opportunities, whose outcomes are always asso-ciated with uncertainty and risky returns. The uncertainty of re-cessions increases risk aversion (Muurlink, Wilkinson, Peetz, & Townsend, 2012), but in an entrepreneur’s cognition, risk con-cerns are overruled by opportunity recognition (Wright, Hoskis-son, Busenitz, & Dial, 2000).
Thus, the more a irm is entrepreneurially oriented, the more it will be willing to counter-cyclically invest to seize these opportu-nities. All those arguments hold for supply-, demand-, and capi-tal-related areas. Hence, we ofer the following hypotheses:
H4: Entrepreneurial orientation moderates the relationship between opportunity recognition and strategy in recessions such that increased entrepreneurial orientation strength-ens the positive efect of opportunity recognition on irms’ adoption of counter-cyclical strategies of investing in sup-ply- (H4a), demand- (H4b), and capital-related (H4c) areas during recessions.
METHOD
the fourth quarter of 2008; but most irms recovered by the sec-ond quarter of 2009 (Galveas, 2009; Pochman, 2009), which al-lowed for good comparisons by the time of our survey.
Our sample includes firms of various sizes and from various industries. Data were collected from a survey in 2011-2012 directed to finance or planning managers of pub-licly traded firms. The questionnaire was developed in Por-tuguese, the native language of the respondents, with five-point, Likert-type questions selected from several validated scales. To prevent common method bias, we have spread the
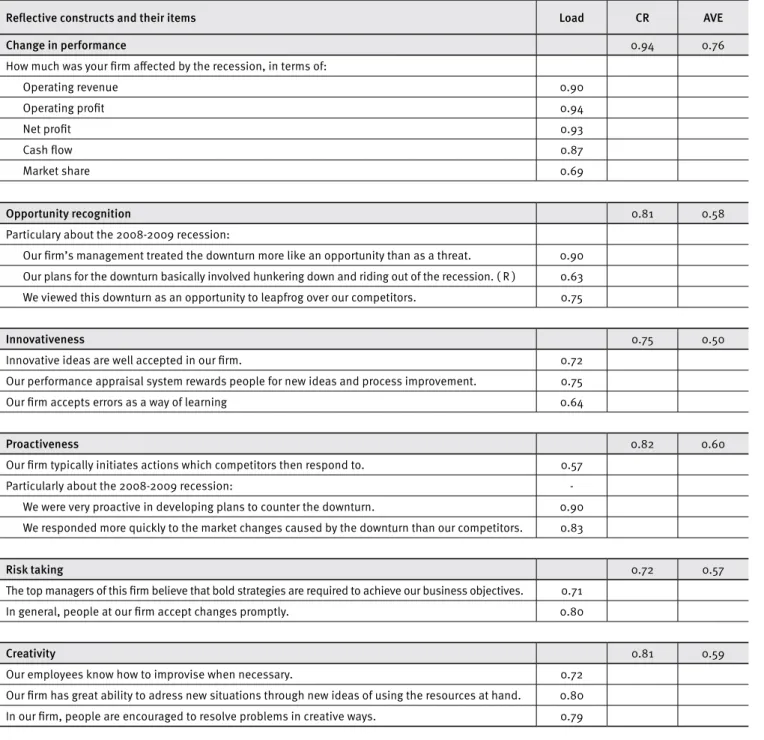
items that measure a same construct throughout the ques-tionnaire and included reverse-coded items (Podsakoff, MacKenzie, & Podsakoff, 2012). Moreover, our hypotheses include moderation effects, which are not affected by com-mon method variance (Siemsen, Roth, & Oliveira, 2010). The questionnaire was discussed with executives and pretested with executive MBA students who typically had 10 years of experience. All respondents received explanations about the research purpose and confidentiality of answers. Question-naire items are shown in Table 1.
Table 1.
Measurement items and indices of the relective constructs
Relective constructs and their items Load CR AVE
Change in performance 0.94 0.76
How much was your irm afected by the recession, in terms of:
Operating revenue 0.90
Operating proit 0.94
Net proit 0.93
Cash low 0.87
Market share 0.69
Opportunity recognition 0.81 0.58
Particulary about the 2008-2009 recession:
Our irm’s management treated the downturn more like an opportunity than as a threat. 0.90 Our plans for the downturn basically involved hunkering down and riding out of the recession. ( R ) 0.63 We viewed this downturn as an opportunity to leapfrog over our competitors. 0.75
Innovativeness 0.75 0.50
Innovative ideas are well accepted in our irm. 0.72
Our performance appraisal system rewards people for new ideas and process improvement. 0.75
Our irm accepts errors as a way of learning 0.64
Proactiveness 0.82 0.60
Our irm typically initiates actions which competitors then respond to. 0.57
Particularly about the 2008-2009 recession:
-We were very proactive in developing plans to counter the downturn. 0.90 We responded more quickly to the market changes caused by the downturn than our competitors. 0.83
Risk taking 0.72 0.57
The top managers of this irm believe that bold strategies are required to achieve our business objectives. 0.71 In general, people at our irm accept changes promptly. 0.80
Creativity 0.81 0.59
Our employees know how to improvise when necessary. 0.72 Our irm has great ability to adress new situations through new ideas of using the resources at hand. 0.80 In our irm, people are encouraged to resolve problems in creative ways. 0.79
Relective constructs and their items Load CR AVE
Spontaneity 0.76 0.62
In our irm, actions are always carefully planned before execution. ( R ) 0.71 To respond to unexpected events, our irm encourages balance between established plans and lexibility. 0.85
Operational lexibility 0.79 0.56
Our irm’s structure has high ixed costs, wich hinders changes. ( R ) 0.57 In responding to changes in the business environment, our strategy emphasys lexibility...
in the allocation of production resources to manufacture a broad range of products or services. 0.82 in the design of products or services to support a broad range of applications. 0.82
Strategic lexibility 0.78 0.55
In responding to changes in the business environment, our irm...
is able to reconigure its organizational resources to support diferent strategies. 0.74 has diiculties in repositioning products or services to target diverse market segments. ( R ) 0.70 In responding to changes in the business environment, our strategy emphasizes lexibility...
in the allocation of marketing resources to market a broad range of products or services. 0.78
Structural lexibility 0.75 0.61
Our employees are capable of performing diferent activities. 0.90 In our irm, employees do not have autonomy to change the way they organize their activities. ( R ) 0.64
Supply strategy 0.90 0.74
What was the strategy adopted by your irm with regard to the following topics?
In the total number of employees 0.80
In the production of goods or service oferings 0.89
In the purchases of materials for those products and services 0.89
Demand strategy 0.81 0.60
What was the strategy adopted by your irm with regard to the following topics?
In research and development invstiments 0.89
In marketing investments 0.89
In product prices, on average 0.48
Capital strategy 0.77 0.53
What was the strategy adopted by your irm with regard to the following topics?
In the ease of credit ofered to clients 0.71
In ixed assets investments 0.80
In investments in other irms 0.68
( R ): Item is reverse coded. CR: Composite reliability. AVE: Average variance extracted.
All algorithm calculations based on path weighting scheme.
Measures and instrument
Our study has four dependent variables. The irst is the change in performance during the recession (CHPERF), measured with ive indicators that together represent both the short-term and long-term perspectives: cash low, market share, operating revenue, operating proit, and net proit. Respondents were asked to se-lect, from a ive-point Likert-type scale, how each of the ive in-dicators was afected by the recession. We have decided to use subjective measures, as they preserve conidentiality of respon-dents and facilitate comparisons across multiple industries (Gru-ber, Heinemann, Brettel, & Hungeling, 2010). They have also been widely used (Venaik, Midgley, & Devinney, 2005) and tend to have high convergent validity with objective measures (Worren, Moore, & Cardona, 2002), available only for some of our irms.
The other three dependent variables are the strategies in supply-, demand-, and capital-related areas followed by irms during recession. Most items were selected and adapted from Navarro et al (2010) and one item was created based on Gu-lati et al’s (2010) indings. Respondents were asked to evalu-ate whether irms, in an attempt to cope with the recession, in-creased or dein-creased investments in each of the three areas’ subdimensions.
Our study has four independent variables. Opportunity recognition in recession (OPP) was measured using three items selected from Srinivasan et al (2005). Entrepreneurial orienta-tion (EO) was measured in three dimensions with 10 items se-lected from Anderson, Covin, & Slevin (2009) and Srinivasan et al (2005) and adapted to our context of crisis. Both question-naires were developed based on the well-recognized scale by Covin & Slevin (1989). Flexibility (FLEX) was measured with 12 items for its three dimensions. Ten items were selected and adapted from Zhou & Wu (2010), Nadkarni & Narayanan (2007), and Verdú-Jover, Lloréns-Montes, & García-Morales (2006). The other two items were created based on theory. Cyclical strate-gy (STRAT) was created as a composite index of its three areas.
We control irm size, age, inancial slack, and industry. For performance testing, we also control exports, opportunity recognition, and improvisation capability. These variables were indicated in prior studies as important in recessions or situa-tions of change.
RESULTS
Our preliminary data analysis did not ind abnormal patterns of answers. Our inal sample comprises 111 usable question-naires, which passes the minimum sample criteria as proposed
by Hair, Ringle, & Sarstedt (2011) for partial least squares (PLS), the method of analysis we have selected. Harman’s single-fac-tor test (Podsakof & Organ, 1986) has indicated that common method bias was limited.
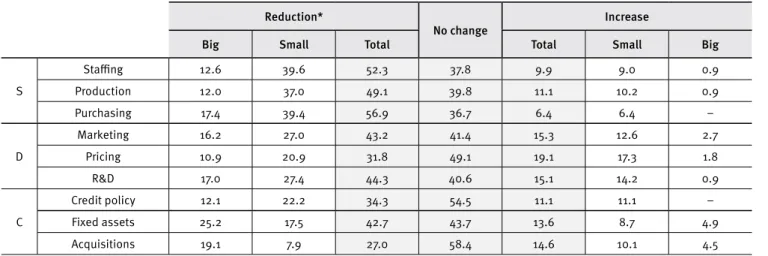
We have developed distinct sets of analyses to address our objectives. First, to investigate whether most irms pursue pro- or counter-cyclical strategies during recessions, we looked at the percentages of answers, as shown in Table 2. Our results in-dicate that the majority pursued a pro-cyclical strategy of reduc-tions in supply-related areas, particularly decreasing purchases (56.9% of respondents) and cutting personnel (52.3%), but also reducing production (49.1%). In all three cases, reductions were small. Regarding demand, reduction was the predominant behav-ior in R&D (44.3%) and marketing (43.2%) investments, while no change was the most common behavior in pricing (49.1%). None-theless, among those irms that did change prices, a higher per-centage reduced (31.8%) rather than increased (19.1%) prices. Again, reductions were small in all three cases.
In capital-related areas, no change was the prevailing behavior, particularly in acquisitions (58.4%) and credit policy (54.5%), but also in ixed assets (43.7%), although pro-cyclical reductions in ixed assets were also reported by several irms (42.7%). Among those irms that changed strategies, a higher percentage reduced rather than increased investments in all three capital-related areas. Reductions were small in credit poli-cy to clients, but large for ixed assets and acquisitions.
Few irms adopted counter-cyclical strategies during the recession. In general, investments were small increases in de-mand-related areas, most commonly in the form of a price in-crease. Firms that adopted counter-cyclical moves share partic-ular characteristics and capabilities, which we discuss next.
Measurement model
All irst-order constructs in our model were measured by relective indicators, whose details are shown in Tables 1 and 3. Indicators have good reliability (Tsang, 2002), particularly considering early stages of theory development (Hair et al., 2011; Hulland, 1999); this is true except for the pricing indicator, kept for conceptual relevance (Schotter & Beamish, 2013) and consistency with Navarro et al (2010). Constructs have adequate reliability (composite reliabilities higher than 0.70) and discriminant validity, as the average variances extracted are higher than squared correlations between constructs (Crossland & Hambrick, 2011; Fornell & Larcker, 1981).
Table 2.
Strategy adopted by Brazilian irms – % of usable answers
Reduction*
No change
Increase
Big Small Total Total Small Big
S
Staing 12.6 39.6 52.3 37.8 9.9 9.0 0.9
Production 12.0 37.0 49.1 39.8 11.1 10.2 0.9
Purchasing 17.4 39.4 56.9 36.7 6.4 6.4 –
D
Marketing 16.2 27.0 43.2 41.4 15.3 12.6 2.7
Pricing 10.9 20.9 31.8 49.1 19.1 17.3 1.8
R&D 17.0 27.4 44.3 40.6 15.1 14.2 0.9
C
Credit policy 12.1 22.2 34.3 54.5 11.1 11.1 –
Fixed assets 25.2 17.5 42.7 43.7 13.6 8.7 4.9
Acquisitions 19.1 7.9 27.0 58.4 14.6 10.1 4.5
* Can be either a reduction in investments, or the case of lay-ofs, sale of assets, or divestitures.
Table 3.
Descriptive statistics and correlations
Variables Mean SD 1 2 3 4 5 6 7 8 9 10 11 12 13 14
1 Change in performance R 2.19 0.79 0.87 2 Opportunity recognition R 3.20 0.77 0.36 0.76 3 Entrepreneurial orientation F 3.38 0.61 0.11 0.30 n/a 4 Innovativeness R 3.51 0.81 0.14 0.20 n/a 0.71 5 Proactiveness R 3.30 0.74 0.01 0.32 n/a 0.36 0.78 6 Risk-taking propensity R 3.34 0.85 0.09 0.18 n/a 0.35 0.38 0.75 7 Flexibility F 3.34 0.60 0.03 0.35 0.62 0.45 0.48 0.46 n/a 8 Structural lexibility R 3.57 0.86 0.10 0.10 0.33 0.32 0.07 0.34 n/a 0.78 9 Strategic lexibility R 3.32 0.79 0.15 0.28 0.56 0.43 0.52 0.34 n/a 0.15 0.74 10 Operational lexibility R 3.12 0.86 0.03 0.36 0.45 0.26 0.46 0.32 n/a 0.18 0.48 0.75 11 Strategy F 2.56 0.60 0.55 0.33 0.03 0.02 0.00 0.04 0.03 -0.11 0.17 0.02 n/a 12 Supply R 2.42 0.73 0.60 0.19 0.06 0.09 -0.01 0.05 0.03 0.12 0.20 -0.00 n/a 0.86 13 Demand R 2.62 0.74 0.43 0.38 0.08 0.01 0.10 0.08 0.09 -0.06 0.21 0.07 n/a 0.54 0.78 14 Capital R 2.64 0.72 0.34 0.25 -0.07 -0.05 -0.09 -0.03 -0.05 -0.10 0.00 -0.01 n/a 0.49 0.55 0.73
Note: Square roots of AVEs in the diagonal, correlations of-diagonal. R = Relective construct; F = Formative construct.
SD = Standard deviation.
Second-order constructs strategy, entrepreneurial orientation, improvisation capability, and lexibility, shown in Tables 3 and 4, were measured by formative indicators. Signiicant t-values and high coeicients suggest that indicators suiciently contribute to forming their constructs. Variance inlation factors lower than 3 indicate that multicollinearity is not a problem (Gruber et al., 2010).
Table 4.
Measurement indices of formative constructs
Formative constructs Weight* t-value** VIF***
Entrepreneural orientation 1.24
Innovativeness 0.41 6.81 +++
Proactiveness 0.59 9.22 +++
Risk taking 0.29 6.25 +++
Improvisation capability 1.13
Creativity 0.77 12.35 +++
Spontaneity 0.42 6.09 +++
Flexibility 1.22
Operational lexibility 0.55 8.79 +++
Strategy lexibility 0.54 8.97 +++
Structural lexibility 0.18 2.47 ++
Strategy 1.58
Supply 0.53 13.64 +++
Demand 0.37 14.04 +++
Capital 0.30 10.52 +++
* Algorithm calculations based on path weighting scheme.
** All calculations based on bootstrapping with 1,000 samples or more and individual sign changes. ***Average variance inlation factor.
+ signiicant at 10%. ++ signiicant at 5%. +++ signiicant at 1%.
Structural model results
Unlike covariance-based SEM, PLS-SEM does not rely on it indi-ces (such as chi-square) that compare observed and predicted covariance matrices (Hair et al., 2011; Hulland, 1999). PLS-SEM models are instead evaluated based on variance explained indi-ces such as R2, as well as the value and signiicance of measure-ment and path coeicients (Ringle et al., 2012).
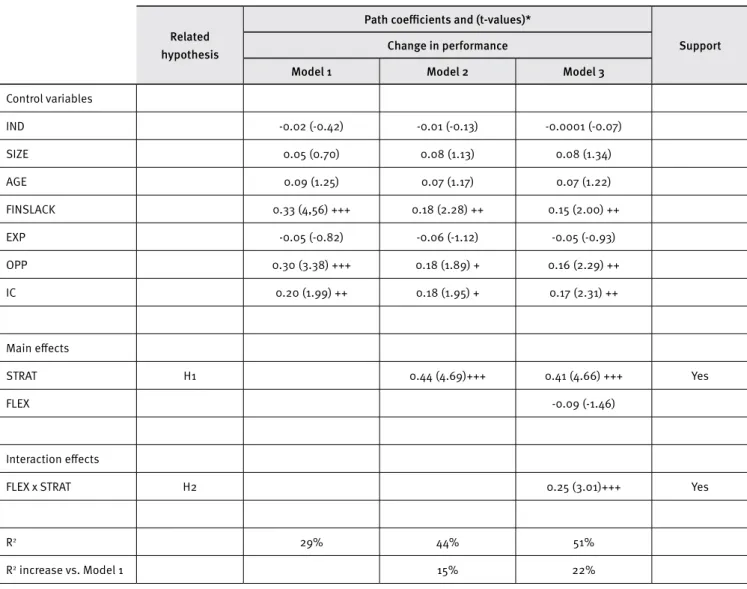
We have divided our results into two analysis sets. The irst, shown in Table 5, addresses the inluence of cyclical strategies on the change in performance. Model 1 shows the direct efect of control variables as our starting point. Model 2 adds the direct efects of all independent variables. Strategy
Table 5.
Results of the PLS structural model analysis - dependent variable: change in performance
Related hypothesis
Path coeicients and (t-values)*
Support Change in performance
Model 1 Model 2 Model 3
Control variables
IND -0.02 (-0.42) -0.01 (-0.13) -0.0001 (-0.07)
SIZE 0.05 (0.70) 0.08 (1.13) 0.08 (1.34)
AGE 0.09 (1.25) 0.07 (1.17) 0.07 (1.22)
FINSLACK 0.33 (4,56) +++ 0.18 (2.28) ++ 0.15 (2.00) ++
EXP -0.05 (-0.82) -0.06 (-1.12) -0.05 (-0.93)
OPP 0.30 (3.38) +++ 0.18 (1.89) + 0.16 (2.29) ++
IC 0.20 (1.99) ++ 0.18 (1.95) + 0.17 (2.31) ++
Main efects
STRAT H1 0.44 (4.69)+++ 0.41 (4.66) +++ Yes
FLEX -0.09 (-1.46)
Interaction efects
FLEX x STRAT H2 0.25 (3.01)+++ Yes
R2 29% 44% 51%
R2 increase vs. Model 1 15% 22%
* Calculations based on path weighting scheme, bootstrapping with 1,000 samples or more and individual sign changes. + signiicant at 10%.
++ signiicant at 5%. +++ signiicant at 1%.
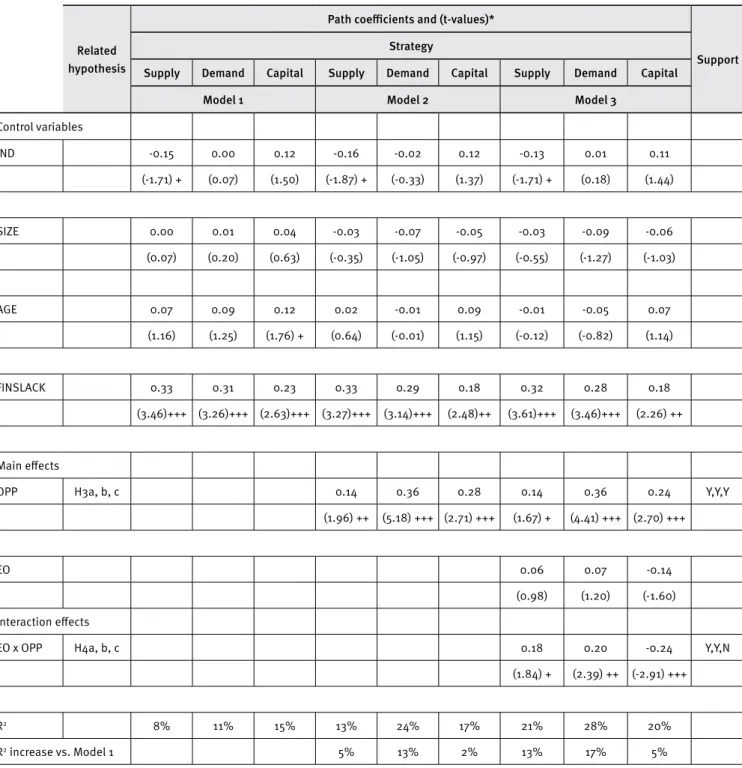
The second set of analyses, shown in Table 6, addresses irms’ characteristics and capabilities that inluence the choice for counter-cyclical strategies. Model 1 considers the direct ef-fect of our control variables and is our starting point.
Model 2 adds the direct efect of our independent vari-able, opportunity recognition. It shows that opportunity rec-ognition has positive, statistically signiicant path coeicients (b=+0.14; +0.36; +0.28), conirming its positive efect on the choice of counter-cyclical strategy in supply, demand, and capi-tal areas, respectively, which supports H3a, H3b, and H3c.
Model 3 adds our theorized indirect efects of entrepre-neurial orientation. The R2 calculations at 21%, 28%, and 20% indicate that our model is a reasonable predictor of the choice for counter-cyclical strategies in supply, demand, and capital
ar-eas, respectively. Moreover, the respective 13%, 17%, and 5% in-creases in R2 versus Model 1 indicate that our theorized variables in conjunction ofer important contribution to those predictions.
Table 6.
Results of the PLS structural model analysis - dependent variable: strategy
Related hypothesis
Path coeicients and (t-values)*
Support Strategy
Supply Demand Capital Supply Demand Capital Supply Demand Capital
Model 1 Model 2 Model 3
Control variables
IND -0.15 0.00 0.12 -0.16 -0.02 0.12 -0.13 0.01 0.11
(-1.71) + (0.07) (1.50) (-1.87) + (-0.33) (1.37) (-1.71) + (0.18) (1.44)
SIZE 0.00 0.01 0.04 -0.03 -0.07 -0.05 -0.03 -0.09 -0.06
(0.07) (0.20) (0.63) (-0.35) (-1.05) (-0.97) (-0.55) (-1.27) (-1.03)
AGE 0.07 0.09 0.12 0.02 -0.01 0.09 -0.01 -0.05 0.07
(1.16) (1.25) (1.76) + (0.64) (-0.01) (1.15) (-0.12) (-0.82) (1.14)
FINSLACK 0.33 0.31 0.23 0.33 0.29 0.18 0.32 0.28 0.18
(3.46)+++ (3.26)+++ (2.63)+++ (3.27)+++ (3.14)+++ (2.48)++ (3.61)+++ (3.46)+++ (2.26) ++
Main efects
OPP H3a, b, c 0.14 0.36 0.28 0.14 0.36 0.24 Y,Y,Y
(1.96) ++ (5.18) +++ (2.71) +++ (1.67) + (4.41) +++ (2.70) +++
EO 0.06 0.07 -0.14
(0.98) (1.20) (-1.60) Interaction efects
EO x OPP H4a, b, c 0.18 0.20 -0.24 Y,Y,N
(1.84) + (2.39) ++ (-2.91) +++
R2 8% 11% 15% 13% 24% 17% 21% 28% 20%
R2 increase vs. Model 1 5% 13% 2% 13% 17% 5%
* Calculations based on path weighting scheme, bootstrapping with 1,000 samples or more and individual sign changes. + signiicant at 10%.
++ signiicant at 5%. +++ signiicant at 1%.
DISCUSSION
took extreme measures. For instance, raw material supplies are usually ordered in advance, and it is reasonable to continue pro-ducing while inventories are high. Moreover, management may go through long processes before deciding to make cuts.
Most commonly, Brazilian irms made no change in capital- and demand-related areas, although pro-cyclical investments reduc-tions were reported by several irms and were more common than counter-cyclical increases. Again, reductions were small, except for ixed assets and acquisitions, to which larger reductions were report-ed. The likely reason is that assets involved in these reductions are expensive, so each individual cut is signiicant. Institutional theory (DiMaggio & Powell, 1983) may provide an explanation for this lack of response. Under uncertainty, irms wait to see what others will do and imitate them, creating a situation of isomorphism in which none of the players take initiative for a irst move.
Few irms have adopted counter-cyclical strategies of in-creased investments during the recession; they generally expe-rienced small increases in demand-related areas, most com-monly in the form of a price increase, conirming the mixed results in the literature. Certain characteristics of irms increase the likelihood of a choice for counter-cyclical investments.
The irst characteristic is an ability to recognize opportu-nities in recessions, which has a strong, positive efect on the choice of counter-cyclical strategies in supply (H3a), demand (H3b), and capital (H3c). Firms whose employees have mind-sets that foster identiication of opportunities rather than only threats during recessions ind new projects in which to invest.
This efect is moderated by the second characteristic: en-trepreneurial orientation. In general, higher EO strengthens the positive efect of opportunity recognition on the likelihood of counter-cyclical investments in recessions. That happens be-cause entrepreneurially oriented irms are proactive and ac-cept changes and risks associated with such investments. Thus, the more a irm is entrepreneurially oriented, the more it will be willing to counter-cyclically invest and seize these recognized opportunities. This strengthening efect is substantial in de-mand-related areas (H4b) and medium in supply-related areas (H4a). However, EO weakens the efect of opportunity recogni-tion in capital-related areas, against H4c. A possible explana-tion is that with limited resources, irms become selective and may invest in demand- and supply-related areas at the expense of capital projects. Indeed, less than half the respondents men-tioned changes in capital-related strategy. In addition, capital investments like ixed assets and acquisitions are more com-plex and expensive and take longer, being less associated with the quickness demanded by entrepreneurial orientation.
Our results also indicate that counter-cyclical strategies of increased investments during recessions enable superior
perfor-mance (H1). This is a conirmation that the beneits of acquiring good-quality resources available at low prices during recessions more than ofset the high risks of such a strategy. This positive ef-fect of counter-cyclical strategy on performance is even stronger if the irm is lexible (H2), as lexibility allows relocation and re-coniguration of resources so that implementation of investments will be more eicient, generating improved results.
It would sound strange to propose that irms counter-cy-clically increase spending when cash is limited. The key to re-solving this dilemma is inding the right investment oppor-tunities. Recessions certainly create opportunities and it is worthwhile to look for them. Firms need to ind ways to reduce costs in some – but not all – areas to improve eiciency while in-vesting in the most promising projects.
Limitations and future research
We see several limitations to our study. A irst limitation refers to the timing of performance we have measured. We have focused on immediate returns to ill a gap from prior studies, which most-ly measured performance after the recession. However, some in-vestments have lagged efects and related proits may take a long time to materialize. Likewise, cost cuts may be constrained by long-term contracts. The efects of some responses might be felt only after the downturn ends. Another limitation is survival bias, in line with Grewal & Tansuhaj (2001) and most research on reces-sions. Our survey was conducted three years after the worst quar-ter of the recession, when some irms might have closed.
Other limitations relate to our method. As in any non-experi-mental design, it is not possible to completely rule out endogeneity problems (Semadeni, Withers, & Trevis Certo, 2013). Moreover, we may face a reverse causality problem: we relied on theory to argue that investments increased performance, but it could be the oppo-site – higher performance enabled investments. Similar to Navar-ro et al (2010), we can conirm only association between variables, not causality. Another limitation is our small sample. Even though PLS studies have been published with smaller samples and PLS is adequate for such cases (Ringle et al., 2012), our results should be considered more indicative than conclusive. Finally, our sample in-cluded only irms operating in Brazil. This is an interesting context for such research, but caution is recommended before generalizing results to very diferent business environments.
ex-pose irms to turbulence and may allow them to be more lexible than irms from developed economies. Furthermore, countries whose cultures are marked by tolerance for risk may have irms with higher entrepreneurial orientation.
Contributions and conclusion
By investigating the cyclical strategies that enable irms superi-or perfsuperi-ormance in recessions, our paper advances the business cycle management literature, an unexplored research stream within strategic management. In particular, we answer a call to address how irms absorb and respond to economic downturns and to use surveys to examine organizational factors that inlu-ence investment preferinlu-ences in these moments (Srinivasan et al., 2011; Zona, 2012). To our knowledge, this is the irst study to propose and test an integrative model with several variables to analyze recessions. Moreover, we do so in less traditional con-texts proposed by some authors, such as non-listed companies (Mascarenhas & Aaker, 1989).
Our research is also relevant to practitioners. Once in a recession, managers can implement our suggestions to make investments that will enable their irms to navigate through dif-icult periods. Furthermore, considering that recessions are re-curring events, managers can invest in developing the charac-teristics and capabilities that will help their irms be prepared for future recessions.
To conclude, our research has indicated that most irms pro-cyclically reduce costs and investments during recessions. Nevertheless, irms with better ability to recognize opportuni-ties in the changing environment and more entrepreneurial ori-entation to invest in these opportunities adopt a counter-cycli-cal strategy of investing in new projects, and present superior performance. Finally, it is important for irms to be lexible for an eicient implementation of these investments.
ACKNOWLEDGMENTS
We acknowledge the inancial support received from Capes, CNPq and from FGV-Ebape/ Pró-Pesquisa for our research.
NOTE FROM
RAE
A preliminary version of this article was presented in the 8th Iberoamerican Academy Conference – World in Transition: business, multiculturalism and society on December 2013, promoted by Fundação Getulio Vargas/ Escola de Administração de Empresas de São Paulo (FGV/ EAESP)
REFERENCES
Aaker, D., & Mascarenhas, B. (1984). The need for strategic lexibility.
Journal of Business Strategy, 5(2), 74-82.
Anderson, B., Covin, J., & Slevin, D. (2009). Understanding the relation-ship between entrepreneurial orientation and strategic learning capa-bility: an empirical investigation. Strategic Entrepreneurship Journal,
3(3), 218-240.
Ang, S., Leong, S., & Kotler, P. (2000). The Asian apocalypse: crisis mar-keting for consumers and business. Long Range Planning, 33(1), 97-119. Apaydın, F. (2011). Changes in marketing strategies and performance outcomes of Turkish irms in 2008 global economic recession. Interna-tional Business Research, 4(4), 104-114.
Beaver, G. (2002). The inancial performance of smaller companies: ob-servations from diicult times. Strategic Change, 11(1), 1-5.
Bromiley, P., Navarro, P., & Sottile, P. (2008). Strategic business cycle management and organizational performance: a great unexplored re-search stream. Strategic Organization, 6(2), 207-219.
Campello, M., Graham, J., & Harvey, C. (2010). The real efects of inan-cial constraints: evidence from a inaninan-cial crisis. The Journal of Financial Economics, 97(3), 470-487.
Claessens, S., & Kose, M. (2009). Back to basics: what is a recession?
Finance and Development, 45(1), 1-3.
Covin J., & Slevin D. (1989). Strategic management of small irms in hostile and benign environments. Strategic Management Journal, 10(1), 75-87. Crossland, C., & Hambrick, D. (2011). Diferences in managerial discre-tion across countries: how nadiscre-tion-level institudiscre-tions afect the degree to which CEOs matter. Strategic Management Journal, 32(8), 797-819. Crotty, J. (2009). Structural causes of the global inancial crisis: a critical assessment of the “new inancial architecture”. Cambridge Journal of Economics 33(4), 563-580.
DiMaggio, P., & Powell, W. (1983). The iron cage revisited: institutional isomorphism and collective rationality in organizational ields. Ameri-can Sociological Review, 48(2), 147-160.
Dutt, P., & Padmanabhan, V. (2011). Crisis and consumption smoothing.
Marketing Science, 30(3), 491-512.
Dye, R., Sibony, O., & Viguerie, S. (2009). Strategic planning: three tips for 2009. McKinsey Quarterly. Retrieved on June 28, 2013 from www. mckinsey.com/insights/strategy/strategic_planning_three_tips_for _2009.
Fornell, C., & Larcker, D. (1981). Evaluating structural equation models with unobservable variables and measurement error. Journal of Market-ing Research, 18(1), 39-50.
Franke, M., & John, F. (2011). What comes next after recession? Airline industry scenarios and potential end games. Journal of Air Transport Management, 17(1), 19-26.
Galveas, E. (2009). Síntese da conjuntura – conjuntura 2008. Carta Mensal, 54(648), 83-94.
Geroski, P., & Gregg, P. (1997). Coping with recession: U.K. firm perfor-mance in adversity. Cambridge, U.K.: Cambridge University Press.
Gore, C. (2010). The global recession of 2009 in a long-term develop-ment perspective. Journal of International Development, 22(6), 714-738. Green, K., Covin, J., & Slevin, D. (2008). Exploring the relationship be-tween strategic reactiveness and entrepreneurial orientation: the role of structure-style it. Journal of Business Venturing, 23(3), 356-383. Grewal, R., & Tansuhaj, P. (2001). Building organizational capabilities for managing economic crisis: the role of market orientation and strate-gic lexibility. Journal of Marketing, 65(2), 67-80.
Gruber, M., Heinemann, F., Brettel, M., & Hungeling, S. (2010). Conig-urations of resources and capabilities and their performance implica-tions: an exploratory study on technology ventures. Strategic Manage-ment Journal, 31(12), 1337-1356.
Grusky, D., Western, B., & Wimer, C. (2011). The consequences of the great recession. In: Grusky, D, Western, B, Wimer, C. (eds). The Great Recession. New York: Sage, 3-20.
Gulati, R., Nohria, N., & Wohlgezogen, F. (2010). Roaring out of reces-sion. Harvard Business Review, 88(3), 1-8.
Gupta V., MacMillan I., & Surie, G. (2004). Entrepreneurial leadership: developing and measuring a cross-cultural construct. Journal of Busi-ness Venturing, 19(2), 241-260.
Hair, J., Ringle, C., & Sarstedt, M. (2011). PLS-SEM: indeed a silver bullet.
Journal of Marketing Theory and Practice, 19(1), 139-151.
Hair, J., Ringle, C., & Sarstedt, M. (2012). Partial least squares: the better approach to structural equation modeling? Long Range Planning, 45(5-6), 312-319.
Hall, R. (2005). Employment luctuations with equilibrium wage sticki-ness. American Economic Review, 95(1), 50-65.
Hampson, D., & McGoldrick, P. (2013). A typology of adaptive shopping patterns in recession. Journal of Business Research, 66(7), 831-838. Hill, T., & Mudambi, R. (2010). Far from Silicon Valley: how emerging economies are re-shaping our understanding of global entrepreneur-ship. Journal of International Management, 16(4), 321-327.
Hoskisson, R., Wright, M., Filatotchev, I., & Peng, M. (2013). Emerging multinationals from mid-range economies: the inluence of institutions and factor markets. Journal of Management Studies, 50(7), 1295-1321. Hulland, J. (1999). Use of partial least square (PLS) in strategic manage-ment research: a review of four recent studies. Strategic Management Journal, 20(2), 195-204.
Ireland, R., Hitt, M., & Sirmon, D. (2003). A model of strategic entrepre-neurship: the construct and its dimensions. Journal of Management,
29(6), 963-989.
Ivashina, V., & Scharfstein, D. (2010). Bank lending during the inancial crisis of 2008. Journal of Financial Economics, 97(3), 319-338.
Kamakura, W., & Du, R. (2012). How economic contractions and expan-sions afect expenditure patterns. Journal of Consumer Research, 39(2), 229-247.
Kaytaz, M., & Gul, M. (2014). Consumer response to economic crisis and lessons for marketers: the Turkish experience. Journal of Business Re-search. Journal of Business Research, 67(1), 2701- 2706.
Lamey, L., Deleersnyder, B., Steenkamp, J., & Dekimpe, M. (2012). The efect of business-cycle luctuations on private label share: what has marketing conduct got to do with it? Journal of Marketing, 76(1), 1-19. Latham, S., & Braun, M. (2008). The performance implications of inan-cial slack during economic recession and recovery: observations from the software industry (2001-2003). Journal of Managerial Issues, 20(1), 30-52.
Latham, S., & Braun, M. (2011). Economic recessions, strategy, and per-formance: a synthesis. Journal of Strategy and Management, 4(2), 96-115. Li, S., & Tallman, S. (2011). MNC strategies, exogenous shocks, and per-formance outcomes. Strategic Management Journal, 32(10), 1119-1127. Lumpkin, G., & Dess, G. (1996). Clarifying the entrepreneurial orienta-tion construct and linking it to performance. Academy of Management Review, 21(1), 135-172.
Ma, X., Yiu, D., & Zhou, N. (2014). Facing global economic crisis: foreign sales, ownership groups, and corporate value. Journal of World Busi-ness, 49(1), 87-100.
Mansoor, D., & Jalal, A. (2011). The global business crisis and consumer behavior: Kingdom of Bahrain as a case study. International Journal of Business and Management, 6(1), 104-115.
Mascarenhas, B., & Aaker, D. (1989). Strategy over the business cycle.
Strategic Management Journal, 10(3), 199-210.
McGahan, A. (2004). How industries evolve: principles for achieving and sustaining superior performance. Boston, MA: Harvard Business School Press.
McGrath, R. (1999). Falling forward: real options reasoning and entre-preneurial failure. Academy of Management Review, 24(1), 13-30.
McGrath, R., & MacMillan, I. (2000). The entrepreneurial mindset: strat-egies for continuously creating opportunity in an age of uncertainty.
Boston, MA: Harvard Business School Press.
Muurlink, P., Wilkinson, A., Peetz, D., & Townsend, K. (2012). Managerial autism: threat-rigidity and rigidity’s threat. British Journal of Manage-ment, 23(Supplement), S74-S87.
Nadkarni, S., & Narayanan, V. (2007). Strategic schemas, strategic lexibility, and irm performance: the moderating role of industry clock-speed. Strategic Management Journal, 28(3), 243-270.
Navarro, P., Bromiley, P., &Sottile, P. (2010). Business cycle manage-ment and irm performance: tying the empirical knot. Journal of Strategy and Management, 3(1), 50-71.
Nunes, J., Drèze, X., & Han, Y. (2010). Conspicuous consumption in a recession: toning it down or turning it up? Journal of Consumer Psychol-ogy, 21(2), 199-205.
Parnell, J., Dent., E, O’Regan, N., & Hughes, T. (2012). Managing perfor-mance in a volatile environment: contrasting perspectives on luck and causality. British Journal of Management, 23(Supplement), S104-S118.
Plambeck, N., & Weber, K. (2010). When the glass is half full and half empty: CEO’s ambivalent interpretations of strategic issues. Strategic Management Journal, 31(7), 689-710.
Pochmann, M. O. (2009). Trabalho na crise econômica no Brasil: primei-ros sinais. Estudos Avançados, 23(66), 41-52.
Podsakof, P. M., MacKenzie, S. B., & Podsakof, N. P. (2012). Sources of method bias in social science research and recommendations on how to control it. Annual Review of Psychology, 63, 539-569.
Podsakof, P. M., & Organ, D. (1986). Self-reports in organizational re-search: problems and prospects. Journal of Management, 12(4), 531-544. Porter, M. (1979). How competitive forces shape strategy. Harvard Busi-ness Review, 57(1), 66-75.
Ringle, C., Sarstedt, M., & Straub, D. (2012). A critical look at the use of PLS-SEM in MIS quarterly. MIS Quarterly, 36(1), i3-14.
Robins, J. (2012). Partial-least squares. Long Range Planning, 45(5-6), 309-311.
Rowe, W., & Wright, P. (1997). Related and unrelated diversiication and their efect on human resource management controls. Strategic Management Journal, 18(4), 329-338.
Schotter, A., & Beamish, P. (2013). The hassle factor: an explanation for managerial location shunning. Journal of International Business Studies, 44(5), 521-544.
Semadeni, M., Withers, M. C., & Trevis Certo, S. (2014). The perils of endogeneity and instrumental variables in strategy research: under-standing through simulations. Strategic Management Journal, 35(7), 1070-1079.
Siemsen, E., Roth, A., & Oliveira, P. (2010). Common method bias in re-gression models with linear, quadratic, and interaction efects. Organi-zational Research Methods, 13(3), 456-476.
Srinivasan, R., Lilien, G., & Sridhar, S. (2011). Should irms spend more on research and development and advertising during recessions? Jour-nal of Marketing, 75(3), 49-65.
Srinivasan, R., Rangaswamy, A., & Lilien, G. (2005). Turning adversity into advantage: does proactive marketing during a recession pay of.
International Journal of Research in Marketing, 22(2), 109-125.
Tellis, G., & Tellis, K. A. (2009). Research on advertising in a recession: a critical review and synthesis. Journal of Advertising Research, 49(3), 304-327.
Tsang, E. (2002). Acquiring knowledge by foreign partners from inter-national joint ventures in a transition economy: learning-by-doing and learning myopia. Strategic Management Journal, 23(9), 835-854.
Verdú-Jover, A, Lloréns-Montes, F., & García-Morales, V. (2006). Environ-ment-lexibility coalignment and performance: an analysis in large ver-sus small irms. Journal of Small Business Management, 44(3), 334-349. Venaik, S., Midgley, D., & Devinney, T. (2005). Dual paths to perfor-mance: the impact of global pressures on MNC subsidiary conduct and performance. Journal of International Business Studies, 36(6), 655-675. Wang, C. (2008). Entrepreneurial orientation, learning orientation, and irm performance. Entrepreneurship Theory and Practice, 32(4), 635-657. Worren N., Moore, K., & Cardona, P. (2002). Modularity, strategic lex-ibility, and irm performance: a study of the home appliance industry.
Strategic Management Journal, 23(12), 1123-1140.
Wright, M., Hoskisson, R., Busenitz, L., & Dial, J. (2000). Entrepreneurial growth through privatization: the upside of management buyouts. The Academy of Management Review, 25(3), 591-601.
Zarnowitz, V. (1985). Recent work on business cycles in historical per-spective: a review of theories and evidence. Journal of Economic Litera-ture, 23(2), 523-580.
Zhou, K., & Wu, F. (2010). Technological capability, strategic lexibility, and product innovation. Strategic Management Journal, 31(5), 547-561. Zona, F. (2012). Corporate investing as a response to economic down-turn: prospect theory, the behavioural agency model and the role of financial slack. British Journal of Management, 23(Supplement), S42-S57.