© FECAP
RBGN
Review of Business Management
DOI:10.7819/rbgn.v18i61.3058
370
Received on 03/10/2016 Approved on 06/21/2016
Responsible editor:
Prof. Dr. João Maurício Gama Boaventura
Evaluation process:
Double Blind Review
The critical success factors for organizational
performance of SMEs in Malaysia: a partial
least squares approach
May Chiun Lo
Universiti Malaysia Sarawak, Faculty of Economics and Business, Kota Samarahan, Malaysia
Yin Chai Wang
Universiti Malaysia Sarawak, Faculty of Computer Science and Information Technology, Kota Samarahan, Malaysia
Constance Rinen Justin Wah
Universiti Malaysia Sarawak, Faculty of Economics and Business, Kota Samarahan, Malaysia
T. Ramayah
Universiti Sains Malaysia, School of Management, Minden, Malaysia
Abstract
Purpose – his paper seeks to examine the relationship between the determinants of organizational performance such as top management support, customer focus, employees’ orientation, technology orientation, and entrepreneurial orientation in Malaysia.
Design/methodology/approach – A quantitative research design was applied for this study. Data was collected through survey questionnaires applied to business owners and senior managers working in SMEs located in three Malaysian states, using purposive sampling technique. SmartPLS 2.0 (M3) was applied to test the hypotheses.
Findings – The findings suggest that both technology and entrepreneurial orientations are signiicant success factors for SMEs in terms of inancial and non-inancial performance. In addition, top management support is found to be signiicantly and positively related to inancial performance.
1
Introduction
Small and Medium Enterprises (SMEs) are considered as one of the cornerstones of Malaysian’s engine of economic growth. herefore, Malaysian Government has introduced several development programs in helping local SMEs to grow with the intention to realize its vision to be one of the high income nations with developed status by 2020. However, Malaysian SMEs are still losing their competitive advantage in the global business environment due to their low productivity and poor performance (Tehseen, Sajilan, Ramayah, & Gadar, 2015). Furthermore, Malaysian SMEs are found to provide a lower contribution to the nation’s GDP and exports as compared to SMEs of many neighboring nations such as Japan, South Korea, and Singapore (Halim, Ahmad, & Ramayah, 2013). Taking cognizance of the importance of Malaysian SMEs as the building blocks of economic growth, it is therefore crucial to identify critical success factors that can improve competitiveness and reduce the gap between Malaysian SMEs and SMEs in these countries in term of contribution to the economy.
Prior research has emphasized the importance of various strategic orientations such as technology orientation, learning organization, market orientation, customer orientation, top management support and competitor orientation in determining the firm performance and the development of a sustainable competitive advantage (Day, 1994; Gatignon & Xuereb, 1997; Zhou & Li, 2010). In continuation, Salaheldin (2009) proposed a framework to identify the critical success factors of total quality management implementation, and evaluate their efects on operational performance, inancial and non-inancial performance among the SMEs in Qatari. he results revealed that strategic factors such as leadership, top management support, and organizational culture have strong positive impact on overall performance, while operational factors such as customer orientation, process control, product and service design have a strong positive impact on operational and financial
performance, and lastly tactical factors such as supplier relationships, employee training and empowerment have a strong positive impact on operational performance only.Moreover, Chong, Shafaghi, and Tan (2011) critically explored critical success factors for SMEs operating in China and they suggested a combination of internal critical factors (successful customer relationships, security and trust, transparency of information, IS/IT infrastructure, top management support, supply chain facilities) and external critical factors (global competitiveness, government commitments, cultural considerations) in developing and sustaining the success of business to business e-commerce. A recent study conducted by Vyas, Raitani, Roy, and Jain (2015) found that critical success factors such as supportive organizational factors, fast and responsive services, target-based marketing, SME banking policy and model, and enhanced customer services are important for the success of SMEs operating in the banking industry in India.
In view of the above, it is clear that research on critical success factors for SMEs’ success is still at a developing stage. Currently, there is still lack of a validated and solid critical success factors framework for SMEs as a guide to improve their competitiveness in the market (Chong, Shafaghi, & Tan, 2011). his study intends to ill the gap by identifying critical success factors for SMEs in the context of Malaysia, and studying the relationship between identiied critical success factors and organizational performance (inancial and non-inancial performance). he outcome of this study will be useful for entrepreneurs as well as scholars in generating a framework that can improve overall organizational performance in an emerging economic context. he research objectives of this study are twofold:
2. To investigate the relationship between critical success factors (Top Management Support, Customer Focus, Employee Orientation, Technology Orientation, and Entrepreneurial Orientation) and inancial performance of the SMEs.
The rest of the paper is structured as follows: the irst part reviews the existence of empirical literature. Secondly, the research methodology is described. hen, the third part represents the data analysis and respective results. Finally, the results are discussed and conclusions are presented.
2
Literature review
his study investigates the relationship between the determinants of organizational performance in SMEs in Malaysia. A review of related literature was undertaken with the primary focus on deining the variables as well as the theoretical relationships between them.
2.1
Organizational performance
Organizational performance refers to a concept that measures a irm’s position in the marketplace and the irm’s ability in meeting its stakeholders’ needs (Griin, 2003; Lo, Mohamad, Ramayah, & Wang, 2015). It can also be known as the degree to which the operation fulils the performance objectives (primary measures) and meets the needs of the customers (secondary measures) (Slack, Chambers, & Johnston, 2010).
Previously, the concept of organizational performance normally referred to financial ratios such as profitability, return on assets (ROA), return on investments (ROI), and return on equity (ROE). Nevertheless, there is increasing criticism on the short-term thinking of traditional performance measurement systems that only employs inancial measures (Kaplan & Norton, 1996). Consequently, many researchers have employed a more balanced approach of performance measurement by including both inancial performance and non-inancial performance measures (Ho, Ahmad, & Ramayah,
2016; Simon et al., 2015). Financial performance has been seen by many as the ultimate aim of any company and it relects how well a company uses its assets to generate revenues (Chen, Tsou, & Huang, 2009). On the other hand, non-inancial performance measures refer to long-term operational objectives of a company or, in other words, future performance indicators that are not presentable by contemporary inancial measures (Blazevic & Lievens, 2004; Prieto & Revilla, 2006).
The critical success factors for SMEs are identiied by combining literature review and focus group. First, the researcher critically reviewed relevant papers in order to identify critical success factors that have been found to contribute to business success. hen, a focus group consisting of senior executives from the industry was established to rank the identiied factors that they perceived as most critical for the success in the current business environment. Among the determinants, ive factors have been selected as variables to be studied in this study: top management support, customer focus, employee orientation, technology orientation, and entrepreneurial orientation. hese ive important determinants of organizational performance serve as the critical success factors for this study.
2.2
Top management support
he concept “top management support” has been studied by many scholars and unarguably it is known as one of the most important critical success factors underlying the success of companies (Bryde, 2008; Hung, Lien, Fang, & McLean, 2010). Top management support refers to backing and commitments by highest ranking executives for projects as well as strategies implementation (Garrett & Neubaum, 2013).
in the recent empirical literature. General consensus stated that top management support must be veriied and demonstrated, by actively communicating the mission and vision throughout the organization (Demirbag et al.,2006; Fotopoulos & Psomas, 2009; Salaheldin, 2009; Turkyilmaz, Tatoglu, Zaim, & Ozkan, 2010). Many other aspects should be focused by managers to align the quality objectives with the vision, to commence quality and a corporate culture, and to create a culture with continuous improvements, minimizing the reluctance towards change.
Sexton and Upton (1987) supported the strategic choice perspective by arguing that the performance of a irm is not a natural phenomenon, but rather the choices and social interactions made by the irms’ top manager. Top management is empowered with the most influential decision making role in the organization. Furthermore, top management plays a key role in creating conditions in the work environments that are favorable for an integration of learning and work (Noe & Wilk, 1993). he responsibility of the top management includes communicating the company strategy to all members of the organization, providing inancial support for training programs, and motivating employees to innovate and solve problems (Al Shaar, Khattab, Alkaied, & Manna, 2015; Umble, Haft, & Umble, 2003). he discussed empirical literatures provide evidence that displaying top management support is essential, and how it remains critical in order to reap the beneits. In this regard, Iqbal, Long, Fei, Ba’ith, and Bukhari (2015) revealed that top management support plays a crucial role in ensuring project success by facilitating the provision of timely resources. Similarly, Fernandes, Lourenço, and Silva (2014) found that leadership attitude and support of the top management can promote organizational innovation. herefore, the following hypotheses are formulated:
H1: Top management support is positively related to non-inancial performance.
H2: Top management support is positively related to inancial performance.
2.3
Customer focus
Customer focus is similar to market orientation, both looking for innovative solutions that can create superior customer value. However, customer focus and market orientation are diferent to those businesses that actively attempt to understand their markets (Slater & Narver, 1998). Customer focus places the customer as the top of the organizational chart, whereas market orientation gives equal weight to customer needs, competitive context, and inter-functional coordination (Narver & Slater, 1990).
obtaining customer information, which can be used to develop and deploy supply-chain relationship capabilities, referring to the stock of knowledge-based competencies for efective managing a irm (Chen, Paulraj, & Lado, 2004; Kirca, Jayachandran, & Bearden, 2005; Liu, Ke, Wei, & Hua, 2013). he support of having a high degree of customer focus in SMEs is likewise addressed in the study conducted by Ahire and Golhar (1996), who further argue that the focus of customers may be stronger in SMEs due to their proximity to and close relationship with the customers. he SMEs’ organizations should not view customers only as a source of irm’s revenues and proits, but also as resources for gaining and sustaining competitive advantage. herefore, the following hypotheses are proposed:
H3: Customer focus is positively related to non-inancial performance.
H4: Customer focus is positively related to inancial performance.
2.4
Employee orientation
Employee orientation or employee focus is in numerous studies referred to as one of the most important factors underlying a successful employment. Employee orientation can be deined as the familiarization with a new work environment. he irst few months are a critical period for employees to perform and become a high performer. Many managers view the employee orientation as a very mechanical information gathering exercise (Bernardin & Russell, 1993). Sharing internal and external information across functional groups can encourage employees to feel more responsible for quality decision and improvements. Sun (2000) argued that the essence of involving employees in the decision making process or empowerment is that the employees nearest a potential opportunity or a problem are in the best position of making the necessary decisions, if they have control over the process. Ensuring an eicient low of feedback is
thus essential to remove barriers to performance improvements. As stated by Yusof and Aspinwall (2000), SMEs often have lattened organizational structure and a shorter decision making process, enabling a faster information low and improved communication. Apart from engaging employees with empowerment, continuous education and training are essential for the sustainability of their personal and organizational growth. As the provision of employees training and empowerment is associated with costs of the organization, it must be aligned with employee’s evaluations in order to examine the efectiveness of the event (Hendricks & Singhal, 1997).
Employee orientation is imperative for better organizational performance as it can create higher level of job satisfaction and employee retention while decreasing employee’s turnover rate (Awan, 2013). Firms which display high level of employee orientation will gain trust and appreciation from employees that ultimately lead them to perform and achieve better inancial performance than others (de Bussy & Suprawan, 2012). herefore, the following hypotheses are developed:
H5: Employee orientation is positively related to non-inancial performance.
H6: Employee orientation is positively related to inancial performance.
2.5
Technology orientation
through R&D intensity as well as to quickly adapt to new technologies have an increased chance of achieving superior performance (Zhou & Li, 2010).
Furthermore, invention and creativity in adopting technology may provide the guidelines to the irms on what strategic implementation to be executed. SMEs that focus on technology leadership ofers advanced products diicult to be imitated by their competitors, thus increasing the switching costs. herefore, technology orientation is linked to enhance new product success and proitability (Gatignon & Xuereb, 1997; Song & Parry, 1997; Trainor, Rapp, Beitelspacher, & Schillewaert, 2010). Moreover, a number of researchers found a signiicant and positive relationship between technology orientation and innovation (Al-Ansari, Altalib, & Sardoh, 2013; Lee, Choi, & Kwak, 2015). On the other hand, Gatignon and Xuereb (1997) recommended irms to foster technology orientation in both high and low market growth situations for a competitive advantage in product development. Although high technology-applied solutions are presented, sometimes the customers could not beneit from the implementation. If the irm failed to adapt the advanced technology into customers’ beneits, the business performance of the irms could not happen. herefore, any high technology adaptation should align with the high organizational performance. Based on the literatures discussed above, the following hypotheses have been formulated:
H7: Technology orientation is positively related to non-inancial performance.
H8: Technology orientation is positively related to inancial performance.
2.6
Entrepreneurial orientation
Entrepreneurism is an essential role in the society, performing businesses and contributing towards the growth of organizational performance. Due to the changing environment in which most
organizations are now competing, it is essential to consider the importance of top managers from the standpoint of how their entrepreneurial preferences and value may impact decision making. Entrepreneurial orientation refers to tendencies, processes and behaviors that lead to new markets (or existing) goods or services via the existing (or new) ones (Walter, Auer & Ritter, 2006). At the organization level, entrepreneurial orientation is deined as the strategy making processes that provide organizations with a basis for entrepreneurial decision and actions (Rauch, Wiklund, Lumpkin, & Frese, 2009). On the other hand, Lumpkin and Dess (1996) stated that entrepreneurial orientation is said to be a company’s strategic orientation, having certain entrepreneurial aspects, styles, methods and decision attributes (Wiklund & Shepherd, 2005). Based on diferent models of corporate entrepreneurship, entrepreneurial orientation includes five features such as innovativeness, riskiness, proactiveness, competitive aggressiveness and autonomy (Walter et al., 2006). Apart from that, innovativeness has been considered as one of the most important strategic orientations of irms to achieve long-term success (Noble et al., 2002), and having a signiicant efect on venture performance (Baum, 1995; Rauch & Frese, 2000; Utsch & Rauch, 2000).
(Gupta & Batra, 2015). In a meta-analysis of 51 studies, Rauch et al. (2009) observed a generally positive and moderately large (r=0.242) correlation between entrepreneurial orientation and irm performance across measures of both growth and proitability. Furthermore, Jabeen and Mahmood (2014) elucidate that irms who adopt entrepreneurial orientation can frequently innovate and are willing to take risks in their strategies that ultimately leads them to superior performance. Based on these discussions, the following hypotheses have been developed:
H9: Entrepreneurial orientation is positively related to non-inancial performance.
H10: Entrepreneurial orientation is positively related to inancial performance.
3
Methodology
A quantitative research design was applied for this study. The population of this study consists of business owners and senior managers currently working in SMEs in the states of Selangor, Kuala Lumpur, and Sarawak. In selecting the respondents, we adopted a method of purposive sampling. SME directory provided by SME Corporation Malaysia was utilized to determine the sample that meet the following inclusion criteria: (1) the irm must have less than 200 full time employees for the manufacturing sector and 75 full time employees for the service sector; and (2) the irm must be a standalone irm, not a franchise or part of a larger organization.
The measuring instrument for data collection was in the form of a questionnaire, and all scales were adapted from previous studies which validated them in the contexts of developed as well as developing economies. he questionnaire was divided into three sections. Section 1 required the respondents to rate a total of 25 items on ive critical success factors, namely top management support, customer focus, employee orientation, technology orientation, and entrepreneurial orientation. For the purpose of this study, the
items for measuring top management support were adapted from the work by Ar and Baki (2011). As for customer focus, items by Das, Paul, and Swierczek (2008) were adapted. In addition, the items for another three critical success factors, namely employee orientation, technology orientation, and entrepreneurial orientation, were adapted from the work by Zhang (2010), Kim, Im, and Slater (2013), and Mu and Benedetto (2011) respectively. Section 2 required respondents to assess their perceived non-inancial performance as well as inancial performance. Non-financial performance measures were adapted from studies by Aron and Liem (2011), Zebal and Goodwin (2011), Lee, Kim, and Choi (2012), Chong, Chan, and Sim (2011), and Vazquez, Silva, and Ruiz (2012). On the other hand, inancial performance measures were drawn from previous empirical studies such as those by Ganeshasundaram and Henley (2007), Slater, Hult, and Olson (2010), and Zebal and Goodwin (2011). All of the items in Section 1 and Section 2 are anchored on a Likert scale of 7-points (1 = strongly disagree and 7 = strongly agree). Lastly, Section 3 covers the personal proile and demographic data of respondents.
before they participated in the survey in order to reduce socially desirable responses. Out of the 500 distributed questionnaires, 180 questionnaires were returned and used for statistical analysis, indicating a response rate of 36%.
Data was collected from a single informant in each SME, and thus common method variance could potentially have affected the results. Following Podsakoff, MacKenzie, Lee, and Podsakof’s (2003) suggestion, Harman’s single-factor test was used as a diagnostic to assess the risk. he results revealed ive distinct factors that accounted for 72.28% of the total variance, with the largest factor accounting for only 46.94% of the variance. Consequently, it can be concluded that common-method variance is not likely to be a signiicant problem in this study.
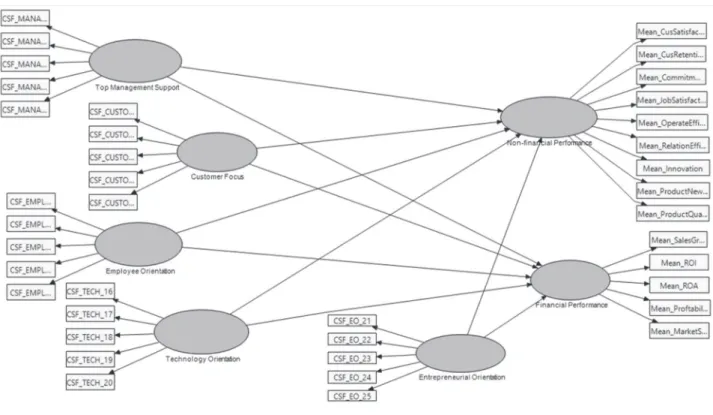
Data were analyzed using Statistical Package for Social Sciences (SPSS) 20.0 and SmartPLS 2.0 developed by Ringle, Wende, and Will (2005). Partial Least Squares (PLS) were employed as it presents the beneit of permitting
the complete research model to be tested just once (Halawi & McCarthy, 2008). First, the demographic proiles of the respondents were analyzed by using descriptive statistics in SPSS. Then, the SmartPLS 2.0 which is based on path modeling and bootstrapping (Chin, 1998; Tenenhaus, Esposito Vinzi, Chatelin, & Lauro, 2005; Wetzels, Odekerken-Schroder, & van Oppen, 2009) was used to measure the model as shown in Figure 1. he analysis in PLS was divided into two stages: measurement model and structural model. Measurement model involves the assessment of the reliability and validity of the measures. In the measurement model, reliability was assessed by examining the Composite Reliability (CR) while validity was assessed in convergent validity and discriminant validity. Once the measurement model was done, structural model testing with 500 re-samples was applied to test the hypothesized relationships between critical success factors and organizational performance.
4
Findings
4.1
Respondent proile
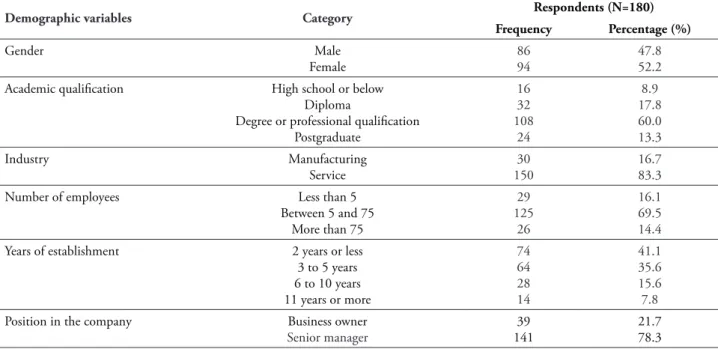
Table 1 shows the demographic information of the 180 respondents. The number of female respondents was higher than male respondents with 94 female respondents (52.2%) and 86 male respondents (47.8%). he majority of the respondents held degree or professional qualiication (108 or 60%), followed by diploma (32 or 17.8%), postgraduate (24 or 13.3%), and high school or below (16 or 8.9%). In terms of industry, 30 (16.7%) of them were from manufacturing industry and 150 (83.3%)
were from service industry. Most of the irms which responded have between 3-75 employees (125 or 69.5%), 29 (16.1%) irms have less than 5 employees, and 26 (14.4%) irms have more than 75 employees. With regard to the year of establishment, 74 (41.1%) irms were established for 2 years or less, 64 (35.6%) firms were established for between 3 to 5 years, 28 (15.6%) irms were established for between 6 to 10 years, and only 14 (7.8%) irms were established for 11 years or more. Most of the respondents of the survey were senior manager (141 or 78.3%), followed by business owner (39 or 21.7%).
Table 1
Demographic proile of respondents
Demographic variables Category Respondents (N=180)
Frequency Percentage (%)
Gender Male
Female 8694 47.852.2
Academic qualiication High school or below Diploma
Degree or professional qualiication Postgraduate
16 32 108 24
8.9 17.8 60.0 13.3
Industry Manufacturing
Service 15030 16.783.3
Number of employees Less than 5 Between 5 and 75
More than 75
29 125 26
16.1 69.5 14.4
Years of establishment 2 years or less 3 to 5 years 6 to 10 years 11 years or more
74 64 28 14
41.1 35.6 15.6 7.8
Position in the company Business owner
Senior manager 14139 21.778.3
4.2
Assessment of the measurement
model
Firstly, conirmatory factor analysis (CFA) was conducted to test the reliability, convergent validity, and discriminant validity of the measures. Hair, Black, Babin, and Anderson (2010) suggested the use of factor loadings, Average Variance Extracted (AVE), and Composite Reliability (CR) to assess convergent validity. As indicated in the Table 2, most item loadings were
close to or larger than 0.5 (signiicant at p < 0.01), all Average Variance Extracted (AVE) exceeded 0.5 (Bagozzi & Yi, 1988), and the Composite Reliability (CR) for all the variables exceeded 0.7 (Gefen, Straub, & Boudreau, 2000).
exceeded the correlations with other variables. hus, the measurement model was considered satisfactory with the evidence of adequate
reliability, convergent validity, and discriminant validity.
Table 2
Result of measurement model
Construct Loadings CRa AVEb
Top Management Support
CSF_MANAGERSUPPORT_1: Top management researches the new technologies, processes and product ideas.
CSF_MANAGERSUPPORT_2: Top management actively seeks innovative ideas. CSF_MANAGERSUPPORT_3: Top management encourages innovation activities.
CSF_MANAGERSUPPORT_4: Top management promotes the advantages of new solutions and ideas enthusiastically.
CSF_MANAGERSUPPORT_5: Mistakes regarding creative and innovative eforts of individuals are tolerated by top management.
0.835 0.870
0.902
0.902
0.597
0.915 0.687
Customer Focus
CSF_CUSTOMER_6: Our company has developed a program to maintain good customer communication.
CSF_CUSTOMER_7: Our company collects extensive complaint information from customers.
CSF_CUSTOMER_8: Quality-related customer complaints are treated with top priority. CSF_CUSTOMER_9: Our company conducts a customer satisfaction survey every year. CSF_CUSTOMER_10: Our company always conducts market research for collecting suggestions for improving our products.
0.812 0.814 0.845
0.794
0.740
0.900 0.643
Employee Orientation
CSF_EMPLOYEE_11: In our company, people are rewarded in the proportion to the excellence of their job performance.
CSF_EMPLOYEE_12: Our company has a promotion system that helps the best persons to rise to the top.
CSF_EMPLOYEE_13: Our company is characterized by a relaxed, easygoing working climate.
CSF_EMPLOYEE_14: here is a lot of warmth in the relationships between management and workers in this company.
CSF_EMPLOYEE_15: he philosophy of our management emphasizes the human factor, how people feel, etc.
0.761 0.843 0.616
0.832
0.821
0.884 0.607
Technology Orientation
CSF_TECH_16: Our company uses advanced technologies in new product development. CSF_TECH_17: Our company uses the latest technologies in new product development. CSF_TECH_18: Our products are on the leading edge of the industry standard. CSF_TECH_19: Our company uses systematic scanning for new technologies inside and outside the industry.
CSF_TECH_20: Our company reinvests a signiicant portion of proit in R&D.
0.805 0.844
0.875
0.900 0.817
0.928 0.721
Entrepreneurial Orientation
CSF_EO_21: Our company has built capacity to react to market changes. CSF_EO_22: Our company protects our advantages from industry changes. CSF_EO_23: Our company prepares for radical industry changes.
CSF_EO_24: Our company believed that wide-ranging acts were necessary to achieve objectives.
CSF_EO_25: Our company initiated actions to which other organizations respond.
0.871 0.910
0.899
0.788 0.859
Construct Loadings CRa AVEb Non-inancial Performance
Mean_CusRetention
We have more repeat sales in our company. It is easy to see repeat clients in our company.
If a client trade with us at least once, he/she remains with us forever.
Mean_CusSatisfaction
Our company ensures that customers´ product and/or service preferences are satisied. Our company delivers products and/or services that are exactly what customers want. Our company delivers products and/or services that exceed customers’ expectations.
Mean_Commitment
Our employees would be happy to make personal sacriices if it is too important for the company’s well being.
he bonds between our company and our employees are strong. Our employees have little or no commitment to this company.
Mean_JobSatisfaction
Most of our employees like their jobs in this company. Most of our employees think their supervisor treats them well. Most of our employees do not intend to work for a diferent company. Overall, our employees are quite satisied with their jobs.
Mean_OperateEiciency
Our product development cycle time has been reduced. Overall, our product development costs have been reduced. Our project duration has been reduced.
Mean_RelationEiciency
Our company has more open sharing of information with our customers. Our company has a more efective working relationship with our customers.
Our company has an enhanced commitment to work with our customers in the future. Our company has an overall more productive working relationship with our customers.
Mean_Innovation
Our company is fast in adopting process with the latest technological innovations. Our company uses up-to-date or new technology in the process.
Our company has enough new products introduced to the market. Our company is able to produce products with novelty features.
Mean_ProductNewness
It required a major learning efort or experience by customers to use our product. It took a long time before customers could understand our product’s full advantages. he product/service concept was diicult for customers to evaluate or understand.
Mean_ProductQuality
he quality of our products/services compares well with competitor products. Our products/services are of higher quality than competing products/services.
he quality of our current products/services compares well with others we have ofered in the past.
0.752
0.724
0.731
0.850
0.782
0.858
0.854
0.462
0.794
Construct Loadings CRa AVEb Financial Performance
Mean_ROA
Our company generates a relatively higher return on assets than our competitors do. Our business unit has a cost advantage compared to our major competitor.
Mean_ROI
Our company is highly efective in terms of capital investments.
he return on investment of our company has improved over the past three years.
Mean_SalesGrowth
Our company has remarkable customer growth over the past three years. he sales volume of our product oferings has increased over the past three years.
Mean_MarketShare
Our company is more efective in opening up new markets or expanding existing markets than our competitors.
Our company is able to change the market or lead customers’ needs in new directions.
Mean_Proftability
he proit of our company grew over the past three years.
Our company achieves higher proit margins, even when charging comparable prices, than our major competitors.
0.870
0.906
0.923
0.911
0.895
0.925 0.585
Notes:a Composite Reliability (CR) = (square of the summation of the factor loadings)/{(square of the summation
of the factor loadings) + (square of the summation of the error variances)}
b Average Variance Extracted (AVE) = (summation of the square of the factor loadings)/{( summation of the square of the
factor loadings) + (summation of the error variances.
Table 3
Discriminant validity of constructs
Construct Customer Focus
Employee Orientation
Entrepreneurial Orientation
Financial Performance
Non-inancial Performance
Technology Orientation
Top Management
Support
Customer Focus 0.802
Employee Orientation 0.680 0.779
Entrepreneurial
Orientation 0.569 0.631 0.867
Financial Performance 0.459 0.470 0.568 0.901
Non-inancial
Performance 0.505 0.548 0.601 0.818 0.765
Technology
Orientation 0.643 0.678 0.617 0.613 0.645 0.849
Top Management
Support 0.687 0.612 0.469 0.325 0.464 0.543 0.829
4.3
Assessment of the structural model
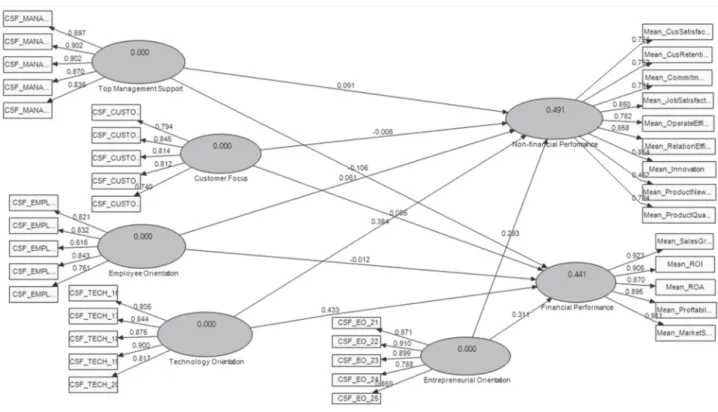
Secondly, Figure 2 and Table 4 present the results of the hypotheses testing. It was revealed that three hypotheses were found to be signiicantly related to the attitudes. he results have revealed that three hypotheses, namely, H2, H7, H8, H9, and H10 were supported whereas H1, H3, H4, H5, and H6 were not supported.
We also conducted a global it measure (GoF) assessment for PLS path modeling, which is deined as the geometric mean of the average communality and average R2 for endogenous
constructs (Tenenhaus et al., 2005) following
the procedure used by Akter, D’Ambra and Ray (2011). Following the guidelines of Wetzels et al. (2009), we estimated the GoF values which may serve as cut-of values for global validation of PLS models. he GoF value of 0.566 (average R2 was 0.466, average AVE was 0.687) for the
(main efects) model, which exceeds the cut-of value of 0.36 for large efect sizes of R2. As such,
it allows us to conclude that our model has better explaining power in comparison with the baseline values (GoFsmall=0.1, GoFmedium=0.25, GoFlarge=0.36) (Akter et al., 2011). It also provides adequate support to validate the PLS model globally (Wetzels et al., 2005).
Table 4
Path coeicients and hypothesis testing
Hypothesis Relationship Standard Beta Standard Error t-value Supported
H1 Top Management Support -> Non-inancial Performance 0.091 0.059 1.542 NO
H2 Top Management Support -> Financial Performance -0.106 0.065 1.647* YES
H3 Customer Focus -> Non-inancial Performance -0.006 0.074 0.081 NO
H4 Customer Focus -> Financial Performance 0.085 0.073 1.172 NO
H5 Employee Orientation -> Non-inancial Performance 0.051 0.077 0.668 NO
H6 Employee Orientation -> Financial Performance -0.012 0.079 0.155 NO
H7 Technology Orientation -> Non-inancial Performance 0.384 0.067 5.729** YES
H8 Technology Orientation -> Financial Performance 0.433 0.072 5.981** YES
H9 Entrepreneurial Orientation -> Non-inancial Performance 0.293 0.076 3.828** YES
H10 Entrepreneurial Orientation -> Financial Performance 0.311 0.074 4.206** YES
Note: *p<0.05, **p<0.01
5
Discussion
The present study was conducted among SMEs in Malaysia with a twofold research objective in mind. First, to examine the relationship between critical success factors and non-inancial performance; second, to investigate the relationship between critical success factors and inancial performance.
First, the statistical results have underlined that top management support is signiicantly and positively related to inancial performance. Consistent with previous indings, financial performance could be improved if top management emphasizes communicating the mission and vision throughout the entire organization, providing direction for employees to achieve and increase their level of performance (Demirbag et al., 2006; Fotopoulos & Psomas, 2009; Turkyilmaz et al., 2010). However, the indings of the present study have determined that top management support was not signiicantly
related to non-inancial performance. his could be due to the high power distance culture and hierarchical organizational structure in Malaysia, which means employees unlikely to voice their opinions and approach their bosses directly, thus limiting the development of relationship between top management and employees, and open communication required for innovation.
customers are more demanding than ever before, and thus it is increasingly diicult for SMEs to create valuable relationships with the customers in order to improve their performance. On the other hand, small number of employees in SMEs might be the reason which makes employee orientation less relevant in helping irms to achieve superior performance.
he analysis has indicated that technology orientation is signiicantly and positively related to both non-inancial performance and inancial performance. As evidenced by previous research, irms that are technology-oriented have better chance to achieve superior performance ( Al-Ansari et al., 2013; Trainor et al., 2010; Zhou & Li, 2010). his is because technology orientation can provides irms with capability to acquire rich technological information and new technologies that are useful for irms to come out with new solutions that are difficult to be imitated by their competitors (Gatignon & Xuereb, 1997; Grinstein, 2008).
As for entrepreneurial orientation, the results have shown that entrepreneurial orientation is positively related to both non-inancial performance and non-inancial performance. his result is consistent with previous indings that found that organizational performance could be improved if the irms put a strong emphasis on innovativeness, riskiness, proactiveness, competitive aggressiveness, as well as on autonomy in response to market changes (Gupta & Batra, 2015; Walter et al., 2006). This is further supported by Jabeen and Mahmood (2014) who state that irms adopting a strong entrepreneurial orientation are willing to take risks and thus they can innovate quickly, which would result in more innovative products and leading to superior performance.
6
Implications
This paper recognizes the relationship between the critical success factors determinants as the drivers of the efectiveness and success of organizational performance in Malaysia SMEs.
In continuation hereof, the adoption of the CSFs should not only be seen as a mean to satisfy external stakeholders, but similarly, the CSFs proved to be beneicial in optimizing internal processes of the organization.
From the managerial perspective, this research ofers a number of policy implications for SMEs managers and policy makers. The instrument used in this paper will be very useful to policy makers in SMEs as a tool for evaluating the effectiveness of their current organizational practices. Furthermore, SMEs managers should be aware that the intermediating impact of organizational performance (inancial and non-inancial performance) could only be enhanced by improving the critical success factors determinants. his study can help entrepreneurs, especially SMEs owners who often lack capital, to identify critical success factors, with which they can add most value to their business. he indings of this study suggest that, for the context of SMEs in Malaysia and current business environment, technology orientation and entrepreneurial orientation are the most important factors for entrepreneurs to improve their performance, and therefore entrepreneurs should prioritize their investments in these success factors.
test the relationships among these constructs, especially in SMEs and emerging country context.
7
Limitations and suggestions for
future research
Future studies may replicate this efort with slight modiications. his study has relied primarily on samples of SMEs entrepreneurs in Malaysia. herefore, it is not certain that the results can be generalized to larger organizations or other countries. Moreover, this study used cross-sectional data and thus it can only provide a static perspective on it. Comparative studies across industries, cultures, and professions, including control variables such as size and industry, should be sought in the future in order to improve understanding on the relationship between constructs included in this study. Besides that, several research approaches that can be conducted, such as case studies, focus group discussions, may permit deeper insights. Wherever possible, future research should endeavor to determine a more holistic quality management model. Research eforts could examine the efect of total quality management critical success factors on organizational performance. Another important avenue for future research is to carry out an in-depth interview with the senior management in order to gain more detail information. It is further suggested that research eforts should seek to complement the subjective measures by objective data in order to gain more reliable indings.
8
Conclusions
As point of departure in the stated research objectives, it was sought to investigate the critical success factors on the organizational performance (financial and non-financial) of the SMEs Malaysia companies. From the empirical analysis, five critical success factors on organizational performance were analyzed. It was revealed that two (technology orientation and entrepreneurial orientation) out of five proposed CSFs have signiicantly contributed to the organizational
performance of the SMEs. he implication of the empirical analysis indicates that having a high degree of technology orientation has direct impact on the organizational performance. his indicates that to improve the irm performance, it is essential for SMEs to cultivate technology orientation through the active acceptance of new technology. Particularly, having a high degree of entrepreneurial orientation in the SMEs is vital as it wields a positive inluence on organizational performance. Entrepreneurial orientation implies it can create competency in the irms that lead to improve performance in areas such as marketing, R&D, organizational renewal and delivering new products and services. hese indings thus indicate that it may be beneicial for SMEs irms to place special emphasis on technology orientation and entrepreneurial orientation.
References
Ahire, S. L., & Golhar, D. Y. (1996). Quality management in large vs. small. Journal of Small Business Management, 34(2), 1-13.
Akter, S., D’Ambra, J., & Ray, P. (2011). Trustworthiness in mHealth information services: an assessment of a hierarchical model with mediating and moderating efects using Partial Least Squares (PLS). Journal of the American Society for Information Science and Technology,
62(1), 100-116.
Al-Ansari, Y., Altalib, M., & Sardoh, M. (2013). Technology orientation, innovation and business performance: A study of Dubai SMEs. he International Technology Management Review, 3(1), 1-11.
Al Shaar, E. M., Khattab, S. A., Alkaied, R. N., & Manna, A. Q. (2015). The effect of top management support on innovation: he mediating role of synergy between organizational structure and information technology.
Ar, I. M., & Baki, B. (2011). Antecedents and performance impacts of product versus process innovation: Empirical evidence from SMEs located in Turkish science and technology parks.
European Journal of Innovation Management, 14(2), 172 – 206.
Aron O’C., & Liem V. N. (2011). Achieving customer satisfaction in services firms via branding capability and customer empowerment.
Journal of Services Marketing, 25(7), 489 – 496.
Awan, W. A. (2013). Impact of employee orientation on retention: a case of service sector organizations in Pakistan. Interdisciplinary Journal of Contemporary Research in Business, 5(4), 326-333.
Bagozzi, R. P., & Yi, Y. (1988). On the evaluation of structural equation models. Academy of Marketing Science, 16(1), 74-94.
Baum, T. (1995). Managing human resources in the European tourism and hospitality industry: a strategic approach. London: Chapman and Hall.
Bernardin, H. J., & Russell, J. E. A. (1993).
Human resource management: an experiential approach. New York: McGraw-Hill.
Blazevic, V., & Lievens, A. (2004). Learning during the new inancial service innovation process: antecedents and performance efects. Journal of Business Research, 57(4), 374-391.
Bryde, D. (2008). Perceptions of the impact of project sponsorship practices on project success.
International Journal of Project Management,
26(8), 800-809.
Chen, I. J., Paulraj, A., & Lado, A. (2004). Strategic purchasing, supply management and firm performance, Journal of Operations Management, 22(5), 505-523.
Chen, J. S., Tsou, H. T., & Huang, A. Y. H. (2009). Service delivery innovation antecedents and impact on firm performance. Journal of Service Research, 12(1), 36-55.
Chin, W. W. (1998). he Partial least squares approach for structural equation modeling. In G. A. Marcoulides (Ed.), Modern methods for business research (pp. 295-336). NJ: Lawrence Erlbaum.
Chin, W. W. (2010). How to write up and report PLS analyses. In V. Esposito Vinzi, W. W. Chin, J. Henseler, & H. Wang (Eds.), Handbook of partial least squares: concepts, methods and application (pp. 645-689). Germany: Springer.
Chong, A. Y. L., Chan, F. T. S., & Sim, O. J. J. (2011). Can Malaysian firms improve organizational innovation performance via SCM?
Industrial Management & Data Systems, 111(3),
410 – 431.
Chong, W. K., Shafaghi, M., & Tan, B. L. (2011). Development of a business-to-business critical success factors (B2B CSFs) framework for Chinese SMEs. Marketing Intelligence & Planning,
29(5), 517-533.
Covin, J. G., & Miles, M. P. (1999). Corporate entrepreneurship and the pursuit of competitive advantage. Entrepreneurship: heory & Practice,
23(3), 47-63.
Covin, J. G., & Slevin, D. (1989). Strategic management of small irms in hostile and benign environments. Strategic Management Journal,
10(1), 75-87.
Das, A., Paul, H., & Swierczek, F. (2008). Developing and validating total quality management (TQM) constructs in the context of hailand’s manufacturing industry. Benchmarking. An International Journal, 15(1), 52-72.
Day, G. S. (1994). he capabilities of market-driven organizations. Journal of Marketing, 58(4),
37-52.
performance. Public Relations Review, 38(2), 280-287.
Deming, W. E. (1986). Out of the crisis. Cambridge,
MA: MIT Press.
Demirbag, H., Tatoglu, E., Tekinkus, M., & Zaim, S. (2006). An analysis of the relationship between TQM implementation and organizational performance: Evidence from Turkish SMEs.
Journal of Manufacturing Technology Management,
1(6), 829-847.
Fernandes, A. A. C. M., Lourenço, L. A. N., & Silva, M. J. A. M. (2014). Influence of Quality Management on the Innovative Performance/Inluência da Gestão da Qualidade no Desempenho Inovador/Inluencia de la gestión de la calidad en el desempeño innovador. Revista Brasileira de Gestão de Negócios, 16(53), 575-593.
Flynn, B. B., Schroeder, R. G., & Sakakibara, S. (1995). he impact of quality management practices on performance and competitive advantage. Decision Sciences, 26(5), 659-692.
Fornell, C., & Larcker, D. F. (1981). Evaluating structural equation models with unobservable variables and measurement error. Journal of Marketing Research, 18, 39-45.
Fotopoulos, C. V., & Psomas, E. L. (2009). he structural relationships between TQM factors and organizational performance. he Total Quality Management Journal, 22(5), 539-552.
Ganeshasundaram, R., & Henley, N. (2007). Decision research correlates directly with better business performance. Marketing Intelligence & Planning, 25(1). 45-65.
Garrett, R. P., & Neubaum, D. O. (2013). Top management support and Initial strategic assets: A dependency model for internal corporate venture performance. Journal of Product Innovation Management, 30(5), 896-915.
Gatignon, H., & Xuereb, J. M. (1997). Strategic orientation of irm new product performance.
Journal of Marketing Research, 34(1), 77-90.
Gefen, D., Straub, D. W., & Boudreau, M. C. (2000). Structural equation modeling and regression: guidelines for research practice.
Communications of the AIS, 4(7), 1-76.
Griin, K. (2003). Economic globalization and institutions of global governance. Development and Change, 34(5), 789–807.
Grinstein, A. (2008). he relationships between market orientation and alternative strategic orientations: a meta-analysis. European Journal of Marketing, 42(½), 115-134.
Gronroos, C. (2004). he relationship marketing process: communication, interaction, dialogue, value. Journal of Business and Industrial Marketing,
19(2), 99-113.
Gupta, V. K., & Batra, S. (2015). Entrepreneurial orientation and firm performance in Indian SMEs: Universal and contingency perspectives.
International Small Business Journal, 1-23.
Hair, J. F., Black, W. C., Babin, B. J., & Anderson, R. E. (2010). Multivariate Data Analysis (7th ed.):
Prentice Hall.
Halawi, L., & McCarthy, R. (2008). Measuring students perceptions of blackboard using the technology acceptance model: A PLS approach.
E-learning, 26(2), 18.
Halim, H. A., Ahmad, N. H., & Ramayah, T. (2013). Manoeuvring the rough commercial landscape through outsourcing: repositioning Malaysian SMEs. In P. O. de Pablos (Ed.),
International business strategy and entrepreneurship: an information technolog y perspective: an information technology perspective (pp. 41-51). US: Business Science Reference.
top managers. Academy of Management Journal,
15(3), 193-206.
Hendricks, K. B.; Singhal, V. R. (1997). Does implementing an effective TQM programme actually improve operating performance.
Management Science, 43(9), 1258-1274.
Ho, T. C., Ahmad, N. H., & Ramayah, T. (2016). Competitive capabilities and business performance among manufacturing SMEs: Evidence from an emerging economy, Malaysia. Journal of Asia-Paciic Business, 17(1), 37-58.
Hung, R. Y. Y., Lien, B. Y. H., Fang, S. C., & McLean, G. N. (2010). Knowledge as a facilitator for enhancing innovation performance through total quality management. Total Quality Management, 21(4), 425-438.
Iqbal, S. M. J., Long, C. S., Fei, G. C., Ba’ith, S. M. L. A., & Bukhari, S. (2015). Moderating efect of top management support on relationship between transformational leadership and project success. Pakistan Journal of Commerce and Social Sciences, 9(2), 540-567.
Ireland, R. D., Hitt, M. A., & Sirmon, D. G. (2003). A model of strategic entrepreneurship: the construct and its dimensions. Journal of Management, 29(6), 963-990.
Jabeen, R., & Mahmood, R. (2014). Effect of external environment on entrepreneurial orientation and business per formance relationship. Social and Basic Sciences Research Review, 2(9), 394-403.
Kaplan, R. S., & Norton, D. P. (1996). The balanced scorecard: Translating strategy into action.
Harvard Business Review Press.
Kim, N., Im, S., & Slater, S. F. (2013). Impact of knowledge type and strategic orientation on new product creativity and advantage in high- technology irms. Journal of Product Innovation Management, 30(1), 136-153.
Kirca, A. H., Jayachandran, S., & Bearden, W. O. (2005). Market orientation: A meta-analytic review and assessment of its antecedents and impact on performance. Journal of marketing, 69(2), 24-41.
Lee, D., Choi, S., & Kwak, W. (2015). he efects of four dimensions of strategic orientation on irm innovativeness and performance in emerging market small- and medium-size enterprises.
Emerging Markets Finance and Trade, 50(5),
78–96.
Lee, S. M., Kim, S. T., & Choi, D. (2012). Green supply chain management and organizational performance. Industrial Management & Data Systems, 112(8), 1148- 1180
Liu, H., Ke, W., Wei, K. K., & Hua, Z. (2013). Efects of supply chain integration and market orientation on irm performance: Evidence from China. International Journal of Operations & Production Management, 33(3), 322-346.
Lo, M. C., Mohamad, A. A., T. Ramayah, & Wang, Y. C. (2015). Examining the efects of leadership, market orientation and leader member exchange (LMX) on organizational performance.
Inzinerine Ekonomika- Engineering Economics,
26(4), 409-421.
Lumpkin, G. T., & Dess, G. G. (1996). Clarifying the entrepreneurial orientation construct and linking it to performance. Academy of Management Review, 21, 135-172.
Mu, J., & Benedetto, C. A. D. (2011). Strategic orientations and new product commercialization: mediator, moderator, and interplay. R&D Management, 41(4), 337-359.
Narver, J. C., & Slater, S. F. (1990). he efect of a market orientation on business proitability.
Journal of Marketing, 54(5), 20–35.
performance implications. Journal of Marketing,
66(4), 25-39.
Noe, R. A., & Wilk, S. L. (1993). Investigation of the factors that inluence employee’s participation in development activities. Journal of Applied Psychology, 78(22), 1291-1302.
Nwokah, N. G., & Maclayton, D. W. (2006). Customer focus and business performance: he study of food and beverages organizations in Nigeria.
Measuring Business Excellence, 10(4), 65-75.
Podsakof, P. M., MacKenzie, S. B., Lee, J. Y., & Podsakof, N. P. (2003). Common method biases in behavioral research: A critical review of the literature and recommended remedies. Journal of applied psychology, 88(5), 879.
Powell, T. (1995). Total quality management as competitive advantage: A review and empirical study. Strategic Management Journal, 16(1): 5-37.
Prieto, I. M., & Revilla, E. (2006). Learning capability and business performance: A non-inancial and non-inancial assessment. he Learning Organization, 13(2), 166-185.
Rauch, A., & Frese, M. (2000). Psychological approaches to entrepreneurial success: A general model and an overview of indings. International Review of Industrial and Organizational Psychology, 15, 101-142.
Rauch, A., Wiklund, J., Lumpkin, G. T., & Frese, M. (2009). Entrepreneurial orientation and business performance: An assessment of past research and suggestions for the future. Entrepreneurship heory and Practice, 33(3), 761-787.
Ringle, C. M., Wende, S., & Will, A. (2005).
SmartPLS 2.0. Hamburg: SmartPLS, http://www.
smartpls.de.
Salaheldin, I. (2009). Critical success factors for TQM implementation and their impact on performance of SMEs. International Journal of
Productivity and Performance Management, 58(3), 215-237.
Saravanan, R., & Rao, K. (2006). Development and validation of an instrument for measuring total quality service. Total Quality Management and Business Excellence, 17(6), 733-749.
Sexton, D. L., & Upton. N. B. (1987). Evaluation of an innovative approach to teaching entrepreneurship. Journal of Small Business
Management, 25(1), 35- 43.
Simon, A., Bartle, C., Stockport, G., Smith, B., Klobas, J. E., & Sohal, A. (2015). Business leaders’ views on the importance of strategic and dynamic capabilities for successful inancial and non-inancial business performance. International Journal of Productivity and Performance Management, 64(7), 908-931.
Slack, N., Chambers, S., & Johnston, R. (2010).
Operations management. Prentice Hall.
Slater, S. F., Hult, G. T. M., & Olson, E. M. (2010). Factors inluencing the relative importance of marketing strategy creativity and marketing strategy implementation efectiveness. Industrial Marketing Management, 39(4), 551-559.
Slater, S. F., & Narver, J. C. (1998). Research notes and communications customer-led and market-oriented: Let’s not confuse the two. Strategic management journal, 19(10), 1001-1006.
Song, X. M., & Parry, M. E. (1997). A cross-national comparative study of new product development processes: Japan and the United States. Journal of Marketing, 61(2), 1-18.
Sun, H. (2000). Total quality management, ISO 9000 and performance improvement.
International Journal of Quality and Reliability Management, 17(2), 168-179.
Whole Sale and Retail Industries of Malaysia:-A Conceptual Model. Review of Integrative Business and Economics Research, 4(3), 33.
Tenenhaus, M., Esposito Vinzi, V., Chatelin, Y. M., & Lauro, C. (2005). PLS path modeling,
Computational Statistics & Data Analysis, 48(1), 159-205.
Trainor, K., Rapp, A., Beitelspacher, L.S., & Schillewaert, Niels. (2010). Integrating information technology and marketing: And examination of drivers and outcomes of e-marketing capability. Industrial Marketing Management, 40(1), 1–13.
Turkyilmaz, A., Tatoglu, E., Zaim, S., & Ozkan, C. (2010). TQM practices and business performance in SMEs. In V. Esposito Vinzi, W. W. Chin, J. Henseler, & H. Wang (Eds.),
Handbook of partial least squares (pp. 605-621 ). Verlag: Springer.
Umble, E. J., Haft, R. R., & Umble, M. M. (2003). Enterprise resource planning: implementation procedures and critical success factors. European Journal of Operational Research, 146, 241-257.
Utsch, A., & Rauch, A. (2000). Innovativeness and initiative as mediators between achievement orientation and venture performance. European Journal of Work and Organizational Psychology, 9(1), 45-62.
Vazquez, M. V., Silva, F. J. C., & Ruiz, D. M. (2012). Does the firm’s market innovation behaviour influence innovation’s success?
Management Decision, 50(8), 1445-1464.
Vyas, V., Raitani, S., Roy, A., & Jain, P. (2015). Analysing critical success factors in small and medium enterprises banking. World Review of Entrepreneurship, Management and Sustainable Development, 11(1), 106-123.
Wales, W. J., Parida, V., & Patel, P. C. (2013). Too much of a good thing? Absorptive capacity,
irm performance, and the moderating role of entrepreneurial orientation. Strategic Management Journal, 34(5), 622–633.
Walter, A., Auer, M., & Ritter, T. (2006). he impact of network capabilities and entrepreneurial orientation on university spin-of performance.
Journal of Business Venturing, 21, 541-567.
Wetzels, M., Odekerken-Schroder, G., van Oppen, C. (2009). Using PLS path modeling for assessing hierarchical construct models: guidelines and empirical illustration. MIS Quarterly, 33(1),
177-196.
Wiklund, J., & Shepherd, D. (2005). Entrepreneurial orientation and small business performance: a configurationally approach.
Journal of Business Venturing, 20, 71-91.
Yusof, S., & Aspinwall, E. (2000). Critical success factors in small and medium enterprises: survey results. Total Quality Management, 11(4), 248-462.
Zebal, M. A., & Goodwin, D. R. (2011). Market orientation in a developing nation antecedents, consequences and the moderating effect of environmental factors. Marketing Bulletin, 22(1), 1-23.
Zhang, J. (2010). Employee orientation and performance: An exploration of the mediating role of customer orientation. Journal of Business Ethics, 91, 111-121.
Zhou, K. Z., & Li, C. B. (2010). How strategic orientations inluence the building of dynamic capability in emerging economies. Journal of Business Research, 63(3), 224-231.
Zhou, K. Z., Yim, C. K., & Tse, D. K. (2005). he efects of strategic orientations on technology-and market-based breakthrough innovations,
Journal of Marketing, 69, 42-60.
Supporting Agencies:
his research was supported by Universiti Malaysia Sarawak and Ministry of Higher Education, Malaysia under the Exploratory Research Grant Scheme [ERGS/SS05 (01)/1013/2013(10)].
About the authors:
1. May Chiun Lo, PhD in Management from Universiti Sains Malaysia, Malaysia. E-mail: [email protected] 2. Yin Chai Wang, PhD in GIS from Universiti Sains Malaysia, Malaysia. E-mail: [email protected] 3. Constance Rinen Justin Wah, MSc in Business Administration, Universiti Malaysia Sarawak, Malaysia. E-mail: [email protected]
4. T. Ramayah, MSc in Business Administration, Universiti Sains Malaysia, Malaysia. E-mail: [email protected]
Contribution of each author:
Contribution May Chiun Lo Yin Chai Wang Constance Rinen
Justin Wah T. Ramayah
1. Deinition of research problem √
2. Development of hypotheses or research questions
(empirical studies) √
3. Development of theoretical propositions (theoretical work) √ √
4. heoretical foundation /Literature review √
5. Deinition of methodological procedures √
6. Data collection √ √
7. Statistical analysis √ √
8. Analysis and interpretation of data √ √
9. Critical revision of the manuscript √