ABSTRACT: In areas cultivated with oil palm, typically mechanized field operations using heavy vehicles may negatively affect soil physical properties and productivity. The aim of this study was to evaluate soil physical quality in an area cultivated with oil palm by monitoring the temporal variation of the soil water content and relating it to the critical limits of the least limiting water range. Soil bulk density (Bd), soil penetration resistance (SR), least limiting water range (LLWR), and water stress days (WSD) were used to assess soil physical quality in planting rows (PR) and the traffic zone (TZ) at depths 0-20, 20-40, and 40-60 cm. The Bd was higher and the LLWR was reduced in TZ only at the surface layer. The effect of temporal variation in soil water content on the soil physical quality was higher in TZ, mainly in subsurface layers. Bd and LLWR did not affect the fresh fruit bunch production; however, WSD in TZ at 20-40 and 40-60 cm layers provided evidence of effects of temporal variation of soil water content on oil palm productivity. Keywords: Elaeis guineensis Jacq., soil physical quality, soil compaction, water stress
Least limiting water range for oil palm production in Amazon region, Brazil
Michel Keisuke Sato1, Herdjania Veras de Lima1*, Raphael Leone da Cruz Ferreira1, Sueli Rodrigues2, Álvaro Pires da Silva2 †
1Federal Rural University of Amazon/Institute of Agriculture Science, Av. Perimetral, 2501 − 66077-830 − Belém, PA − Brazil.
2University of São Paulo/ESALQ − Dept. of Soil Science, Av. Pádua Dias, 11, C.P. 09 − 13418-900 − Piracicaba, SP − Brazil.
†In memoriam
*Corresponding author <[email protected]>
Edited by: Paulo Cesar Sentelhas
Received October 27, 2015 Accepted May 31, 2016
Introduction
The oil palm Elaeis guineensis Jacq. is a palm tree of African origin that is notable for its high oil produc-tion per unit area. In Brazil, its cultivaproduc-tion is concen-trated in the northern and northeastern regions and Pará is the main producing state with approximately 90 % of Brazilian production and 85 % of the cultivated area. There is a trend toward increasing the oil palm cultiva-tion area because of its potential for biodiesel produccultiva-tion (Ramalho-Filho et al., 2010; Carr, 2011).
In extensive areas cultivated with oil palm, mecha-nization, usually with heavy vehicles, is used throughout most field operations and machinery traffic often occurs under unfavorable soil moisture conditions. Therefore, the overuse of heavy machinery may negatively affect soil physical properties such as porosity, bulk density, mechanical impedance, and water availability, resulting in soil compaction and loss of soil capacity to provide proper physical conditions for root system development (Zuraidah et al., 2012).
The least limiting water range (LLWR) is defined as the range of soil water content in which there are minimal limitations to plant growth considering water availability, air-filled porosity, and soil mechanical resis-tance (Silva et al., 1994). The amplitude of LLWR indi-cates the magnitude at which the soil structure restricts plant growth, that is, in soils with a narrow LLWR, water temporal variations may often predispose crops to physi-cal stress because of poor aeration when the soil is wet or excessive penetration resistance when the soil water content is low (Bengough et al., 2006).
Monitoring temporal variation of the soil water content and evaluating how often this variation occurs within or outside the LLWR are useful tools to make in-ferences regarding conditions in which plants are more or less subject to physical stress in terms of water avail-ability, aeration, and resistance to root penetration. The
LLWR concept has been used in a range of crops, and this information can help to minimize the impacts of soil structure compaction (Asgarzadeh et al., 2010; Fidalski et al., 2010a; Leão et al., 2006; Tormena et al., 1999). How-ever, to date, no study has evaluated the LLWR in oil palm cultivation. Thus, the objective of our study was to evalu-ate the soil physical quality in an area cultivevalu-ated with oil palm by monitoring the temporal variation of the soil wa-ter content and relating it to the critical LLWR limits.
Materials and Methods
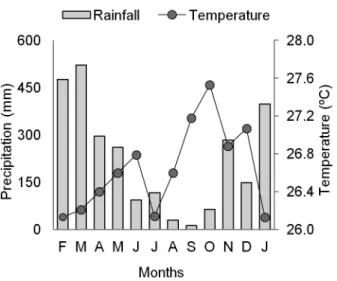
This study was conducted in the municipality of Thailand, Pará State, Brazil (2°28’49” S; 48°46’37” W; 25 m above sea level). The total rainfall from Feb 2013 to Jan 2014 (evaluation period) was 2,999 mm, with a total of 11.80 mm of rain in the driest month (Sept 2013) and 521.80 mm in the wettest one (Mar 2013) (Figure 1). The soil in this area is classified as Typic Hapludox (Soil Sur-vey Staff, 2010). The soil organic carbon content (Sparks, 1996) and particle-size distribution (Gee and Bauder, 1986) up to 60 cm depth are presented in Table 1.
The evaluated area covers 34 ha and has been culti-vated with oil palm since 1984, with plants spaced at 9 m × 9 m (143 plants per hectare) in an equilateral triangle design. In 2010, the plantation was renewed using the va-riety Deli × Ghana.Seedlings were planted in the same rows between older plants, keeping the same triangular design. Crop residues from previous plants were depos-ited between planting rows (stacking zone) to decompose and be gradually incorporated into the organic material of the soil. Thus, spaces adjacent to planting rows (inter-row) were intercalated between the stacking and traffic zones.
kg or a pulverizing tank (weighing 1000 kg) and capable of holding 2000 L was used.
The legume Pueraria phaseoloides was kept in in-terrows to fix nitrogen in the soil, prevent weed growth, keep the soil covered, and incorporate organic matter.
For this study, 30 plants were selected from six uniformly distributed lines and the weight of the fresh fruit bunch (FFB) was measured every month during Feb 2013 - Jan 2014. During the same period, the soil water content was monitored at depths 0-20, 20-40, and 40-60 cm at points 2.4 m away from selected plants, as recommended by Peralta et al. (1985), in two positions: planting row (PR) and traffic zone (TZ). The gravimet-ric soil water content was measured according to Gard-ner (1986) and the monitoring depth was defined based on the effective depth of the root distribution of the oil palm crop, which was 60 cm (Carr, 2011).
Adjacent to points where the soil water content was monitored, the undisturbed soil samples were col-lected from the intermediate section 0-20, 20-40, and 40-60 cm layers using soil cores with 5 cm diameter and height to determine soil bulk density (Bd) (Blake and Hartge, 1986), soil penetration resistance curve (SRC), and soil water retention curve (SWRC).
A total of 180 undisturbed samples (30 points × 3 layers × 2 positions) were collected. In the laboratory,
these samples were saturated by gradually raising the wa-ter level over 48 h, weighed and the samples were grouped into six groups of ten. Then, one sample from each group was subjected to one of the following matric potentials: -0.003, -0.006, -0.01, -0.03, -0.06, -0.1, -0.3, -0.6, -1, and -1.5 MPa in a Richard’s pressure plate (Klute, 1986). When wa-ter equilibrium was reached at each potential, the samples were weighed, and their soil penetration resistance (SR) was determined using a static electronic penetrometer with rod displacement at a constant speed of 10 mm min−1,
sup-plied with a conical tip and penetration angle 60°. After determining SR, the samples were oven dried at 105 °C until they reached a constant mass to determine the water content (θ) and Bd (Blake and Hartge, 1986).
To fit the SRC, the non-linear model proposed by Busscher (1990) was used following the procedures de-scribed by Silva et al. (1994):
SR = aθb Bdc (1)
where: SR is the soil penetration resistance (MPa); θ is the volumetric water content (m3 m−3); Bd is the soil bulk
density (Mg m−3); and a, b, and c are the model fitting
parameters.
The SWRC was fitted to the equation adapted from Williams et al. (1993), which incorporates the effect of Bd into the model that expresses θ as a function of the matric potential (Ψ):
θ = exp(d + eBd) Ψf (2)
where:
Ψ
is the matric potential (MPa) in absolute value and d, e, and f are the model fitting parameters.To obtain the parameters used to determine LLWR, a non-linear regression based on SWRC and SRC was performed using the statistical software SAS (Statistical Analysis Software, version 9.0), as described by Leão et al. (2005).
After estimating all of the model parameters (a,
b, c, d, e, f), the soil moisture values at field capacity or Ψ = -0.01 MPa (θFC), at wilting point or Ψ = -1.5 MPa (θWP) (Cassel and Nielsen, 1986), at air-filled porosity 10 % (θAFP) (Grable and Siemer, 1968), for which the soil penetration resistance reached the critical value of 2.5 MPa (θSR) (Sene et al., 1985), were obtained.
Although the SR value of 2 MPa is considered criti-cal in most studies, values ranging from 1.5 to 3.5 MPa are suggested as critical for some crops (Bengough and Mul-lins, 1990; Oliveira et al., 2016). Furthermore, according to Ehlers et al. (1983), root growth is normal at SR ≥ 3.5 in the field, since, in this condition, pores sizes are more heterogeneous, especially related to biopores. Thus, since there is no information about SR critical limits for root growth of oil palm and considering the characteristics of the area (perennial crop and legume planting in the inter-rows), an intermediate value between the limits suggested in the literature (1.5 to 3.5 MPa) was adopted.
Figure 1 − Mean monthly precipitation and temperature during between Feb 2013 and Jan 2014.
Table 1 − Results of particle size analysis (clay, silt and sand) and organic carbon content in three soil layers.
Layer (cm) Textural class (< 2 µm)Clay (2-50 µm)Silt (50-200 µm)Sand OC
--- g kg−1 ---0-20 Sand clay loam 243.0 69.2 687.9 7.33
20-40 Sand clay 366.9 61.9 571.2 5.57
40-60 Sand clay 412.5 50.4 537.1 2.26
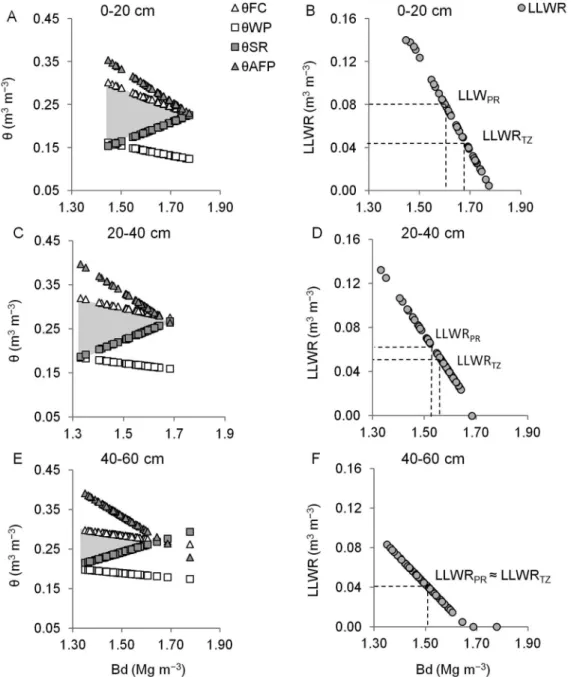
For each Bd, we calculated LLWR as the difference between the upper and lower limits, where the upper limit is the drier θ of either θFC or θAFP,and the lower limit is the wetter θ of either θWP or θSR.(Silva et al., 1994).
The effect of a water deficit was evaluated, caused by temporal variation of the soil water content, on oil palm productivity, using the term water stress day (WSD) proposed by Benjamin et al. (2003) to character-ize in-season water dynamics and relate the effects of soil condition to plant growth. WSD was determined by a simple calculation that accounts for water stress (soil water content below the lower LLWR limit) during the period evaluated. Cumulative WSD was calculated by:
WSD = Σ(θd – θLL) × 100 (3)
where: θdis the soil water content ascertained during monitoring and θLLis the lower limit of LLWR for the condition θd < θLL; otherwise, WSD is considered zero.
The uniformity or heterogeneity of the data was analyzed using the descriptive statistics and the means of the sampling positions (PR and TZ) were compared by the Tukey’s test at a 5 % significance level. The data on Bd, SR, θ, and Ψ were fitted using nonlinear regression models for the three layers and incorporated the variable sampling position.
To describe the effect of changes in the soil physical properties and the temporal water variation on oil palm production, we performed a multiple regression analysis on the soil physical quality indicators (Bd, LLWR, and WSD) for each layer and sampling position (independent variables) and FFB production (dependent variable). The significance level of the parameters (p≤ 0.15) was used to select variables from the model, according to Silva et al. (1994).
Results
The descriptive analysis (Table 2) showed a wide variation in the Bd, SR, and θ values in the two positions and three layers, which is desirable for fitting SWRC and SRC. SR is highlighted by the high coefficient of varia-tion.
The sampling position revealed differences in Bd only in the 0-20 cm layer (Table 2), in which Bd was higher in TZ. In the other layers, there was no difference in Bd with respect to the sampled position. In addition to the higher Bd value, the TZ position in the 0-20 cm layer also had the lowest θ and highest SR values. In the other layers (20-60 cm), there were no changes in these two soil attributes regarding the sampling position.
Table 3 shows the fitted equations of SWRC and SRC for the three layers. The nonlinear models used to fit SRC (Busscher, 1990) and SWRC (Williams et al., 1993) were appropriate for the data distribution (p≤ 0.0001). The model used for SRC explained > 97 % of the vari-ability in the penetration resistance data while the
mod-Table 2 − Descriptive analysis of some soil physical properties for the three layers, using undisturbed samples.
Layer (cm) Planting row Traffic zone Mean Min. Max. CV (%)
Bulk density (Mg m−3)
0-20 1.60 b 1.68 a 1.64 1.45 1.77 5
20-40 1.53 a 1.55 a 1.54 1.33 1.68 5
40-60 1.50 a 1.50 a 1.50 1.35 1.78 6
Soil water content (m3 m−3)
0-20 0.222 a 0.190 b 0.206 0.199 0.345 30 20-40 0.239 a 0.234 a 0.237 0.141 0.348 25 40-60 0.250 a 0.245 a 0.248 0.134 0.431 21 Soil penetration resistance (MPa)
0-20 2.22 b 3.90 a 3.06 0.78 12.48 79
20-40 3.59 a 4.14 a 3.87 0.54 12.28 91 40-60 3.48 a 3.67 a 3.58 0.57 10.83 91 CV% = coefficient of variation; Min. = minimum value; Max. = maximum value; Means followed by the same letters, in each row, did not differ by the Tukey test (p≤ 0.05).
Table 3 − Fitted models for soil penetration resistance curve and soil water retention curve for the three layers.
Layer
(cm) Equation R2 F
Soil penetration resistance curve (SR = a θb Bdc)
0-20 SR = 0.0131 θ−2.053 Bd3.848 0.98 656.78** 20-40 SR = 0.0036 θ−3.113 Bd4.703 0.97 482.16** 40-60 SR = 0.0005 θ−4.577 Bd5.167 0.99 831.28**
Soil water retention curve (θ = exp(d + eBd) Ψf)
0-20 θ = exp(-0.6016 + (-0.8081 Bd)) Ψ−0.125 0.99 1592.06** 20-40 θ = exp(-1.0883 + (-0.4154 Bd)) Ψ−0.109 0.99 7581.95** 40-60 θ = exp(-1.1830 + (-0.2964 Bd)) Ψ−0.081 0.99 2794.19** SR = Soil penetration resistance; θ = Soil water content; Bd = Bulk density; Ψ = Matric potential; ** Significant at 1 % probability level (p ≤ 0.0001).
el used for SWRC explained 99 % of the variation in the soil water content (Table 3).
The parameters estimated for the SRC model con-firm that SR is negatively related to θ and positively re-lated to Bd. For SWRC, θ varied negatively with both Bd and Ψ.
Figures 2A, C and E show the variation of θ as a function of Bd considering the limiting factors related to the water potential, aeration, and penetration resistance in the three layers. Increasing Bd had a negative effect on the soil capacity to retain water. The available water (θFC − θWP) presented a slight negative correlation with increas-ing Bd. Air-filled porosity (θAFP) was not a limiting factor for the soil in any layer of the site studied. This result can be observed by the higher θ values at the minimum air-filled porosity (θAFP) in relation to θFC (Silva et al., 1994). In the 0-20 cm layer, θFC and θWP represented the LLWR upper and lower limits, respectively, for Bd values below 1.47 Mg m−3. From this point onward, the
available water range. For all other layers, θSR was the lower limit for the entire Bd range. Increasing Bd led to a LLWR reduction until it became null, where the curves intersect. At this point, it was determined the critical soil bulk density (Bdc) for the three layers, which were 1.77, 1.68, and 1.65 Mg m−3 for the 0-20, 20-40 and 40-60 cm
layers, respectively (Figures 2B, D, and F).
Taking into account the Bd means for PR and TZ sampling positions (Table 2) in the 0-20 cm layer, LLWR was lower in TZ compared to PR (Figure 2B). In the
sub-surface layers (20-40 and 40-60 cm), there were no dif-ferences in the LLWR with respect to the sampling posi-tion (Figures 2D and F).
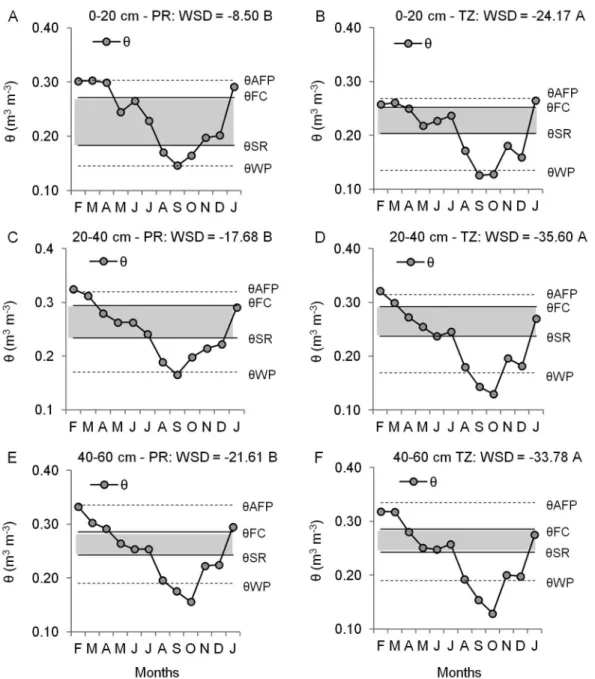
Figures 3A, B, C, D, E and F illustrate the monthly variation in θ during a year, in relation to LLWR, for two positions and three depths. Considering LLWR calcu-lated from the mean values of Bd for each position and layer (Table 2), it was noted a wide variation in θ during the evaluated period, with a maximum 0.33 m3 m−3 and
a minimum 0.13 m3 m−3.
In the PR position in the 0-20 cm layer, the wa-ter content was out of LLWR only in a few occasions, particularly during Aug to Oct (Figure 3A). Except for this position in this layer, θ during the monitoring period was often outside LLWR, especially for the lower limit. However, we also noted some means of θ above the up-per limit. While in the monitoring up-period, the θ value exceeded the upper limit especially in the months of Feb and Mar (Figure 3C), the excess water was not a
limit-ing factor in the area because the soil (Typic Hapludox) is deep and well drained and the high value of θ was attributed to the high precipitation levels prior to soil sampling. This condition did not persist for very long since the water quickly drained. Therefore, the oil palm plants underwent stress due to the low water content and high SR.
The period from Aug to Dec showed the soil wa-ter content more often below the lower LLWR limit.
ing the fitted equation determined for SRC (Table 3), the mean values of Bd (Table 2) and θ in Sept (driest month) (Figures 1 and 3A, B, C, D, E and F), SR for the three layers in PR and TZ positions were calculated. The SR values were 3.9, 6.6, and 9.9 MPa for the 0-0, 20-40, and 40-60 cm layers, respectively, in the PR position and 6.4, 12.8, and 22.8 MPa for the TZ position, respectively. Moreover, the θ value in this month was below the per-manent θWP.
The water stress period experienced by the plants, due to temporal variation in the soil water content, was quantified through the WSD values. The greatest stress occurred in the TZ position, regardless of the measured layer (p≤ 0.05; Figures 3A, B, C, D, E and F). WSD was higher in the 20-40 and 40-60 cm layers.
The FFB production during the studied period varied widely (Figure 4) with a minimum 0.20 t ha−1
(July) and a maximum 2.93 t ha−1 (Sept). The analysis
of variance (ANOVA) was not significant (p > 0.05) and the low coefficient of determination (R2) values from the
multiple regression relating Bd and LLWR with FFB re-vealed that these indicators did not affect the oil palm production during the evaluation period. However, the WSD variation contributed to the FFB fluctuation (p≤
0.05) and was responsible for > 73 % of variability in FFB production (Table 4).
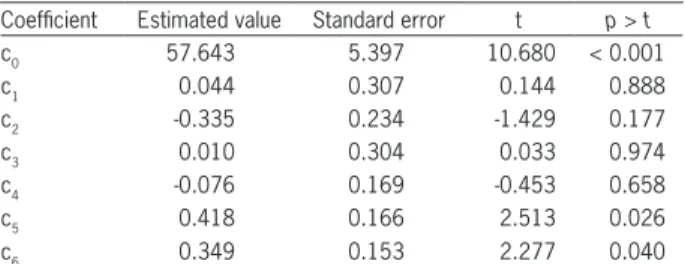
Analyzing the parameters obtained from the multi-ple regressions between WSD and FFB for the three lay-ers and two sampling positions, we observed that only the WSD variability in the 20-40 and 40-60 cm layers in the TZ position, were significant to estimate FFB (p ≤
0.15) (Table 4). These results showed that this sampling position (TZ) is better to predict the oil palm production from the WSD variability. Thus, the multiple regression equation is given by:
FFB = c0 + c5 WSD20-40TZ + c6 WSD40-60TZ
where: FFB is the fresh fruit bunch (t ha−1); WSD 20-40TZ
and WSD40-60TZ are the water stress periods in the traffic zone in the 20-40 and 40-60 cm layers, respectively; and c0, c5,andc6 are the equation fit parameters.
Discussion
Since SWRC and SRC were determined for a range of matric potentials, the high SR variability (CV > 79 %) was due to the wide variation in the soil water content. These results are consistent with those of other studies (Silva et al., 1994; Fidalski et al., 2010b) and highlight the fundamental role of θ to prevent the soil from reach-ing limitreach-ing the SR values for plant growth.
The differences between Bd and SR for the PR and TZ positions in the surface layer (0-20 cm) are related to field crop management. Soil tillage with plowing and harrowing is performed only once during crop implanta-tion, and from then onward, the soil is no longer tilled throughout the entire production cycle. Therefore, the effect of soil compaction on the traffic zone due to the passage of machinery accumulates over the years.
The observed relationship between SR, θ, Bd, θ, and Ψ from the model parameters (Table 3) are consis-tent with those reported in several studies relating these variables (Silva et al., 1994; Leão et al., 2005). Typically, an increase in Bd is followed by a concomitant increase in the volume of micropores and a reduction in the mac-ropores, as reported in many studies (Leão et al., 2006; Olibone et al., 2010; Wilson et al., 2013). However, a different relation has also been reported (Fidalski et al., 2010a; Safadoust et al., 2014; Cecagno et al., 2016) and was the result of a reduction in the volume of pores, both because of macroporosity and microporosity. With increasing Bd, the volume of micropores was slightly re-duced, resulting in the decrease of θFC.
Considering the θ value within the available wa-ter (θAFP −θWP), there was no limitation due to aera-tion porosity (Figures 2A, C and E). These results agree with those shown by Silva et al. (1994) who considered this a common behavior for soils of similar texture. The Figure 4 − Variability of the fresh fruit bunch (FFB) production during
the assessment period (Feb 2013 to Jan 2014).
Table 4 − Multiple regression and coefficient analysis for the relationship of fresh fruit bunches (FFB) production with water stress day (WSD), in three layers and two sampling sites: * FFB = c0 + c1 WSD0-20PR + c2 WSD20-40PR + c3 WSD40-60PR + c4 WSD0-20TZ+ c5 WSD20-40TZ + c6 WSD40-60TZ
Coefficient Estimated value Standard error t p > t
c0 57.643 5.397 10.680 < 0.001
c1 0.044 0.307 0.144 0.888
c2 -0.335 0.234 -1.429 0.177
c3 0.010 0.304 0.033 0.974
c4 -0.076 0.169 -0.453 0.658
c5 0.418 0.166 2.513 0.026
c6 0.349 0.153 2.277 0.040
higher number of macropores in coarser soils, resulting from the arrangement of larger particles with regard to smaller ones, allows Bd to vary widely without impair-ing soil aeration.
When the upper and lower limits of LLWR coin-cide with the available water, the soil physical restric-tions on plant growth are minimal. This condition was observed in less than 1 % of samples from the surface layer, indicating that even with available water, there is a great potential, especially in relation to SR, for obstacles to root growth in the oil palm, primarily in subsurface layers where the LLWR lower limit was θSR in the entire Bd range, that is, all samples showed potential for SR to limit root growth.
Many studies have suggested SR as the main phys-ical attribute that reduces LLWR in tropphys-ical soils (Silva et al., 1994; Beutler et al., 2007; Fidalski et al., 2010a; Wil-son et al., 2013). This is because SR is highly susceptible to the soil physical variations such as Bd, θ, clay content, and soil organic carbon (Safadoust et al., 2014).
The finding that all Bd means were above 90 % of Bdc confirms the strong potential for the soil physi-cal properties to restrict root development in oil palm. This is because the closer the Bdc, the lower the LLWR (Figures 2B, D and F), therefore, the 0-20 cm layer, in the TZ position, presents a higher probability that temporal variation in the θ value will restrict root growth, due to the high SR (Silva and Kay, 1997).
Studies on soil oxygen diffusion indicate that when the values of aeration porosity fall below 0.10 m3 m−3,
the oxygen diffusion rate and gas exchange in the soil become insufficient to supply root demand, hindering plant growth (Grable and Siemer, 1968; Beutler et al., 2007). This restriction may occur due to high θ and/or high Bd. Little is known about the oil palm response to reduced soil aeration caused by water excess. However, its origins in regions that experience periodic flooding in-dicate that oil palm can withstand low levels of soil aera-tion without compromising the growth provided that the flooding is not permanent (Carr, 2011). Considering the wettest months, even in Feb when aeration porosity reached a critical level in the 20-40 cm layer, conditions above the field capacity and below 10 % aeration poros-ity in the other layers (Figures 3A, B, C, D, E and F) may have enabled efficient gas exchange in the root system of oil palm.
Similar results, shown in Figures 2A, C and E, was reported by Beutler et al. (2007) in a study conducted with soybean crops (Glycine max L.) in tropical soils. Ac-cording to these authors, as long as there is a minimum of 10 % aeration, root growth is not limited. Therefore, using the field capacity to indicate soil physical limita-tion during temporal varialimita-tions in θ seems to be rather irrelevant, as long as the θ value is above this limit, if it does not exceed the minimum aeration porosity (10 %), plant growth is not affected.
Despite its high demand for water, oil palm has a great ability to survive even in dry periods due to its
ef-ficient stomatal system and its ability to reduce leaf area when availability of soil water is low. These mechanisms restrain photosynthesis and the mobility of photoassimi-lates to reproductive sites, resulting in fluctuations in crop yield (Ramalho-Filho et al., 2010).
Since θ controls various soil physical properties that directly affect plant physiological processes (Letey, 1985), the reduction in θ may have restricted oil palm development, due to the high SR, above 2.5 MPa from Aug to Dec. This restriction was enhanced in Sept and Oct due to soil water deficit (θ < θWP) (Figures 3A, B, C, D, E and F).
The soil physical condition was altered in the sur-face layer in TZ (higher Bd and lower LLWR) compared to the PR position. This situation may have reduced the capacity for water infiltration to subsurface layers, re-sulting in a decrease in water storage in the soil, and consequently, increasing the period of hydrophysical stress during the evaluation period.
We found no relationship between Bd and LLWR and FFB. This result indicates that other factors contrib-uted to variability in the FFB production. Another rea-son may be related to the critical limits used. Since there are no studies that evaluate the LLWR limits for oil palm production, we used well-known limits for these plant species to check their suitability. However, further re-search is needed to determine the specific critical values for oil palm. Benjamin et al. (2003) stated that indicators of soil quality such as Bd and LLWR are static and, thus, may not be suitable to assess crop response when there are limitations due to water availability in the soil. In this case, it is adequate to include temporal variation in θ during the assessment period.
Corroborating the findings of Benjamin et al. (2003), the greater R2 obtained from multiple regression
between FFB and WSD indicated the higher sensitivity of WSD as an indicator of soil physical quality when the temporal variation in θ limits plant growth. Benjamin et al. (2003) believed that this indicator obtained from LLWR could reveal and quantify the period when the plant was subjected to soil physical conditions that re-stricted its growth and could facilitate the monitoring of soil quality in order to adopt soil management practices that allow to achieve sustainable crop production.
The multiple regression analyses for FFB in rela-tion to WSD suggest that oil palm productivity is more sensitive to changes in the soil physical properties that occur in subsurface layers, especially in TZ. This result was probably due to differences in sensitivity and ab-sorption rates of water and nutrients by the root system of oil palm.
Dec (Figures 3A, B, C, D, E and F), may have diminished water and nutrient absorption by oil palm, resulting in reduced FFB production.
These results indicate that soil compaction in the surface layer in TZ has an indirect influence on FFB production, which may have been caused by a reduc-tion in water infiltrareduc-tion and redistribureduc-tion at greater depths, which was reflected by reduced water storage in the subsurface layers. In this situation, there is an in-crease in the cohesive forces between water molecules that are strongly adhered to the particle surfaces, caus-ing increased agglutination and friction between the soil particles. Therefore, SR may reach critical levels even in conditions of non-restrictive bulk density (Lal and Shukla, 2005).
Despite the evidence of our data, more research is necessary in oil palm cultivated areas in different climatic conditions and soils, in order to improve our knowledge about the combined effects of machine traf-fic and temporal variation of θ on oil palm production. The results presented in this study support the need to monitor soil physical quality to ensure high and uniform oil palm productivity throughout the year.
Conclusions
Traffic zone areas presented changes in soil physi-cal quality only in the surface layer, resulting in a higher soil bulk density and reduced least limiting water range. The effect of temporal variation of the soil water content on soil physical quality was higher in the traf-fic zone, mainly in the subsurface layers due the longer period for which the soil physical and water conditions were restricted.
The soil bulk density and least limiting water range did not affect the fresh fruit bunch production; however, the water stress day in the traffic zone in the 20-40 and 40-60 cm layers were better indicators of the effect of temporal variation in the soil water content on oil palm productivity.
Acknowledgments
To Brazilian National Council for Scientific and Technological Development (CNPq) for providing a Mas-ter’s scholarship to the first author and Agropalma for the support and encouragement for this research.
References
Asgarzadeh, H.; Mosaddeghi, M.R.; Mahboubi, A.A.; Nosrati, A.; Dexter, A.R. 2010. Soil water availability for plants as quantified by conventional available water, least limiting water range and integral water capacity. Plant and Soil 335: 229-244. Bengough, A.G.; Bransby, M.F.; Hans, J.; McKenna, S.J.; Roberts,
T.; Valentine, T.A. 2006. Root responses to soil physical conditions: growth dynamics from field to cell. Journal of Experimental Botany 57: 437-447.
Bengough, A.G.; Mullins, C.E. 1990. Mechanical impedance to root growth: a review of experimental techniques and root growth responses. Journal of Soil Science 41: 341-358.
Benjamin, J.G.; Nielsen, D.C.; Vigil, M.F. 2003. Quantifying effects of soil conditions on plant growth and crop production. Geoderma 116: 137-148.
Beutler, A.N.; Centurion, J.F.; Centurion, M.A.P.C.; Freddi, O.S.; Sousa Neto, E.L.; Leonel, C.L.; Silva, A.P. 2007. Traffic soil compaction of an Oxisol related to soybean development and yield. Scientia Agricola 64: 608-615.
Blake, G.R.; Hartge, K.H. 1986. Bulk density. p. 363-375. In: Klute, A., ed. Methods of soil analysis. Part I. Physical and mineralogical methods. 2ed. American Society of Agronomy, Madison, WI, USA.
Busscher, W.J. 1990. Adjustment of flat-tipped penetrometer resistance data to a common water content. Transactions of the ASAE 33: 519-524.
Carr, M.K.V. 2011. The water relations and irrigation requirements of oil palm (Elaeis guineensis): a review. Experimental Agriculture 47: 629-652.
Cassel, D.K.; Nielsen, D.R. 1986. Field capacity and available water. p. 901-926. In: Klute, A., ed. Methods of soil analysis. Part I. Physical and mineralogical methods. 2ed. American Society of Agronomy, Madison, WI, USA.
Cecagno, D.; Andrade, S.E.V.G.; Anghinoni, I.; Kunrath, T.R.; Martins, A.P.; Reichert, J.M.; Gubiani, P.I.; Balerini, F.; Fink, J.R.; Carvalho, P.C.F. 2016. Least limiting water range and soybean yield in a long-term, no-till, integrated crop-livestock system under different grazing intensities. Soil and Tillage Research 156: 54-62.
Ehlers, W.; Köpke, U.; Hesse, F.; Böhm, W. 1983. Penetration resistance and root growth of oats in tilled and untilled loess soil. Soil and Tillage Research 3: 261-275.
Fidalski, J.; Tormena, C.A.; Silva, A.P. 2010a. Least limiting water range and physical quality of soil under groundcover management systems in citrus. Scientia Agricola 67: 448-453. Fidalski, J.; Auler, P.A.M.; Beraldo, G.; Marur, C.J.; Faria, R.T.;
Barbosa, G.M.C. 2010b. Availability of soil water under tillage systems, mulch management and citrus rootstocks. Revista Brasileira de Ciência do Solo 34: 917-924.
Gardner, W.H. 1986. Water content. p. 493-541. In: Klute, A., ed. Methods of soil analysis. Part I. Physical and mineralogical methods. 2ed. American Society of Agronomy, Madison, WI, USA.
Gee, G.W.; Bauder, J.W. 1986. Particle size analysis. p. 383-411. In: Klute, A., ed. Methods of soil analysis. Part I. Physical and mineralogical methods. 2ed. American Society of Agronomy, Madison, WI, USA.
Grable, A.R.; Siemer, E.G. 1968. Effects of bulk density, aggregate size, and soil water suction on oxygen diffusion, redox potential and elongation of corn roots. Soil Science Society of America Journal 32: 180-186.
Klute, A. 1986. Water retention: Laboratory methods. p. 635-660. In: Klute, A., ed. Methods of soil analysis. Part I. Physical and mineralogical methods. 2ed. American Society of Agronomy, Madison, WI, USA.
Leão, T.P.; Silva, A.P.; Macedo, M.C.M.; Imhoff, S.; Euclides, V.P.B. 2006. Least limiting water range: a potential indicator of changes in near-surface soil physical quality after the conversion of Brazilian Savanna into pasture. Soil and Tillage Research 88: 279-285.
Leão, T.P.; Silva, A.P.; Perfect, E.; Tormena, C.A. 2005. An algorithm for calculating the least limiting water range of soils. Agronomy Journal 97: 1210-1215.
Letey, J. 1985. Relationship between soil physical properties and crop production. Advances in Soil Sciences 1: 277-294. Olibone, D.; Encide-Olibone, A.P.; Rosolem, C.A. 2010. Least
limiting water range and crop yields as affected by crop rotations and tillage. Soil Use and Management 26: 485-493. Oliveira, P.D.; Sato, M.K.; Lima, H.V.; Rodrigues, S. 2016. Critical
limits of the degree of compactness and soil penetration resistance for the soybean crop in N Brazil. Journal of Plant Nutrition and Soil Science 179: 78-87.
Peralta, F.; Vásquez, O.; Rachardson, D.L.; Alvarado, A.; Bornemisza, E. 1985. Effect of some soil physical characteristics on yield, growth and nutrition of the oil palm in Costa Rica. Oléagineaux 40: 423-430.
Ramalho-Filho, A.; Motta, P.E.F.; Freitas, P.L.; Teixeira, W.G. 2010. Agroecological Zoning, Production and Management for the Culture of Oil Palm in the Amazon = Zoneamento Agroecológico, Produção e Manejo para a Cultura da Palma de Óleo na Amazônia. Embrapa Solos, Rio de Janeiro, RJ, Brazil (in Portuguese).
Safadoust, A.; Feizee, P.; Mahboubi, A.A.; Gharabaghi, B.; Mosaddeghi, M.R.; Ahrens, B. 2014. Least limiting water range as affected by soil texture and cropping system. Agricultural Water Management 136: 34-41.
Sene, M.; Vepraskas, M.J.; Naderman, G.C.; Denton, H.P. 1985. Relationships of soil texture and structure to corn yield response to subsoiling. Soil Science Society of America Journal 49: 422-427.
Silva, A.P.; Kay, B.D. 1997. Effect of water content variation on the least limiting water range. Soil Science Society of America Journal 61: 884-888.
Silva, A.P.; Kay, B.D.; Perfect, E. 1994. Characterization of the least limiting water range of soils. Soil Science Society of America Journal 58: 1775-1781.
Soil Survey Staff. 2010. Keys to Soil Taxonomy. 10ed. USDA-Natural Resources Conservation Service, Washington, DC, USA.
Sparks, D.L. 1996. Methods of soil analysis: chemical methods. Part 3. American Society of Agronomy, Madison, WI, USA. Tormena, C.A.; Silva, A.P.; Libardi, P.L. 1999. Soil physical quality
of a Brazilian Oxisol under two tillage systems using the least limiting water range approach. Soil and Tillage Research 52: 223-232.
Williams, J.; Ross, P.; Bristow, K. 1993. Prediction of the Campbell water retention function from texture, structure and organic matter. p. 427-441. In: van Genuchten, M.T.; Leij, F.J.; Lund, L.J., eds. Indirect methods for estimating the hydraulic properties of unsatured soils. U.S. Salinity Lab, Riverside, NY, USA.
Wilson, M.G.; Sasal, M.C.; Caviglia, O.P. 2013. Critical bulk density for a Mollisol and a Vertisol using least limiting water range: effect on early wheat growth. Geoderma 192: 354-361. Zuraidah, Y.; Ahmad, T.M.; Mohd, H.H.; Abd, R.S. 2012. Oil palm
adaptation to compacted alluvial soil (Typic Endoaquepts) in Malaysia. Journal of Oil Palm Research 24: 1533-1541.