ABSTRACT:Adjustment of seeding schemes is one of the crop management techniques that most influences grain yield components. This work aimed to characterize the potential grain yield and its components in wheat (Triticumaestivum L.) genotypes with contrasting tillering ability under different seeding densities and environments. Five experiments were conducted in split-plot design, each with ten cultivars (main plot), sown in five distinct seeding densities (subplots). Experiments were sown in three locations in southern Brazil in the years 2005, 2006 and 2007. The grain yield per plot and its yield components: number of fertile tillers, weight of 1,000 grains, ear weight and number of grains per ear were evaluated. Genotypes with reduced tillering ability expressed an increase in grain yield with an increase in seeding densities, however showing a reduction in ear weight. The number of grains per ear did not affect grain yield but was highly influenced by seeding densities. The compensatory effect was expressed by the weight of a thousand grains as a function of the experimental conditions in which the genotypes were evaluated, regardless of seeding densities used. Results pointed to differences among cultivars tested in specific locations and years.
Keywords: Triticum aestivum L., G × E interaction, tiller number, yield components
Introduction
Seeding density is important for the wheat ( Triti-cumaestivum L.) crop, since it directly affects the num-ber of ears per unit area. As a consequence, other yield components such as the number of grains per ear and individual grain weight (Davidson and Chevalier, 1990; Lloveras et al., 2004; Ozturk et al., 2006). The ability of wheat and other cold-season cereals to compensate the lack or excess of a yield component through changes in the other components is essential for their best per-formance (Freeze and Bacon, 1990). Such compensation can maximize the yield potential of the species per unit area, depending on the genotype, the environment and their interaction.
Currently, the seeding density used for the wheat ranges from 250 to 400 viable seeds per square meter. This is based on the cultivar cycle, as well as its dual ability as a forage and grain crop (Comissão Brasileira de Pesquisa de Trigo, 2007). Nevertheless, differential performances of cultivars regarding tiller formation and survival as well as the crop environment, should be tak-en into accountfor achieving proper seed densities.
In favorable environments, there is a uniform yield due to regular tiller formation and to the distribution of photosynthesis products, which contribute to grain yield (Rickman et al., 1983). On the other hand, tiller devel-opment in stress conditions is irregular, forming a high rate of underdeveloped or weak tillers which compete with normal tillers and affect plant grain yields (Martin, 1987). Also, adjusting seeding density to environmental (favorable or unfavorable) conditions adequate the level of competition between tillers, especially around tiller-ing initiation. A better understandtiller-ing of genotypic re-sponses in tillering to environmental and management
conditions will ease the optimization of seeding density. This allows exploitation of the genetic potential of a par-ticular genotype with respect to tillering dynamics and its effect on crop yield (Ozturk et al., 2006). Therefore, the objective of this work was to characterize grain yield and yield components of wheat genotypes with contrast-ing tillercontrast-ing abilities under a range of environmental conditions, and seeding densities.
Materials and Methods
Five experiments were conducted in three loca-tions in southern Brazil in the years 2005, 2006 and 2007 (Table 1). Three of these (2005, 2006 and 2007) were sown in Pelotas, Rio Grande do Sul State-RS, Brazil. The remaining two experiments were both sown in 2007, one in Ijui-RS and the other in Pato Branco, state of Paraná, Brazil. Ten Brazilian wheat cultivars, with different til-lering potentials, were used in the experiments: FUNDA-CEP 29 (FUNDAFUNDA-CEP); IPR 85 (IAPAR); CD 108, CD 114 and OCEPAR 11 – JURITI (supplied by COODETEC); SAFIRA (supplied by OR Seed Breeding Company) and BRS FIGUEIRA, BRS UMBÚ, BRS 177 and BR 18 (sup-plied by Embrapa wheat). The cultivars IPR 85, CD 108, OCEPAR 11 – JURITI, FUNDACEP 29 and BR 18 have low, and CD 114, BRS UMBU, BRS 177, SAFIRA and BRS FIGUEIRA have high tillering abilities. All experi-ments included five densities (50, 200, 350, 500 and 650 viable seeds m–2), which included two levels above and
below standard recommended density (Comissão Brasil-eira de Pesquisa de Trigo, 2007).
The experimental design was a split plot with three replications, where the genotypes composed the main plots and density the subplots. The environment was considered the third experimental factor. The fol-Received April 08, 2012
Accepted February 15, 2013
1UFPEL/FAEM/CGF, C.P. 354 – 96010-900 – Pelotas, RS – Brasil.
2UTFPR, Via do Conhecimento km 01, Campus Pato Branco – 85501-970 – Pato Branco, PR – Brasil.
3UNIJUI – Depto. de Estudos Agrários, R. do Comércio, 3000, Bairro Universitário – 98700-000 – Ijuí, RS – Brasil. *Corresponding author <[email protected]>
Edited by: Daniel Scherer de Moura
Seeding density in wheat: the more, the merrier?
Igor Pirez Valério1, Fernando Irajá Félix de Carvalho1, Giovani Benin2, Gustavo da Silveira1, José Antonio Gonzalez da Silva3, Rafael
lowing field characters were evaluated: number of fer-tile tillers (NFT), counted at physiological maturity for each genotype in one linear meter. In the laboratory, the following measurements were performed: i) grain yield (GY), by individually threshing each subplot; ii) weight of a thousand grains (WTG), by counting four 250 grain subsamples from each subplot; iii) ear weight (EW), ob-tained by weight seven randomly selected ears in each subplot, and iv) number of grains present in seven ran-domly selected ears.
Analysis of variance in the split plot design was performed, considering the environmental factor as ran-dom and genotype and density as fixed, using the Win-Stat software (WinWin-Stat, 2006). For the characters number of fertile tillers and grain yield, the interaction effects between these factors were tested by a linear regression analysis.
For weight of 1,000 grains, the interaction effects between factors were tested in the mean analysis for genotypes using the Scott and Knott test, fixing the envi-ronmental factor. For ear weight and number of grains per ear, the effects of the interaction between the fac-tors were tested by a linear regression analysis, testing the significance of many polynomial orders for different
density, fixing the genotype factor for ear weight and environmental factor for number of grains per ear.
Results and Discussion
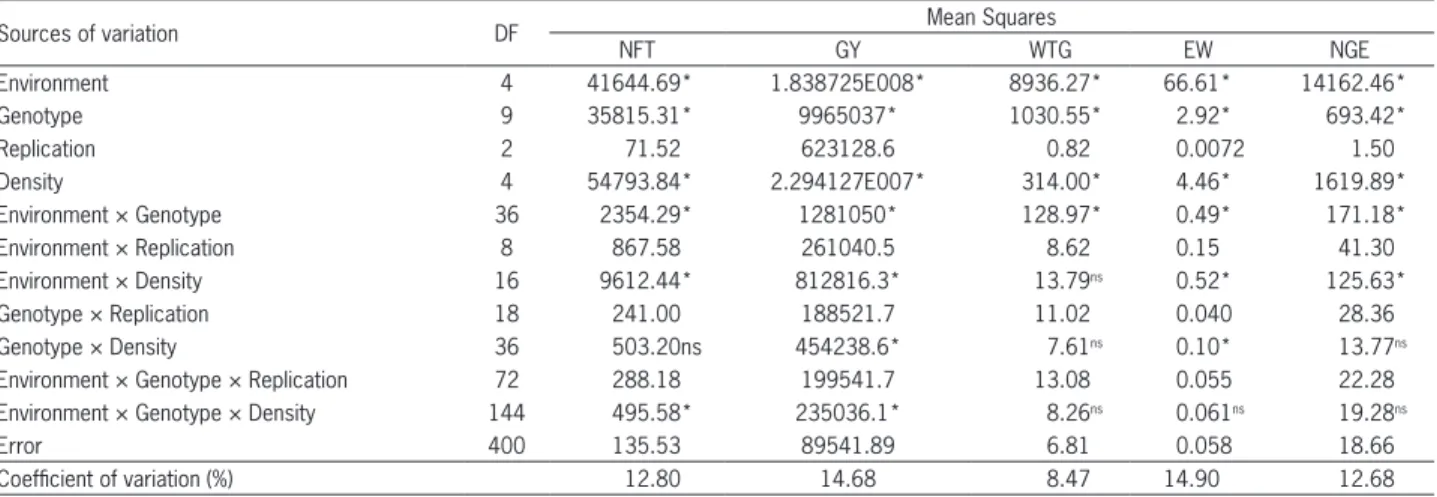
Significant effects were detected (p≤ 0.05) of the major factors Environment, Genotype and Density for all evaluated characters, as well as the GxE interaction. Interactions between Environment × Density were not detected (p > 0.05) for weight of 1,000 grains (WTG). The influence of the interaction Genotype × Density was not detected for the character number of grains per ear (NGE) and number of fertile tillers (NFT). The triple interaction was only detected (p ≤ 0.05) for the variables number of fertile tillers (NTF) and grain yield (GY) (Table 2).
The Environment × Density interaction for the character grain yield highlight the importance of having an ideal stand for the wheat crop, and the need for rec-ommendations based on more than one year and for spe-cific locations. These changes caused by seeding density are particular of a given environment, with a direct ef-fect on genotype yield (Lloveras et al., 2004). Therefore, the best exploitation of the genotype is related with the
Table 1 – Soil and Climate data (Soil type classification, latitude, longitude, altitude*, the summary of soil analyses, seeding scheme, date and meteorological date) for the five tested environments, indicating the fertilization performed on the distinct environments. pointing out the maximum temperature and rain means on the period when the crop was grown.
Environment Pelotas-RS/2005 Pelotas-RS/2006 Pelotas-RS/2007 Pato
Branco-PR/2007 Ijuí-RS/2007 Soil type Loamy/clayey, Udult Loamy/clayey, Udult Loamy/clayey, Udult Clayey, Odox Clayey, Odox
Seeding Conventional Conventional Conventional No-tillage No-tillage
Seeding date June, 10 June, 16 July, 4 July, 18 July, 15
Latitude S 31º52'00'' 31º52'00'' 31º52'00'' 26º7'00'' 28º27'17''
Longitude W 52º21'24'' 52º21'24'' 52º21'24'' 52º41'00'' 53º54'53'
Altitude (m) 13.24 13.24 13.24 700 328
Soil analysis
Clay (g kg–1) 115 130 110 580 450
pH (in water) 5.5 5.7 5.5 5.7 6.6
M.O. (g kg–1) 12 15 10 53 32
P (mg dm–3) 13 14.3 12.5 8.52 31
K (mg dm–3) 68 74 65 156 385
Fertilization Base (5-20-20) 250 200 250 200 200
Cover (N) 40 40 40 50 40
Maximum temperature means (ºc) / Months
June 21.6 19.9 - - 21.1
July 19.4 21.3 15.3 19.1 17.6
August 20.7 18.6 15.8 23.3 20.2
September 18.2 19.7 21.6 27.4 25.8
October 21.5 23.8 23.5 26.7 26.8
November - - 24.2 27.2
-Rain means (mm) / Month
June 28.2 61.2 - - 32.8
July 42.2 79.2 90.4 145.6 133.4
August 101.6 109.8 185.9 30.4 64.8
September 241.6 89 91 31 263.4
October 93.3 53.4 127.4 172.2 230.2
November - - 78.3 241.8
Thus, the observed large yield changes in the experi-ment conducted in Pelotas are due to an effect on WTG, with 34.7; 30.5 and 17.4, respectively, for the years 2005, 2006 and 2007 (Table 3). In this last year of testing at Pelotas, the maximum temperatures were very low dur-ing the tiller developmental stage, favordur-ing a higher til-ler production and leading to an indirect effect on yield components, as observed for WTG.
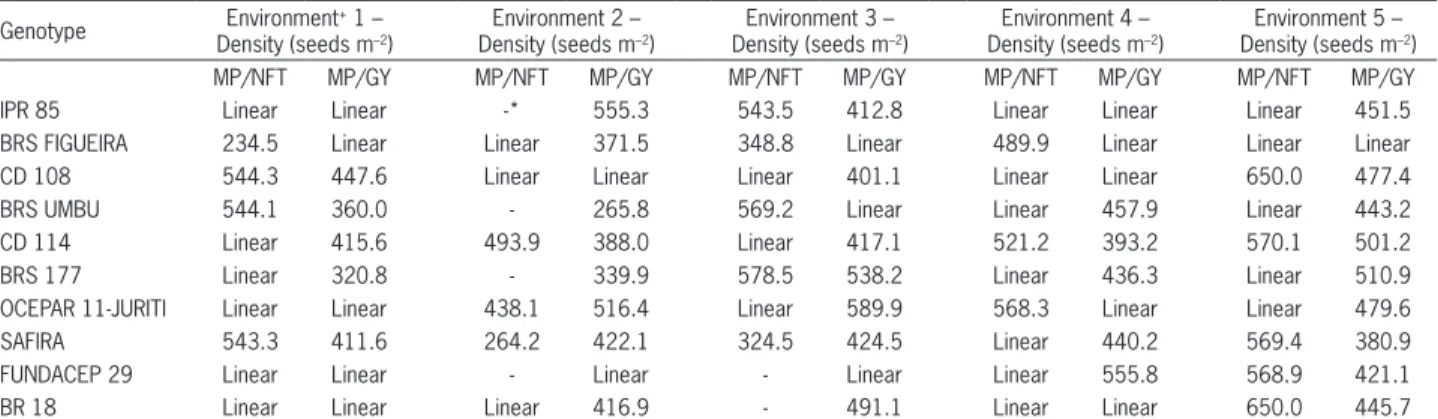
Seeding density for the point of maximum tiller production per meter was not the same density found for maximum grain yield (Table 4). Thus, the optimal grain yield density level may not necessarily be related with the higher tiller production per meter, being the genotype effect essential for this change. The higher grain yields were obtained with lower density for the genotypes with high tillering potential and with higher density for genotypes with reduced tillering potential (Table 4).
The differential effect of genotype on the seed-ing density for the maximum yield can be observed from the results for cultivars CD 114 (high tillering) and FUNDACEP 29 (low tillering). In both high yield-ing (Pelotas/2006) and low yieldyield-ing (Pato Branco/2007) conditions, optimum density of CD114 (< 400 seeds m–2)
was lower for FUNDACEP 29 (> 550 seeds m-2) (Table
4).
An effect of genotype and environment on the seeding density that maximizes grain yield was observed (p ≤ 0.05). Similar results are reported for the wheat crop, with a maximum grain yield obtained at densities of 371 – 508 seeds m–2, 200 - 280 seeds m–2 and 400 seeds m–2,
in distinct evaluating environments (Joseph et al., 1985; Ellen, 1990; Lock, 1993; Lloveras et al., 2004). These ef-fects on the ideal seeding density indicate that further studies aiming to recommend an ideal density for each specific genotype and location would have an important impact on the crop.
direct use of resources by the plant, as well as a density that fits to a higher yield response (Darwinkel, 1978). This response expresses the best performance obtained from a balance between competition for light, water and nutrients.
The environmental effect was essential for the per-formance of genotypes evaluated at different seed densi-ties. This can be observed from the average grain yield (overall means) obtained at different environments: 2,948; 1,924; 1,396 and 1,459 kg ha–1 for Pelotas/2005,
Pelotas/2006, Pelotas/2007, Pato Branco/2007 and Ijuí/2007, respectively (data not shown). The best grain yield was observed in the Pelotas/2006 environment, which was the one with the best conditions for the wheat crop (Table 1).
The experiment conducted in Pelotas/2006 was fa-vored mainly by the adequate rain index during all the crop season (Table 1). Thus, the best tiller development and survival in this environment are explained, leading to a direct effect on grain yield. Stresses caused by ex-cess water in the soil provoke intense modifications in agronomically important characters, with a direct effect on the wheat crop yield (Scheeren et al., 1995).
The damages caused by water stress during the crop development and a high maximum temperature were essential to cause a reduced performance of gen-otypes evaluated at Pato Branco/2007 (Table 1). Many reserachers report the influence of high temperature on tiller reduction (Cannell, 1969; Thorne and Wood, 1987; Hucl and Baker, 1990). Under ideal temperature condi-tions (15.5 to 20.5 °C), plants respond efficiently to tiller-ing (Bos and Neuteboom, 1998). Lower grain yield was observed for varieties conducted under dry winter, with reduction in tillering and consequently in the final num-ber of ears (Lloveras et al., 2004).
Climate and management conditions did influence the increase in WTG on the distinct tested environments.
Table 2 – Summary of the analysis of variance the model split-plot for the sources of variation environment, genotype and densities, evaluated regarding the characters number of fertile tillers (NFT), grain yield (GY), weight of a thousand grains (WTG), ear Weight (EW) and number of grains per ear (NGE).
Sources of variation DF Mean Squares
NFT GY WTG EW NGE
Environment 4 41644.69* 1.838725E008* 8936.27* 66.61* 14162.46*
Genotype 9 35815.31* 9965037* 1030.55* 2.92* 693.42*
Replication 2 71.52 623128.6 0.82 0.0072 1.50
Density 4 54793.84* 2.294127E007* 314.00* 4.46* 1619.89*
Environment × Genotype 36 2354.29* 1281050* 128.97* 0.49* 171.18*
Environment × Replication 8 867.58 261040.5 8.62 0.15 41.30
Environment × Density 16 9612.44* 812816.3* 13.79ns 0.52* 125.63*
Genotype × Replication 18 241.00 188521.7 11.02 0.040 28.36
Genotype × Density 36 503.20ns 454238.6* 7.61ns 0.10* 13.77ns
Environment × Genotype × Replication 72 288.18 199541.7 13.08 0.055 22.28
Environment × Genotype × Density 144 495.58* 235036.1* 8.26ns 0.061ns 19.28ns
Error 400 135.53 89541.89 6.81 0.058 18.66
Coefficient of variation (%) 12.80 14.68 8.47 14.90 12.68
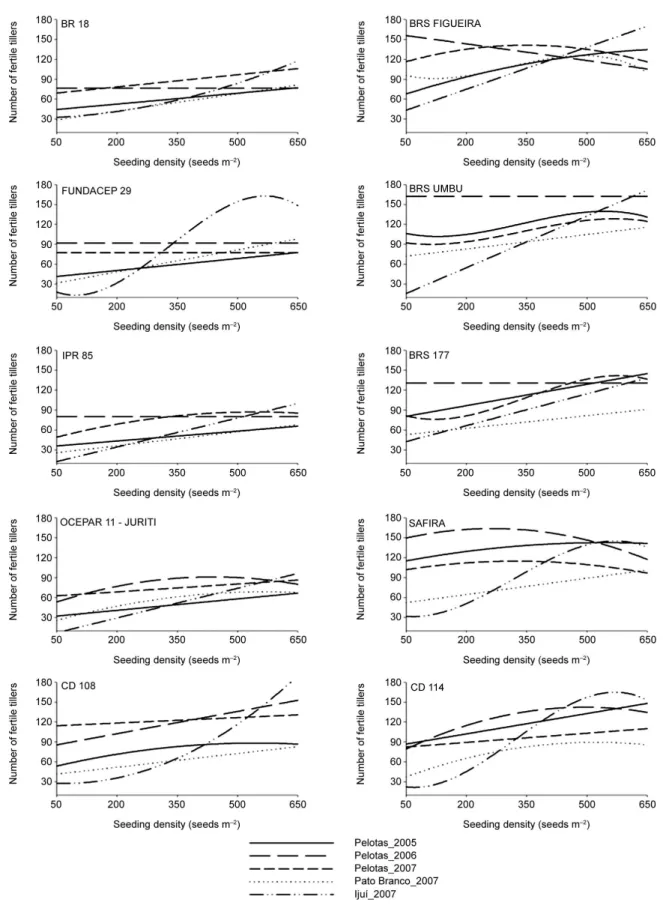
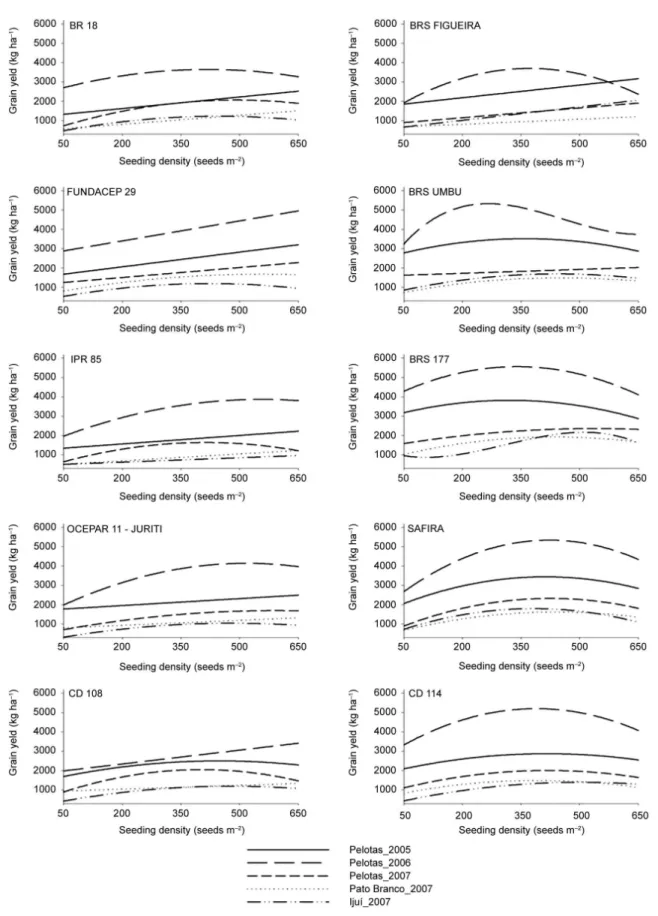
As observed for the majority of genotypes with reduced tillering potential, the increase in seeding den-sity was essential for the increase in the performance for NFT and GY (Figures 1 and 2), especially for cultivars IPR 85 and BR 18. This larger increase observed for the majority of low tillering potential genotypes could be ex-plained by the need to augment the density in order to compensate the reduced number of tillers produced by these genotypes, reaching higher yields. This compensa-tion can be important in determining the contribucompensa-tion of yield components (Freeze and Bacon, 1990).
The compensation among yield components was evident from the high ear weight of low tillering geno-types (Figure 3). However, weight per ear declines with increasing seeding density, indicating the need to explore the maximum grain yield potential, at the density level, for low tillering potential genotypes, i.e., genotypes with low tillering potential are more dependent on the seed-ing density for yield performance (Geleta et al., 2002; Ozturk et al., 2006).
The excellent performance of low tillering poten-tial genotypes when the seeding density was increased can be observed for the genotype FUNDACEP 29 in the environments of Pelotas/2005, Pelotas/2006 and Pelotas/2007, with increases of 74, 105 and 97 %, respec-tively. Similar but less striking results have also been reported as 33 and 49 % of grain yield increase, with the increase in density (Geleta et al., 2002; Ozturk et al., 2006). Therefore, it can be highlighted the better perfor-mance of low tillering potential genotypes in the high seeding densities, since the maximum grain yield was obtained in densities above 400 seeds m–2 (Table 4).
The density adjustment for low tillering potential genotypes results in the better use of resources, enabling the uniform tiller production without having an exces-sive energy cost towards tiller with retarded develop-ment. Also, it can result in a higher efficiency of nutrient uptake and transport, without the risk of having losses due to high tiller senescence during development and leading to a better conversion of energy to grain yield.
Table 3 – Comparison of means* for ten wheat genotypes within and between five evaluation environments for the character weight of 1,000 grains (WTG).
Genotype Environment+ 1 Environment 2 Environment 3 Environment 4 Environment 5
IPR 85 A 41.3 ab A 39.7 ab B 20.7 a A 41.4 a A 36.1 a
BRS FIGUEIRA A 27.25 c AB 26.2 bc B 15.1 a A 29.2 a A 31.8 a
CD 108 A 32.1 abc A 31.6 bc B 15.5 a A 36.4 a A 33.2 a
BRS UMBU A 31.7 bc AB 26.8 bc B 16.3 a A 33 a A 36.4 a
CD 114 A 31.8 bc AB 25.1 c B 16 a A 37 a A 36.1 a
BRS 177 A 34.9 abc AB 24.8 c B 16.4 a A 34.4 a A 34.3 a
OCEPAR 11-JURITI A 36.27 abc A 34.21 abc B 17.1 a A 33.1 a A 35.5 a
SAFIRA AB 31.17 bc BC 23.2 c C 16.2 a AB 33.3 a A 35.7 a
FUNDACEP 29 A 35.3 abc AB 29.9 bc B 18.8 a A 41.2 a A 33.1 a
BR 18 A 45.83 a A 44.1 a B 22.4 a A 40 a A 38.6 a
Mean 34.7 30.5 17.4 35.9 35.1
*Means followed by the same low capital letter in the columns do not differ (p≤ 0.05) among genotypes and Means followed by the same capital letter in the line do not differ (p≤ 0.05) among environments. +Environment 1 = Pelotas-RS/2005; Environment 2 = Pelotas-RS/2006; Environment 3 = Pelotas-RS/2007; Environment 4 = Pato Branco-PR/2007 and Environment 5 = Ijuí-RS/2007.
Table 4 – Seeding density calculated values using the regression equations fitted for each genotype, referring to the maximum point (MP) for the characters number of fertile tillers (NFT) and grain yield (GY).
Genotype Environment + 1 – Density (seeds m–2)
Environment 2 – Density (seeds m–2)
Environment 3 – Density (seeds m–2)
Environment 4 – Density (seeds m–2)
Environment 5 – Density (seeds m–2)
MP/NFT MP/GY MP/NFT MP/GY MP/NFT MP/GY MP/NFT MP/GY MP/NFT MP/GY
IPR 85 Linear Linear -* 555.3 543.5 412.8 Linear Linear Linear 451.5
BRS FIGUEIRA 234.5 Linear Linear 371.5 348.8 Linear 489.9 Linear Linear Linear
CD 108 544.3 447.6 Linear Linear Linear 401.1 Linear Linear 650.0 477.4
BRS UMBU 544.1 360.0 - 265.8 569.2 Linear Linear 457.9 Linear 443.2
CD 114 Linear 415.6 493.9 388.0 Linear 417.1 521.2 393.2 570.1 501.2
BRS 177 Linear 320.8 - 339.9 578.5 538.2 Linear 436.3 Linear 510.9
OCEPAR 11-JURITI Linear Linear 438.1 516.4 Linear 589.9 568.3 Linear Linear 479.6
SAFIRA 543.3 411.6 264.2 422.1 324.5 424.5 Linear 440.2 569.4 380.9
FUNDACEP 29 Linear Linear - Linear - Linear Linear 555.8 568.9 421.1
BR 18 Linear Linear Linear 416.9 - 491.1 Linear Linear 650.0 445.7
The higher tillering potential, observed for the genotypes FIGUEIRA, UMBU, CD 114, BRS 177 and SAFIRA at different seeding densities, indicates the bet-ter performance of these genotypes at reduced densities, probably due to a better water, radiation and nitrogen use efficiency (Masle, 1985). Light acts as an early sig-nal for cell division and determines higher leaf growth, which is correlated with the emission of new leaves and tillers (Skinner and Nelson, 1994; Skinner and Nelson, 1995). Also, it enables an increase in the plant green area, resulting in higher radiation capture ability (Wha-ley et al., 2000).
The superior performance of high tillering poten-tial genotypes, at reduced density levels, reveals a mech-anism by which wheat can produce a canopy with high radiation absorption ability and, therefore, to maintain a high grain yield (Whaley et al., 2000). Similar results are found in the literature, with higher grain yields at reduced densities and a direct effect in the number of grains per ear (Wood et al., 2003).
The fall in NFT and GY values with an increase in seeding density can be observed for genotypes with high tillering potential (Figures 1 and 2). At high densities there is high competition for soil water after anthesis, resulting on a reduction on the grain filling stage, leading to a reduction in grain yield (Darwinkel, 1977). Geno-types with higher tillering potential, when subjected to high densities had their development affected due to a higher competition between plants. This competition is
markedly higher than the one that occurs for low til-lering ability genotypes, decreasing nutrient uptake and leading to higher lodging and disease rates (Ozturk et al., 2006; Valerio et al., 2009).
The number of grains per ear varied among envi-ronments (p ≤ 0.05), following a linear trend (Table 5). However, the genotypes did not influence the number of grains per ear obtained in distinct seeding densities (Table 2). On the other hand, increased seeding density reduced grain number per ear in all environments (Fig-ure 3). Similar responses have been reported by many authors Lloveras et al. (2004) and Arduini et al. (2006). Thus, the tillering potential of genotypes does not seem to affect the changes in number of grains per ear, regard-ing the balancregard-ing effect that wheat has to increase grain yield, being the seeding density the cause for changes in this character.
The weight of 1,000 grains did not reveal an ef-fect on the yield variations found in this study, due to a change in seed density rates (Table 2). Similar results have been reported, in which the character WTG ap-pears to be less affected by seeding density (Donaldson et al, 2001; Lloveras et al., 2004; Hiltbrunner et al., 2005; Ozturk et al., 2006). On the other hand, the same char-acter is highly influenced by seeding time, which results on longer or shorter grain filling periods (Ozturk et al., 2006).
On the experiments performed in Pato Branco/2007 (35.9 g) and Ijui/2007 (35.1 g), the high WTG values
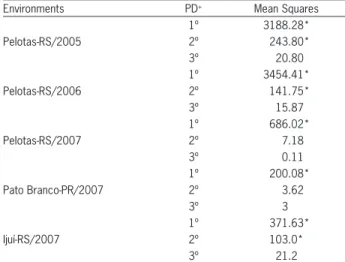
Table 5 – Summary of the analysis of variance for the regression model for five testing environments, evaluated for the characters number of grains per ear (NGE) at five seeding density levels (50, 200, 350, 500 e 650 seeds m–2).
Environments PD+ Mean Squares
Pelotas-RS/2005 1º 3188.28* 2º 243.80* 3º 20.80 Pelotas-RS/2006 1º 3454.41* 2º 141.75* 3º 15.87 Pelotas-RS/2007 1º 686.02* 2º 7.18 3º 0.11 Pato Branco-PR/2007 1º 200.08* 2º 3.62 3º 3 Ijuí-RS/2007 1º 371.63* 2º 103.0* 3º 21.2
*p≤ 0.05 by the F test. +Polinomium degree: (1º = first degree, 2º = second degree and 3º = third degree).
observed did not influence grain yield (Table 3 and Figure 2). This result can be attributed to a large ef-fect of the high maximum temperature and to the low and high rain indexes observed in Pato Branco/2007 and Ijui/2007, respectively. These extreme situations were not observed in Pelotas. Thus, the balancing ef-fect observed by the reduced number of ears per meter in these environments (Figure 1), did not allow an in-crease in grain yield.
Conclusions
The seeding density for wheat should take into ac-count genotype tillering potential and location. Geno-types with low tillering potential express higher effect on grain yield and ear weight, as a function of an in-crease in seeding density. The character number of grains per ear reveals the lowest genotype effects and it is highly influenced by seeding density. The balanc-ing effect expressed by the character weight of 1,000 grains, independent from density levels, is influenced by the experimental conditions in which the genotypes are tested.
References
Arduini, I.; Masoni, A.; Ercoli, L.; Mariotti, M. 2006. Grain yield, and dry matter and nitrogen accumulation and remobilization in durum wheat as affected by variety and seeding rate. European Journal of Agronomy 25: 309-318.
Bos, H.J.; Neuteboom, J.H. 1998. Morphological Analysis of leaf and tiller number dynamics of wheat (Triticum aestivum L.): Responses to temperature and light intensity. Annals of Botany 81: 131-139.
Comissão Brasileira de Pesquisa de Trigo. 2007. Informações Técnicas da Comissão Brasileira de Pesquisa de Trigo e Triticale para a Safra 2007 = Technical information from the Brazilian Wheat and Triticale Research Committee for the 2007 Season. Embrapa Trigo, Passo Fundo, RS, Brazil (in Portuguese). Cannell, R.Q. 1969. The tillering pattern in barley varieties. I.
Production, survival and contribution to yield by component tillers. Journal of Agricultural Science 72: 402-422.
Darwinkel, A. 1977. Effect of sowing date and seed rate on crop development and grain production of winter wheat. Netherlands Journal of Agricultural Science 25: 83-94. Darwinkel, A. 1978. Patterns of tillering and grain production of
winter wheat at a wide range of plant densities. Netherlands Journal of Agricultural Science 26: 383-398.
Davidson, D.J.; Chevalier, P.M. 1990. Preanthesis tiller mortality in spring wheat. Crop Science 30: 832-836.
Donaldson, E.; Schillinger, F.W.; Dofing, S.M. 2001. Straw production and grain yield relationships in winter wheat. Crop Science 41: 100-106.
Ellen, J. 1990. Effects of nitrogen and plant density on growth, yield and chemical composition of two winter wheat (Triticum aestivum L.) varieties. Journal of Agronomy Crop Science 164: 174-183.
Freeze, D.M.; Bacon, R.K. 1990. Row-spacing and seeding rate effects on wheat yields in the Mid-South. Journal of Production Agriculture 3: 345-348.
Geleta, B.; Atak, M.; Banziger, P.S.; Nelson, L.A.; Baltensperger, D.D.; Eskridge, K.M.; Shipman, M.J.; Shelton, D.R. 2002. Seeding rate and genotype effect on agronomic performance and end-use quality of winter wheat. Crop Science 42: 827-832.
Hiltbrunner, J.; Liedgens, M.; Stamp, P.; Streit, B. 2005. Effects of row spacing and liquid manure on directly drilled winter wheat in organic farming. European Journal of Agronomy 22: 441-447.
Hucl, P.; Baker, R.J. 1990. Effects of seeding depth and temperature on tillering characteristics of four spring wheat cultivars. Canadian Journal of Plant Science 70: 409-417.
Joseph, K.D.S.M.; Alley, M.M.; Brann, D.E.; Gravelle, W.D. 1985. Row spacing and seeding and rate effects on yield and yield components of soft red winter wheat. Agronomy Journal 77: 211-214.
Lloveras, J.; Manent, J.; Viudas, J.; López, A.; Santiveri, P. 2004. Seeding rate influence on yield and yield components of irrigated winter wheat in a mediterranean climate. Agronomy Journal 96: 1258-1265.
Lock, A.A. 1993. Management strategies for winter wheat; limitation of yield, seeding rate and nitrogen timing. Aspects of Applied Biology 34: 309-317.
Martin, G.C. 1987. Apical dominance. HortScience 22: 824-833. Masle, J. 1985. Competition among tillers in winter wheat:
consequence for growth and development of the crop. p. 33-54. In: Day, W.; Atkin, R.K., eds. Wheat growth and modelling. Plenum Press, New York, NY, USA.
Rickman, R.W.; Klepper, B.L.; Peterson, C.M. 1983. Time distributions for describing appearance of specific culms of winter wheat. Agronomy Journal 75: 551-556.
Scheeren, P.L.; Carvalho, F.I.F.; Federizzi, L.C. 1995. Response of wheat to stresses caused by low light and excess water in the soil. Part II. Field test. Pesquisa Agropecuária Brasileira 30: 605-619 (in Portuguese, with abstract in English).
Skinner, R.H.; Nelson, C.J. 1994. Epidermal cell division and the coordination of leaf and tiller development. Annals of Botany 74: 9-15.
Skinner, R.H.; Nelson, C.J. 1995. Elongation of the grass leaf and its relationship to the phyllochron. Crop Science 35: 4-10. Thorne, G.N.; Wood, D.W. 1987. Effects of radiation and
temperature on tiller survival, grain number and grain yield in winter wheat. Annals of Botany 59: 413-426.
Valerio, I.P.; Carvalho, F.I.F.; Oliveira, A.C.; Benin, G.; Souza, V.Q.; Machado, A.A.; Bertan, I.; Busato, C.C.; Silveira, G.; Fonseca, D.A.R. 2009. Seed density in wheat as a function of tillering potential. Scientia Agricola 66: 28-39.
Whaley, J.N.; Sparkes, D.L.; Foulkes, M.J.; Spink, J.H.; Scott, R.K. 2000. The physiological response of winter wheat to reductions in plant density. Annals of Applied Biology 137: 164-177. WinStat. 2006. Statistical Analysis System for Windows.
Universidade Federal de Pelotas, Pelotas, RS, Brazil (in Portuguese).