Parental selection of wheat lines based on phenotypic
characterization and genetic diversity
Alice Casassola1*, Sandra Patussi Brammer2, Márcia Soares Chaves2, Paula Wiethölter2 and Eduardo Caierão2
Received 24 April 2012 Accepted 25 September 2012
Abstract – Parental selection is an important step in breeding programs, and genetic variability increases the chances of obtaining variance in progenies. The objectives of this study were to phenotype 29 wheat genotypes and determine the genetic variability among them, in order to identify potential parental lines for breeding programs at Embrapa Wheat. For phenotyping, traits such as plant height, cycle and grains characteristics were assessed and the data were analyzed by the Euclidean distance. The genetic distance was
estimated using 97 microsatellite molecular markers and the data were analyzed by Nei72 coefficient. The average distance observed for phenotyping was 10.1, and the genetic distance was 31 %. SSR markers were efficient for selecting genetically diverse genotypes
despite their phenotypic similarity, and lines PF 9027, PF 950351, PF 030132, PF 979002, PF 040488 and IWT 04019 can be used as parental for future crosses, since they have genetic diversity and suitable agronomic traits.
Key words:Triticum aestivum L., genetic variability, microsatellite, agronomic characterization.
1 Universidade de Passo Fundo (UPF), Rodovia BR 285, km 171, 99.052-900, Passo Fundo, RS, Brazil. *E-mail: [email protected] 2 Empresa Brasileira de Pesquisa Agropecuária (Embrapa Trigo), Rodovia BR 285, km 294, 99.052-900, Passo Fundo, RS, Brazil
INTRODUCTION
Wheat (Triticumaestivum L.) is a widely cultivated crop. This specie, together with rice and maize, is a
stra-tegic crop for worldwide food security. In the last five
decades, the world wheat production increased from 200 to over 650 million tons, which represents about 30% of the global grain production. The major wheat producers are the European Union, China, India, the United States and Russia, and according to market projections, these countries have been responsible for most of the global wheat supply in the last years (Hubner 2008, Canziani and Guimarães 2009). Although Brazil is not among the major producers, wheat is a strategic crop for national agribusiness, being Paraná and Rio Grande do Sul States responsible for about 90% of total wheat production (MAPA 2010). Currently, about 10.5 million tons of wheat are consumed by Brazil-ian population, however in the 2008/2009 crop season the internal production supplied only 5.8 million tons of the total demand (CONAB 2010). From 2001 to 2007, Brazil produced only 40% of its internal demand, which required
imports, reaching an average value of about US$ 930 million in order to guarantee the internal supply. In 2008, despite of the fact that 55 % of the internal demand was supplied by national production, the import values rose to US$ 1.87 billion (Meziat and Vieira 2009). According to projections from the Brazilian Ministry of Agriculture and Supply, in 2019/2020, wheat consumption must reach 12.8 million tons, and the projected production is only 7.0 million tons. These projections also indicate that, from 2009/2010 to 2019/2020, the internal consumption must increase at an average rate of 1.53% per year, which will require imports of the order of almost 7.0 million tons (MAPA 2010).
Despite the significant advances achieved in wheat breed -ing programs worldwide, there are still many challenges to be overcome in order to increase the levels of productivity.
During the first Global Conference on Agricultural Research
for Development, held in 2010, genetics was recognized as the number-one technique for increasing yields, by means of new improved varieties developed whether by assisted selection, genetic engineering, or classical breeding methods Crop Breeding and Applied Biotechnology 13: 49-58, 2013
MATERIAL AND METHODS Plant material
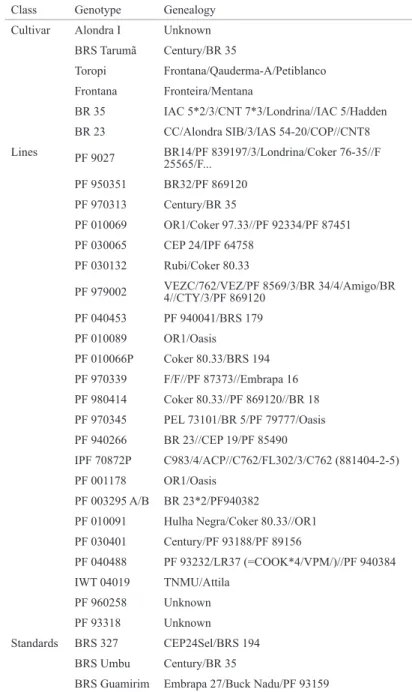
Six wheat cultivars and 23 wheat lines developed in the breeding program of Embrapa National Wheat Research Center (Passo Fundo, RS, Brazil) were selected for this study (Table 1). The cultivars BRS 327, BRS Umbu e BRS Guamirim were used as standards for the phenotypic characterization. Twenty seeds of each genotype were
germinated in germitest paper until the first leaf was completely
expanded. Leaves of ten seedlings of each genotype were collected Table 1. Genotypes used in this study with their respective genealogies
Class Genotype Genealogy
Cultivar Alondra I Unknown
BRS Tarumã Century/BR 35
Toropi Frontana/Qauderma-A/Petiblanco
Frontana Fronteira/Mentana
BR 35 IAC 5*2/3/CNT 7*3/Londrina//IAC 5/Hadden
BR 23 CC/Alondra SIB/3/IAS 54-20/COP//CNT8
Lines PF 9027 BR14/PF 839197/3/Londrina/Coker 76-35//F 25565/F...
PF 950351 BR32/PF 869120
PF 970313 Century/BR 35
PF 010069 OR1/Coker 97.33//PF 92334/PF 87451
PF 030065 CEP 24/IPF 64758
PF 030132 Rubi/Coker 80.33
PF 979002 VEZC/762/VEZ/PF 8569/3/BR 34/4/Amigo/BR 4//CTY/3/PF 869120
PF 040453 PF 940041/BRS 179
PF 010089 OR1/Oasis
PF 010066P Coker 80.33/BRS 194
PF 970339 F/F//PF 87373//Embrapa 16
PF 980414 Coker 80.33//PF 869120//BR 18
PF 970345 PEL 73101/BR 5/PF 79777/Oasis
PF 940266 BR 23//CEP 19/PF 85490
IPF 70872P C983/4/ACP//C762/FL302/3/C762 (881404-2-5)
PF 001178 OR1/Oasis
PF 003295 A/B BR 23*2/PF940382
PF 010091 Hulha Negra/Coker 80.33//OR1
PF 030401 Century/PF 93188/PF 89156
PF 040488 PF 93232/LR37 (=COOK*4/VPM/)//PF 940384
IWT 04019 TNMU/Attila
PF 960258 Unknown
PF 93318 Unknown
Standards BRS 327 CEP24Sel/BRS 194
BRS Umbu Century/BR 35
BRS Guamirim Embrapa 27/Buck Nadu/PF 93159
(Butler 2010). Parental selection is an important
first step in any breeding program. The ability
to assess accurately genetic differences between parents and, subsequently, to predict progeny performance would enhance the efficiency of breeding programs (Burkhamer et al. 1998). The use of genotypes with appropriate agronomic traits in induced crosses increases the chances of obtaining lines with enhanced performance. On the other hand, if genotypes are genetically similar, the probability of producing progenies with higher heterosis decreases (Bertan et al. 2007). Thus, the phenotyping and determination of genetic variability between materials are critical in the selection of parental genotypes, because once the genotypes have appropriate agronomic traits and high genetic variability, appropriate crosses can be made, ac-celerating the process of improving and reducing costs (Bered et al. 2002, Qi-Lun et al. 2008).
The phenotyping approach allows that
genetic materials are evaluated and classified
based on their agronomic traits. However, the high phenotypic similarity among the cultivated genotypes hampers the selection based only on the phenotype. On the other hand, the determination of genetic variability can be made at DNA level
and, since it is not influenced by the environment,
this approach can be of strategic importance for genotype characterization and parental selection (Bered et al. 2002, Aliyev et al. 2007, Ribeiro et al. 2011). The use of microsatellite molecular
markers can assist greatly the breeders to find out
genetic variability even among genotypes with similar phenotype. The microsatellite markers or SSR (“Simple Sequence Repeat”) can be applied in studies of relationship and construc-tion of genetic maps with high accuracy (Liu et al. 2007, Chandna et al. 2010), since they have co-dominant expression, multiallelism, high polymorphism information content (PIC) and are frequent and randomly distributed.
for DNA extraction and further genetic variability analysis. The remaining ten seedlings were transferred to 10 L pots containing soil and kept in growth chamber at 22 °C, with 18 h of photoperiod, until the heading stage for the analysis of cycle and plant height. After that, pots with plants were transferred to a greenhouse and kept until the full maturity of grain, when seeds were harvested to proceed the analysis of grain traits.
Agronomic characterization
The agronomic characterization was based on parameters regarding plant (height and cycle) and grain traits (color, weight, hardness and diameter). The genetic diversity among the genotypes was estimated by the Euclidean distance, and the accessions were grouped by UPGMA method (Un-weighted Pair Group Method using Arithmetic Averages), developed by Sokal and Michener (1958). The software used to generate the data was the NTSys (Rohlf 1998).
Plant height
The height of the genotypes was determined in centime-ters by measuring from the base of the plant to the tip of the ear, 15 days after heading. All plants of each genotype were measured and the average height was calculated. According to cultivar descriptors, BRS 327 is a high plant (Só e Silva et al. 2010) and BRS Guamirim is a short/dwarf plant (Scheeren et al. 2007) and, because of their contrasting phenotype for this trait, they were used as standards in this study.
Cycle
The cycle of genotypes was determined considering the number of days between some pre-determined growth stages, according to the descriptions of the scale proposed by Zadoks et al. (1974) for cereals. It was evaluated the number of days from sowing to emergence; from emer-gence to heading (growth stages 0 to 4); from heading to maturity (growth stages 4 to 9) and emergence to maturity (complete cycle). According to cultivar descriptors, BRS Guamirim presents early cycle (Scheeren et al. 2007) and cultivar BRS Umbu presents mid-late cycle (Del Duca et al. 2004), and they were used in this study as standards due to their contrasting phenotype for this trait.
Color of the grains
The evaluation of the grain color was visually scored considering as standards the contrasting cultivars BRS Umbu and BRS Guamirim, which have white (Del Duca et al. 2004) and red grains (Scheeren et al. 2007), respec-tively, using the parameters established by the Ministry of Agriculture and Supply (MAPA 2008).
Hardness, weight and diameter of the grain
The hardness, weight and diameter of the grains were determined using the adapted method 55-31 of American Association of Cereal Chemists – AACC (2000), equipment Single Kernel Characterization System - SKCS - , model 4100 (Perten Instruments). Due to the small amount of seeds available, instead of the 300 grains recommended by the protocol, only 50 grains per genotype were used, consisting in a single repeat. The hardness of the grains was determined according to the operation manual of the SKCS, which is described as the force necessary to grind the grain. The weight and diameter of the grains were analyzed by ANOVA, and the means were compared using the Scott-Knott test (p = 0.05) (Scott and Knott 1974). The mean separation test among genotypes were done using Genes software (Cruz 2006).
Genetic variability
Extraction of DNA
DNA was extracted from 300 mg of leaves of each genotype according to Bonato (2008) protocol and
quanti-fied by comparison with DNA lambda in 0.8 % agarose gel.
Molecular markers and evaluations
The DNA working solutions were standardized at the concentration of 25 µg µL-1. The molecular markers assessed
were the microsatellite (SSR) type. The SSR reactions were prepared for a 15 µL volume. Each reaction contained 0.2 mM of each primer (forward and reverse), 0.2 mM of each dNTP, 2.5 mM of MgCl2, 0.75 U of Taq-DNA polymerase enzyme, Taq buffer 1X, and 100 ng of DNA. The DNA was
amplified using the following program: one denaturation at
94 °C for 3 minutes; 5 cycles of 94 °C for 1 minute, 60 °C for 1 minute (decreasing 1 °C per cycle until 55 °C), 72 °C for 1 minute; 30 cycles of 94 °C for 1 minute, 55 °C for 1 minute, 72 °C for 1 minute; and an extension of 72 °C for 10
minutes. The amplified DNA fragments were separated in 2
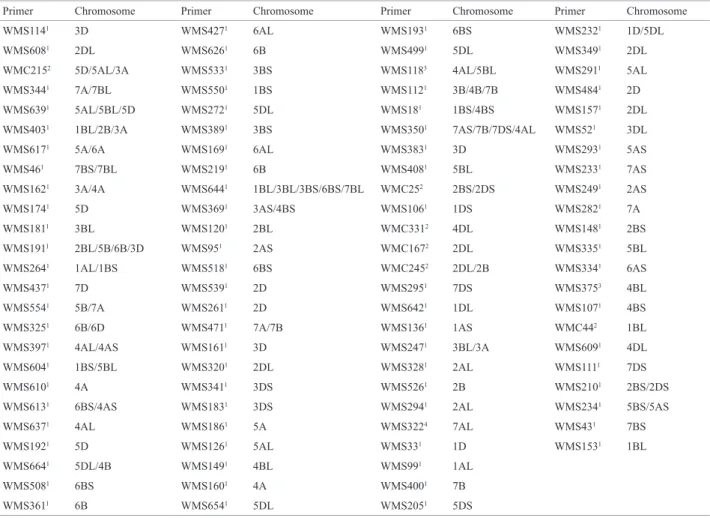
% ultrapure agarose gel (Invitrogen), stained with ethydium bromide and visualized under ultraviolet light (GelDoc XR+ equipment, Bio-Rad). The 50 pb DNA ladder marker was used as molecular weight standard. PCR reactions and gel visualization were carried out for all individuals together for each primer. Ninety-seven primers, which were distributed on all the wheat genomes, were tested (Table 2).
The genetic diversity among the genotypes was estimated
by the Nei72 coefficient (Nei 1972). The accessions were
operational taxonomic units (OTUs), and the bands obtained by markers, like binary characters. The software used to generate the data was the NTSys (Rohlf 1998).
The polymorphism information content was determined using the following formula:
2 ij PIC 1= −
∑
Pwhere Pij2 is the frequency of the jth allele for ith locus,
covering all alleles per locus (Nei 1973).
RESULTS AND DISCUSSION
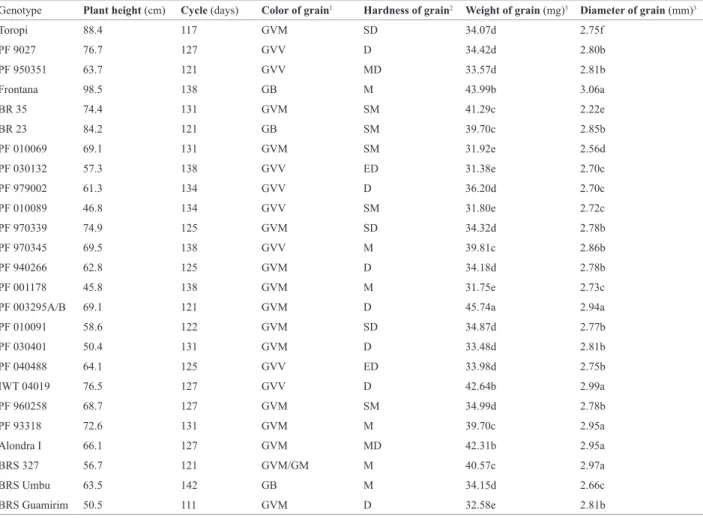
The results obtained in the phenotyping are presented in Table 3. Cultivar BRS Tarumã and lines PF 970313, PF 030065, PF 040453, PF 010066P, PF 980414 and IPF 70872P, were not evaluated since they showed a very late cycle. Regarding the plant height, cultivar BRS 327 was used as standard and only the old cultivars Frontana, Toropi and BR 23 were considered tall. All the other genotypes showed short size and, since this trait is more suitable for
cropping systems under high technology levels due to the enhanced resistance to lodging (Cruz et al. 2001), they are promising materials for short-term breeding programs.
Considering cycle, the genotypes were grouped as early-maturing when they showed a cycle shorter than the standard cultivar BRS Guamirim (Scheeren et al. 2007), and late-maturing, when the cycle was longer than 140 days, which is observed for the standard cultivar BRS Umbu (Del Duca et al. 2004). Those genotypes showing cycles varying from
111 to 139 days were classified in a mid-maturing group. All
genotypes, with the exception of BRS Umbu, were
classi-fied in a mid-maturing group. Short-cycled cultivars with
early or mid-maturity are more suitable for crop system in southern Brazil, since they allow that the successive sum-mer crop (mainly soybean) can be established in a timely manner, and for this reason they are preferred by breeders of Embrapa National Wheat Research Center.
The color of wheat grain can range from red to white, and since the hardness is associated with the vitreousness
Table 2. Microsatellite molecular markers used for wheat genotype characterization and their chromosomal location
Primer Chromosome Primer Chromosome Primer Chromosome Primer Chromosome
WMS1141 3D WMS4271 6AL WMS1931 6BS WMS2321 1D/5DL
WMS6081 2DL WMS6261 6B WMS4991 5DL WMS3491 2DL
WMC2152 5D/5AL/3A WMS5331 3BS WMS1183 4AL/5BL WMS2911 5AL
WMS3441 7A/7BL WMS5501 1BS WMS1121 3B/4B/7B WMS4841 2D
WMS6391 5AL/5BL/5D WMS2721 5DL WMS181 1BS/4BS WMS1571 2DL
WMS4031 1BL/2B/3A WMS3891 3BS WMS3501 7AS/7B/7DS/4AL WMS521 3DL
WMS6171 5A/6A WMS1691 6AL WMS3831 3D WMS2931 5AS
WMS461 7BS/7BL WMS2191 6B WMS4081 5BL WMS2331 7AS
WMS1621 3A/4A WMS6441 1BL/3BL/3BS/6BS/7BL WMC252 2BS/2DS WMS2491 2AS
WMS1741 5D WMS3691 3AS/4BS WMS1061 1DS WMS2821 7A
WMS1811 3BL WMS1201 2BL WMC3312 4DL WMS1481 2BS
WMS1911 2BL/5B/6B/3D WMS951 2AS WMC1672 2DL WMS3351 5BL
WMS2641 1AL/1BS WMS5181 6BS WMC2452 2DL/2B WMS3341 6AS
WMS4371 7D WMS5391 2D WMS2951 7DS WMS3753 4BL
WMS5541 5B/7A WMS2611 2D WMS6421 1DL WMS1071 4BS
WMS3251 6B/6D WMS4711 7A/7B WMS1361 1AS WMC442 1BL
WMS3971 4AL/4AS WMS1611 3D WMS2471 3BL/3A WMS6091 4DL
WMS6041 1BS/5BL WMS3201 2DL WMS3281 2AL WMS1111 7DS
WMS6101 4A WMS3411 3DS WMS5261 2B WMS2101 2BS/2DS
WMS6131 6BS/4AS WMS1831 3DS WMS2941 2AL WMS2341 5BS/5AS
WMS6371 4AL WMS1861 5A WMS3224 7AL WMS431 7BS
WMS1921 5D WMS1261 5AL WMS331 1D WMS1531 1BL
WMS6641 5DL/4B WMS1491 4BL WMS991 1AL
WMS5081 6BS WMS1601 4A WMS4001 7B
WMS3611 6B WMS6541 5DL WMS2051 5DS
(Guarienti 1996), vitreous red grains are considered hard. Grain hardness is genetically controlled, but environmental factors can alter the protein content (Trocolli et al. 2000). The baking industry prefers the vitreous grains once this trait is correlated with the protein percentage, semolina yield and cooking quality. In this study vitreous red grains were observed in lines PF 9027, PF 950351, PF 030132, PF 979002, PF 010089, PF 970345, PF 040488 and IWT 04019. Cultivar BRS Guamirim was used as standard for grain hardness, thus the genotypes that showed hardness index higher or equal to it - hard grain - were: PF 9027, PF 950351, PF 030132, PF 979002, PF 040488, IWT 04019, PF 940266, PF 003295 A/B, PF 030401 and Alondra I. These results were consistent with previous studies that reported that the hardness is related to vitreousness (Sissons et al. 2000), since the majority of the tested genotypes showing red vitreous grains also showed hard grains.
Regarding weight and diameter of the grains, PF 003295 A/B had the highest mean value for grain weight, whereas lines PF 010069, PF 030132, PF 010089 and PF 001178 had the smallest ones; PF 93318, IWT 04019, PF 003295 A/B, Alondra I and Frontana had the highest mean value for grain diameter, whereas cultivar Toropi had the small-est one. The standards BRS 327, BRS Umbu and BRS
Guamirim were classified into groups “c”, “d” and “e”,
for grain weight, and “a”, “c” and “b” for grain diameter, respectively (Scott-Knott p = 0.05) (Table 3).
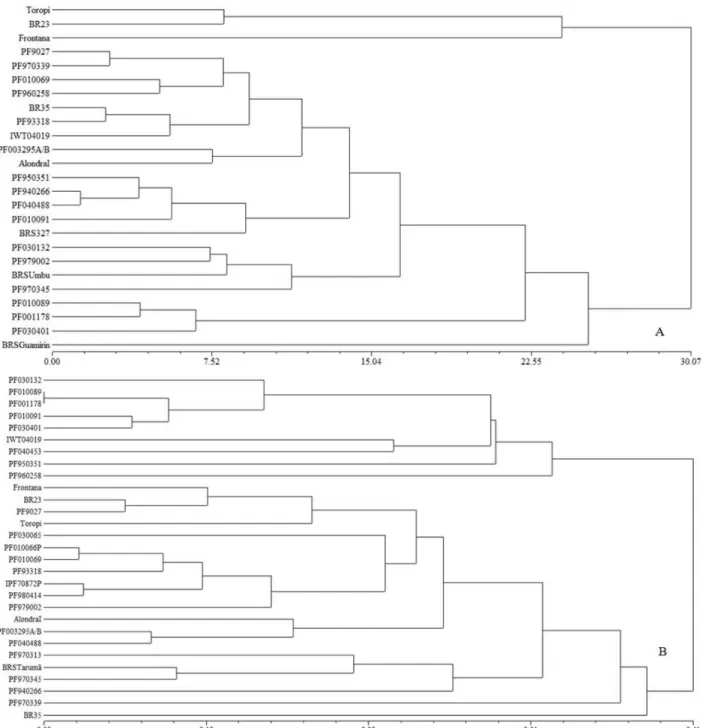
The data obtained from the phenotyping was analyzed to generate a dendrogram (Figure 1A). The average distance observed for this data was 10.1. From this analysis, it was possible to separate the genotypes into groups of similarity, but the diversity observed was small.
From the 97 microsatellite molecular markers used, 42 (43.3 %) showed polymorphism: WMS642, WMS136,
Table 3. Agronomic traits of wheat cultivar and lines
Genotype Plant height (cm) Cycle (days) Color of grain1 Hardness of grain2 Weight of grain (mg)3 Diameter of grain (mm)3
Toropi 88.4 117 GVM SD 34.07d 2.75f
PF 9027 76.7 127 GVV D 34.42d 2.80b
PF 950351 63.7 121 GVV MD 33.57d 2.81b
Frontana 98.5 138 GB M 43.99b 3.06a
BR 35 74.4 131 GVM SM 41.29c 2.22e
BR 23 84.2 121 GB SM 39.70c 2.85b
PF 010069 69.1 131 GVM SM 31.92e 2.56d
PF 030132 57.3 138 GVV ED 31.38e 2.70c
PF 979002 61.3 134 GVV D 36.20d 2.70c
PF 010089 46.8 134 GVV SM 31.80e 2.72c
PF 970339 74.9 125 GVM SD 34.32d 2.78b
PF 970345 69.5 138 GVV M 39.81c 2.86b
PF 940266 62.8 125 GVM D 34.18d 2.78b
PF 001178 45.8 138 GVM M 31.75e 2.73c
PF 003295A/B 69.1 121 GVM D 45.74a 2.94a
PF 010091 58.6 122 GVM SD 34.87d 2.77b
PF 030401 50.4 131 GVM D 33.48d 2.81b
PF 040488 64.1 125 GVV ED 33.98d 2.75b
IWT 04019 76.5 127 GVV D 42.64b 2.99a
PF 960258 68.7 127 GVM SM 34.99d 2.78b
PF 93318 72.6 131 GVM M 39.70c 2.95a
Alondra I 66.1 127 GVM MD 42.31b 2.95a
BRS 327 56.7 121 GVM/GM M 40.57c 2.97a
BRS Umbu 63.5 142 GB M 34.15d 2.66c
BRS Guamirim 50.5 111 GVM D 32.58e 2.81b
1 (GVV) Vitreous red grain, (GVM) Medium red grain, (GB) White Grain, (GM) Brown Grain.
2 (ED) Extra hard, (MD) Very hard, (D) Hard, (SD) Semi-hard, (SM) Semi-soft, (M) Soft, (MM) Very soft, (EM) Extra soft.
WMS247, WMS99, WMS400, WMS427, WMS533, WMS160, WMS205, WMS349, WMS52, WMS148, WMS186, WMS335, WMS334, WMS294, WMS626 , WMS291, WMS114, WMS344, WMS639, WMS617, WMS46, WMS181, WMS264, WMS437, WMS397, WMS604, WMS637, WMS508, WMS499, WMS261, WMS471, WMS234, WMS95, WMS518, WMS408, WMS272, WMS389, WMS219, WMS153 and WMC215.
A dendrogram generated from the molecular markers data (Figure 1B), showed a high genetic diversity of the analyzed genotypes. The average genetic distance obtained
was 31 %. The number of alleles varied from one to five,
and the average was 2.86 (Table 4). The highest number of polymorphic loci was found in B and A genomes, followed by D genome, and chromosome 5 was the most polymor-phic. These results corroborate with previous studies such
Figure 1. Genetic variability among the wheat genotypes analyzed. (A) Dendrogram of genetic variability using phenotypic data and the Euclidian
as Liu et al. (2007) and Achtar et al. (2010), who found the largest number of alleles and the greatest genetic variability in B genome. However the number of alleles is variable depending on the evaluated population (Khlesthina et al. 2004, Roussel et al. 2005).
The value of polymorphism information content (PIC)
ranged from 0.06 to 0.73, and the average was 0.49, confirming the high genetic diversity obtained by the Nei72 coefficient.
Considering the genealogies of the most similar geno-types, the predominant parental were OR1 (PF 010089, PF 001178, PF 010091 and PF 010069), Coker 80.33 (PF 010066P, PF 030132, PF 980414 and PF 010091), Coker 97.33 (PF 010069) and Oasis (PF 010089, PF 970345 and PF 001178). Therefore, the similarity of these materials is
significantly explained by genealogy, since all of them have
a common parental, which donate most of their genome even in complex crosses.
Thus, the analysis of genetic variability showed that there is high genetic diversity among genotypes, demonstrating that despite being phenotypically similar, there is diversity at
the molecular level, confirming the possibility of obtaining
variance in progenies using these genotypes as parental. Concerning the desirable agronomic traits such as plant height, cycle and grain color associated with the genetic vari-ability, the most promising lines for immediate or short-term use in the wheat breeding program of Embrapa National Wheat Research Center are: PF 9027, PF 950351, PF 030132, PF 979002, PF 040488 and IWT 04019. The other genotypes showing one or more appropriated attributes (such disease resistance, for example) also could be used as parents; how-ever, cycles of backcrossing would be required in order to recover the desired agronomic traits from the recurrent parent.
CONCLUSIONS
• The genotypes studied showed high genetic variability, which is essential to the breeding programs of wheat, and the use of microsatellite molecular markers allows to estimate the genetic variability even among phenotypically similar genotypes, justify-ing its use as a supportjustify-ing methodology for parental selection; • Lines PF 9027, PF 950351, PF 030132, PF 979002, PF 040488
and IWT 04019 can be used immediately in the improvement of wheat, due to the association of genetic variability with ap-propriate agronomic traits. The other lines and cultivars can be used as parental, but on the improvement of basic germplasm.
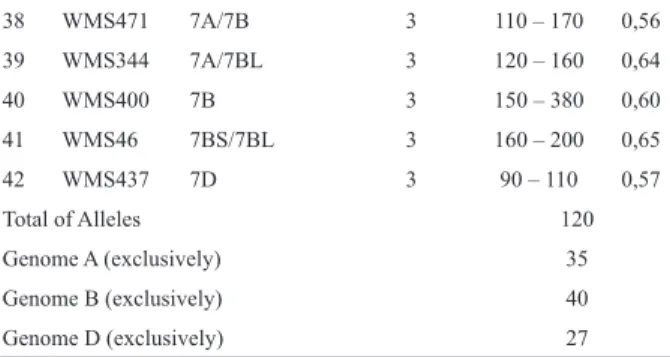
Table 4. Molecular markers showing polymorphic patterns, genome loca-tion, number of alleles, range of fragments and polymorphic information content (PIC)
Marker Chromosome Number of alleles
Range of fragments PIC
1 WMS99 1AL 2 100 – 150 0,43
2 WMS264 1AL/1BS 2 160 – 210 0,49
3 WMS136 1AS 5 200 – 500 0,52
4 WMS153 1BL 3 180 – 210 0,62
5 WMS604 1BS/5BL 3 110 – 130 0,64
6 WMS642 1DL 3 180 – 550 0,50
7 WMS294 2AL 4 50 – 120 0,68
8 WMS95 2AS 2 100 – 130 0,06
9 WMS148 2BS 3 100 – 170 0,52
10 WMS261 2D 3 170 – 200 0,50
11 WMS349 2DL 4 110 – 350 0,11
12 WMS181 3BL 2 140 – 160 0,32
13 WMS247 3BL/3A 2 150 – 200 0,37
14 WMS533 3BS 3 100 – 180 0,45
15 WMS389 3BS 3 130 – 180 0,61
16 WMS114 3D 4 120 – 200 0,55
17 WMS52 3DL 4 150 – 350 0,56
18 WMS160 4A 3 160 – 200 0,52
19 WMS637 4AL 2 150 – 170 0,48
20 WMS397 4AL/4AS 2 190 – 200 0,46
21 WMS186 5A 3 100 – 140 0,57
22 WMS617 5A/6A 4 100 – 190 0,73
23 WMS291 5AL 4 110 – 380 0,66
24 WMS639 5AL/5BL/5D 3 140 – 180 0,61
25 WMS335 5BL 4 180 – 260 0,63
26 WMS408 5BL 2 160 – 190 0,50
27 WMS234 5BS/5AS 3 110 – 160 0,59
28 WMC215 5D/5AL/3A 2 210 – 250 0,49
29 WMS499 5DL 2 100 – 130 0,28
30 WMS272 5DL 2 140 – 160 0,18
31 WMS205 5DS 2 140 – 170 0,50
32 WMS427 6AL 2 220 – 250 0,35
33 WMS334 6AS 2 110 – 130 0,48
34 WMS626 6B 2 100 – 130 0,23
35 WMS219 6B 3 150 – 190 0,45
36 WMS508 6BS 2 140 – 170 0,31
37 WMS518 6BS 4 190 – 250 0,69
38 WMS471 7A/7B 3 110 – 170 0,56
39 WMS344 7A/7BL 3 120 – 160 0,64
40 WMS400 7B 3 150 – 380 0,60
41 WMS46 7BS/7BL 3 160 – 200 0,65
42 WMS437 7D 3 90 – 110 0,57
Total of Alleles 120
Genome A (exclusively) 35
Genome B (exclusively) 40
Seleção de parentais em trigo baseado na caracterização fenotípica e
diversidade genética
Resumo – Seleção de parentais é uma etapa importante no melhoramento e a variabilidade genética aumenta as chances de obtenção de variância nas progênies. Os objetivos deste estudo foram fenotipar 29 genótipos de trigo e determinar a variabilidade genética
entre eles, visando identificar potenciais parentais para uso nos programas de melhoramento da Embrapa Trigo. Para a fenotipagem,
caracteres estatura de planta, ciclo e características dos grãos foram avaliados e os dados analisados pela distância Euclidiana. A
distância genética foi estimada utilizando 97 marcadores moleculares microsatélites e os dados analisados pelo coeficiente Nei72. A distância média observada pela fenotipagem foi 10.1 e a distância genética 31%. Os marcadores SSR foram eficientes na seleção de
genótipos geneticamente diversos apesar da similaridade fenotípica a as linhagens PF 9027, PF 950351, PF 030132, PF 979002, PF 040488 e IWT 04019 podem ser utilizadas como parentais em cruzamentos induzidos considerando variabilidade genética associada a caracteres agronômicos adequados.
Palavras-chave: Triticum aestivum L., variabilidade genética, microsatélites, caracterização agronômica.
REFERENCES
AACC – American Association of Cereal Chemists (2000)Approved methods of the AACC. Methods 39-70A. The Association, Saint Paul.
Achtar S, Moualla MY, Kalhout A, Roder MS and Mirali N (2010) Assessment of genetic diversity among Syrian durum (Triticum ssp.
durum) and bread wheat (Triticum aestivum L.) using SSR Markers.
Russian Journal of Genetics46: 1320-1326.
Aliyev RT, Abbasov MA and Mammadov AC (2007) Genetic identification
of diploid and tetraploid wheat species with RAPD markers. Turkish Journal of Biology 31: 173-180.
Bered F, Barbosa-Neto JF, Rocha BM and Carvalho FIF (2002) Genetic variability in wheat (Triticum aestivum L.) germplasm revealed by RAPD markers. Crop Breeding and Applied Biotechnology 4: 499-506.
Bertan I, Carvalho FIF and Oliveira AC (2007) Parental selection strategies in plant breeding programs. Journal of Crop Sciences and Biotechnology 10: 211-222.
Bonato ALV (2008) Extração de DNA genômico de cereais de inverno na Embrapa Trigo. Embrapa Trigo, Passo Fundo, 11p.
Burkhamer RL, Lanning SP, Martens RJ, Martin JM and Talbert LE (1998) Predicting progeny variance from parental divergence in hard red spring wheat. Crop Science38: 243-248.
Butler D (2010) Q&A: what it will take to feed the world. Nature 464: 969.
Canziani JR and Guimarães VDA (2009) O trigo no Brasil e no mundo: cadeia de produção, transformação e comercialização. In Cunha GR (ed.) Oficina sobre trigo no Brasil: bases para a construção de
uma nova triticultura brasileira. Editora Embrapa Trigo, Passo Fundo, p. 29-72.
Chandna R, Gupta S, Ahmad A, Iqbal M and Prasad M (2010) Variability in Indian bread wheat (Triticum aestivum L.) varieties differing in nitrogen efficiency as assessed be microsatellite markers.
Protoplasma 242: 55-67.
CONAB - Companhia Nacional de Abastecimento (2010) Produtos e Serviços/Safras/Séries/históricas/trigo. Available at <http://www. conab.gov.br/detalhe.php? c=5052&t=2> Accessed on Jan 10, 2012.
Cruz PJ, Carvalho FIF, Caetano VR, Silva SA, Kurek AJ and Barbieri RL (2001) Traits associated with lodging resistance in bred wheat.
Ciência Rural 31: 563-568.
Cruz CD (2006) Programa Genes - estatística experimental e matrizes. Editora UFV, Viçosa, 285p.
Del Duca LJA, Linhares AG, Nascimento Junior A, Souza CNA, Guarienti EM, Só e Silva M, Scheeren PL, Lhamby JCB, Rodrigues O, Fontaneli RS, Pegoraro D, Rosinha RC, Almeida J and Molin R (2004) Desempenho
e características agronômicas, fitossanitárias e industriais da cultivar
de trigo BRS Umbu. Embrapa Trigo, Passo Fundo, 18p.
Guarienti E (1996) Qualidade industrial do trigo. Editora Embrapa Trigo, Passo Fundo, 36p.
Hubner O (2008) Análise da conjuntura agropecuária – safra
2007/2008. Trigo. Secretaria da Agricultura e do Abastecimento do Estado do Paraná, Curitiba, 19p.
Khlesthina EK, Roder MS, Efremova TT, Borner A and Shumny VK (2004) The genetic diversity of old and modern Siberian varieties of common spring wheat as determined by microsatellite markers. Plant Breeding123: 122-127.
Korzun V, Börner A, Worland AJ, Law CN and Röder MS (1997) Application of microsatellite markers to distinguish inter-varietal chromosome substitution lines of wheat (Triticumaestivum L.).
Euphytica 95: 149-155.
Liu J, Liu L, Hou N, Zhang A and Liu C (2007) Genetic diversity of wheat gene pool of recurrent selection assessed by microsatellite markers and morphological traits. Euphytica 155: 249-258.
MAPA - Ministério da Agricultura, Pecuária e Abastecimento (2010)
Projeções do agronegócio: Brasil 2009/2010 a 2019/2020. Ministério da Agricultura, Pecuária e Abastecimento, Brasília, p. 18-20.
MAPA - Ministério da Agricultura, Pecuária e Abastecimento (2008)
Descritores mínimos de trigo. MAPA, Brasília, 10p.
Meziat A and Vieira RCM (2009) Política de desenvolvimento produtivo e sua extensão à cadeia produtiva do trigo. In Cunha GR (ed.) Oficina
Nei M (1972) Genetic distance between populations. American Naturalist 106: 283-292.
Nei M (1973) Analysis of gene diversity in subdivided populutions.
Proceedings of the National Academy of Science of the USA70: 3321-3323.
Qi-Lun Y, Ping F, Ke-Cheng K and Guang-Tang P (2008) Genetic diversity based on SSR markers in maize (Zea mays L.) landraces from Wuling mountain region in China. Journal of Genetics87: 287-291.
Ribeiro MNO, Carvalho SP, Santos JB and Antonio RP (2011) Genetic variability among cassava accessions based on SSR markers. Crop Breeding and Applied Biotechnology11: 263-269.
Rohlf JF (1998) NTSYS – pc. Numerical taxonomy and multivariate
analisys system. Versão 2.0. Applied Biostatistics Inc., New York.
Roussel V, Leisova L, Exbrayat F, Stehno Z and Balfourier F (2005) SSR allelic diversity changes in 480 European bread wheat varieties released from 1840 to 2000. Theoretical and Applied Genetics 111: 162-170.
Scheeren PL, Caierão E, Só e Silva M, Del Duca LJA, Nascimento Junior A, Linhares A and Eichelberger L (2007) BRS Guamirim: cultivar de trigo da classe pão, precoce e de baixa estatura. Pesquisa
Agropecuária Brasileira 42: 293-296.
Scott AJ and Knott MA (1974) A cluster analysis method for grouping means in the analysis of variance. Biometrics 30: 507-512.
Sissons MJ, Osborne BG, Hare RA, Sissons SA and Jackson R (2000) Application of the single-kernel characterization system to durum wheat testing and quality prediction. Cereal Chemistry77:4-10.
Só e Silva M, Caierão E, Scheeren PL, Eichelberger L, Nascimento Junior A and Miranda MZ (2010) BRS 327 - a new bread wheat cultivar.
Crop Breeding and Applied Biotechnology 10: 370-373.
Sokal RR and Michener CD (1958) A statistical method for evaluating systematic relationships. The University of Kansas Scientific Bulletin38: 1409-1438.
Somers DJ and Isaac P (2004) SSRs from the wheat microsatellite consortium. Available at <wheat.pw.usda.gov/ggpages/SSR/WMC> Accessed on March 10, 2010.
Sourdille P, Gandon B, Chiquet V, Nicot N, Somers D, Murigneux A and Bernard M (2004) Wheat génoplante SSR mapping data release: a new set of markers and comprehensive genetic and physical mapping data. Available at <wheat.pw.usda.gov/ggpages/SSRclub/ GeneticPhysical> Accessed on March 10, 2010.
Trocolli A, Borrelli GM, De Vita P, Fares C and Di Fonzo N (2000) Durum wheat quality: o multidisciplinary concept. Journal of Cereal Science32: 99-113.