ABSTRACT: An outstanding feature of poultry production that provides animal protein yield for human feeding is its short production cycle. This characteristic has a linear relationship with waste production. Increasing the inclusion of this residue in diets in the near future is desirable in step with the growth of poultry production since it offers a better environmental and nutritional alternative to current methods. We evaluated the effects on the performance and carcass characteristics of broiler chickens produced by the inclusion of poultry offal meal (POM) in their feed. Treatments consisted of a control diet (corn, Zea mays and soybean, Glycine max) and four diets with inclusion of 30, 60, 90 and 120 g kg–1 of POM. The diets
were formulated based on the level of digestible amino acid once categorized as isocalcic, isophosphoric, isosodic, isoenergetic and isonutritive for protein, methionine+cystine, lysine and threonine. The feed's electrolytes were corrected so that each diet had the same elec-trolytic balance. The variables analyzed were feed intake, weight gain, feed conversion ratio, body weight, carcass yield, chicken cut yield and abdominal fat. Feed intake was not affected by the quantities of POM added. The weight gain, feed conversion, carcass yield and noble cuts presented quadratic responses to the treatments. Abdominal fat increased linearly. The performance of the poultry, and carcass characteristics were maximized by the inclusion of 53 and 65 g kg–1, respectively, of POM in the diet, and the inclusion of 120 g kg–1 of POM provided
greater disposition of abdominal fat.
Keywords:alternative ingredient, byproduct of poultry, digestible amino acid
Abbreviations: POM, poultry offal meal; FI, feed intake; WG, weight gain; FCR, feed conversion ratio; E, equation; FAT, deposition of fat in the abdominal and cloacal region.
Received April 04, 2013 Accepted January 06, 2014
1São Paulo State University/FCAV, Via de Acesso Prof. Paulo
Donato Castellane s/n – 14884-900 – Jaboticabal, SP – Brazil.
2Federal Rural University of Pernambuco – Dept. of Animal
Science, R. Dom Manoel de Medeiros, s/n, Dois Irmãos – 52171-900 – Recife, PE – Brazil.
3Embrapa Swine and Poultry, C.P. 21 – 89700-000 –
Concórdia, SC – Brazil.
4Federal University of Viçosa – Dept. of Animal Science, Av.
Peter Henry Rolfs s/n, Campus Universitário – 36570-900 – Viçosa, MG – Brazil.
*Corresponding author <[email protected]>
Edited by: Gerson Barreto Mourão
Poultry offal meal in broiler chicken feed
Edney Pereira da Silva1, Carlos Bôa-Viagem Rabello2*, Michele Bernardino de Lima1, Jorge Vitor Ludke3, Emmanuele Maria Florêncio de Arruda2, Luiz Fernando Teixeira Albino4
Introduction
Among the branches of short-cycle animal protein yield for human intake, poultry production stands out thanks to its yield capacity. Concomitantly, this feature demonstrates a linear relationship with waste produc-tion. The poultry industry is able to absorb all the waste feed produced (Silva et al., 2011). Therefore, the in-creased inclusion of this residue in diets is desirable in the near future, with the growth of poultry production, because it provides a better environmental and nutri-tional alternative to current methods.
Currently, advances in the techniques applied in the nutrition of these animals and the accessibility of certain analysis to producers can even further increase the level of inclusion of that ingredient in poultry diets because POM (poultry offal meal) is an ingredient with specific characteristics, supplying amino acids, vitamins, minerals and energy, as well as being a resource gener-ated inside the chain. Therefore, POM suffers less from market price speculation compared with soybean meal.
Even with these features, in the literature, little more than ten scientific papers are related to different rec-ommendations regarding the optimal level of inclusion of this ingredient in diets. The lack of consensus has been attributed to variability in the composition of the flours and the different criteria used in the formulations. How-ever, some researchers have announced positive results
from the application of new concepts in the formulation of experimental diets, such as correction for metabolizable energy and digestible amino acids, the ratios of calcium and phosphorus of the diets, which have demonstrated improvements in the birds’ performance (Bellaver et al., 2001; Caires et al., 2010). This study evaluated the effects on the performance and carcass characteristics of broiler chickens resulting from the inclusion of POM in their diet.
Materials and Methods
The present study was conducted in the munici-pality of Carpina, state of Pernambuco, Brazil (7º84’ S; 35º25’ W, 184 m a.s.l.).
Animals, experimental design, housing and man-agement
700 one-day-old male chicks, Ross 308 breed, with initial mean weight of 45.5 g were selected and distrib-uted in a completely randomized experimental design, with five treatments and seven repetitions composed of 20 animals per experimental unit (1.3 × 2.0 m). The en-vironmental temperature and air humidity were record-ed daily at 9h00, 15h00 and 21h00, including the maxi-mum and minimaxi-mum, using a digital thermo-hygrometer (Table 1). A lighting program of 23 h diary was adopted, except in the first week, when 24 h of light were pro-vided. Starting from the 18th day of life of the chicks,
Experimental treatments and preparation of the poultry diet
The treatments consisted of a control ration, based on corn (Zea mays)and soybean (Glycine max), T1, 0 g
kg–1 of POM and four other treatments, composed by
increasing the levels of inclusion of POM as follows: T2 – 30 g kg–1, T3 – 60 g kg–1, T4 – 90 g kg–1 and T5 – 120 g
kg–1. To formulate the rations, a nutritional matrix was
used for the ingredients corn, soybean meal and POM, according to Table 2. The food program applied was based on phases: initial (1 to 14), growth (14 to 28) and final (28 to 42 days old). The POM used throughout the experiment was part of the same lot. The rations are pre-sented in Tables 3, 4 and 5. To allow the inclusion of 120
g kg–1 of POM in the experimental rations and maintain
Table 1 – Temperature and relative humidity medium during the experimental period.
Measure
Age, weeks
1 2 3 4 5 6
Temperature, ºC
Maximum 36.8 37.9 37.9 37.9 37.4 32.8 Minimum 27.9 26.6 25.1 24.6 24.6 23.7 Mean 32.3 32.2 31.5 31.3 31.0 28.2
Relative humidity, %
Maximum 88 86 82 87 87 99
Minimum 29 23 18 23 20 43
Mean 59 55 50 55 53 71
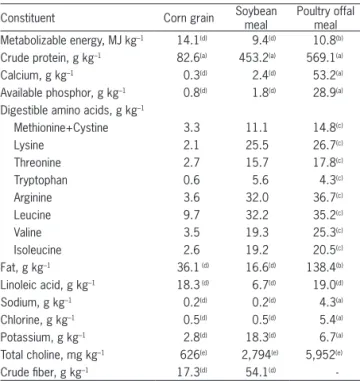
Table 2 – Chemical composition of ingredients used in the formulation of the diets.
Constituent Corn grain Soybean meal
Poultry offal meal Metabolizable energy, MJ kg–1 14.1(d) 9.4(d) 10.8(b)
Crude protein, g kg–1 82.6(a) 453.2(a) 569.1(a)
Calcium, g kg–1 0.3(d) 2.4(d) 53.2(a)
Available phosphor, g kg–1 0.8(d) 1.8(d) 28.9(a)
Digestible amino acids, g kg–1
Methionine+Cystine 3.3 11.1 14.8(c)
Lysine 2.1 25.5 26.7(c)
Threonine 2.7 15.7 17.8(c)
Tryptophan 0.6 5.6 4.3(c)
Arginine 3.6 32.0 36.7(c)
Leucine 9.7 32.2 35.2(c)
Valine 3.5 19.3 25.3(c)
Isoleucine 2.6 19.2 20.5(c)
Fat, g kg–1 36.1 (d) 16.6(d) 138.4(b)
Linoleic acid, g kg–1 18.3 (d) 6.7(d) 19.0(d)
Sodium, g kg–1 0.2(d) 0.2(d) 4.3(a)
Chlorine, g kg–1 0.5(d) 0.5(d) 5.4(a)
Potassium, g kg–1 2.8(d) 18.3(d) 6.7(a)
Total choline, mg kg–1 626(e) 2,794(e) 5,952(e)
Crude fiber, g kg–1 17.3(d) 54.1(d) -aAnalyzed; bObtained through metabolism assay conducted; cEstimated from
equations of Degussa AG (1997), correction to coefficients of digestibility of Rostagno et al. (2005); dExtracted from Rostagno et al. (2005); eExtracted
from NRC (1994).
Table 3 – Ingredients and chemical composition of experimental diets for 1 to 14 day old.
Ingredients
Levels of inclusion of Poultry offal meal, g kg–1
0 30 60 90 120
Corn 554.74 579.25 603.77 628.28 652.79 Soybean meal 45 % 367.09 324.30 281.51 238.71 195.92 Poultry offal meal 0.00 30.00 60.00 90.00 120.00 Poultry fat 30.02 22.52 15.01 7.51 0.00 Dicalcium Phosphate 19.22 14.84 10.46 6.08 1.70
Limestone 9.13 8.05 6.97 5.89 4.81
Salt 5.15 4.12 3.09 2.05 1.02
L-Lisyne HCl 78.8 % 3.66 3.97 4.28 4.59 4.90 DL-Methionine 99 % 3.65 3.60 3.55 3.50 3.45 Vitamin supplementa 1.00 1.00 1.00 1.00 1.00
Mineral supplementb 0.50 0.50 0.50 0.50 0.50
Bacitracin Zinc 15 % 0.40 0.40 0.40 0.40 0.40 Salinomycin sodium 12 % 0.40 0.40 0.40 0.40 0.40 Choline Chloride 70 % 0.50 0.40 0.30 0.20 0.10 L-Threonine 98 % 1.54 1.62 1.70 1.78 1.86 Sodium bicarbonate 0.00 1.06 2.12 3.17 4.23 Adsorbentc 3.00 3.00 3.00 3.00 3.00
Inert (washed sand) 0.00 0.98 1.96 2.94 3.92
Total 1,000 1,000 1,000 1,000 1,000
Calculated Composition
Metabolizable Energy, MJ kg–1 12.5 12.5 12.5 12.5 12.5
Crude protein, g kg–1 218.6 218.6 218.6 218.6 218.6
Calcium, g kg–1 9.32 9.32 9.32 9.32 9.32
Available phosphor, g kg–1 4.66 4.66 4.66 4.66 4.66
Digestible amino acids, g kg–1
Methionine+Cystine, g kg–1 9.48 9.48 9.48 9.48 9.48
Lysine 13.36 13.36 13.36 13.36 13.36 Threonine 8.66 8.66 8.66 8.66 8.66 Tryptophan 2.39 2.29 2.20 2.10 2.01 Arginine 13.74 13.56 13.38 13.20 13.02 Leucine 17.20 17.12 17.03 16.95 16.86
Valine 9.03 9.05 9.06 9.08 9.10
Isoleucine 9.87 9.69 9.51 9.33 9.14 Fat, g kg–1 56.02 52.87 49.72 46.57 43.43
Sodium, g kg–1 2.23 2.23 2.23 2.23 2.23
Potassium, g kg–1 8.27 7.76 7.24 6.73 6.22
Chloride, g kg–1 3.53 3.07 2.61 2.14 1.68
Choline, mg kg–1 1,405 1,472 1,539 1,606 1,673
Crude fiber, g kg–1 29.46 27.57 25.67 23.78 21.89
EBd, mEq kg–1 209 209 209 209 209 aWarrant level per product kg: Vitamin A, 7.500.000 UI; Vitamin D3, 2.500.000
UI; Vitamin E, 18.000 mg; Vitamin B12, 12.500 mg; Vitamin K3, 1.200 mg; Niacin, 35.000 mg; Pyridoxine, 2.000 mg; Riboflavin, 5.500 mg; Thiamine, 1.500 mg; Biotin, 67 mg; Calcium pantothenate, 10.000 mg; Folic acid, 550 mg; Antioxidant, 5.000 mg; bWarrant level per product kg: Iron, 60.000 mg;
Copper, 13.000 mg; Manganese, 120.000 mg; Zinc, 100.000 mg; Iodine, 2.500 mg; Selenium. 500 mg; cDemicotoxin adsorbent, Aluminosilicate; dEB,
electrolytic balance.
Table 4 – Ingredients and chemical composition of experimental diets for 14 to 28 day old.
Ingredients
Levels of inclusion of Poultry offal meal, g kg–1
0 30 60 90 120
Corn 555.95 582.47 608.99 635.51 662.03 Soybean meal 45 % 348.75 305.58 262.41 219.23 176.06 Poultry offal meal 0.00 30.00 60.00 90.00 120.00 Poultry fat 53.61 45.42 37.23 29.04 20.85 Dicalcium phosphate 17.93 13.55 9.16 4.78 0.39
Limestone 8.70 7.62 6.55 5.47 4.39
Salt 4.99 3.95 2.92 1.88 0.84
L-Lisyne HCl 78.8 % 1.56 1.88 2.19 2.51 2.82 DL-Methionine 99 % 2.34 2.29 2.24 2.18 2.13 Vitamin supplementa 1.00 1.00 1.00 1.00 1.00
Mineral supplementb 0.50 0.50 0.50 0.50 0.50
Bacitracin Zinc 15 % 0.40 0.40 0.40 0.40 0.40 Salinomycin sodium 12 % 0.40 0.40 0.40 0.40 0.40 Choline Chloride 70 % 0.50 0.40 0.30 0.20 0.10 L-Threonine 98 % 0.38 0.46 0.54 0.62 0.70 Sodium bicarbonate 0.00 1.07 2.13 3.20 4.26 Potassium Chloridec 0.00 0.03 0.07 0.10 0.13
Adsorbentd 3.00 3.00 3.00 3.00 3.00
Total 1,000 1,000 1,000 1,000 1,000 Calculated Composition
Metabolizable Energy, MJ kg–1 13.2 13.2 13.2 13.2 13.2
Crude protein, g kg–1 207.0 207.0 207.0 207.0 207.0
Calcium, g kg–1 8.79 8.79 8.79 8.79 8.79
Available phosphor, g kg–1 4.39 4.39 4.39 4.39 4.39
Digestible amino acids, g kg–1
Methionine+Cystine, g kg–1 8.00 8.00 8.00 8.00 8.00
Lysine 11.27 11.27 11.27 11.27 11.27 Threonine 7.32 7.32 7.32 7.32 7.32 Tryptophan 2.29 2.19 2.09 2.00 1.90 Arginine 13.16 12.98 12.79 12.61 12.42 Leucine 16.62 16.55 16.47 16.39 16.31
Valine 8.68 8.70 8.71 8.73 8.75
Isoleucine 9.49 9.30 9.12 8.94 8.76 Fat, g kg–1 79.25 75.49 71.73 67.96 64.20
Sodium, g kg–1 2.16 2.16 2.16 2.16 2.16
Potassium, g kg–1 7.94 7.44 6.94 6.44 5.95
Chloride, g kg–1 3.43 2.98 2.53 2.08 1.63
Choline, mg kg–1 1319 1394 1468 1542 1617
Crude fiber, g kg–1 28.49 26.61 24.73 22.85 20.98
EBe, mEq kg–1 200 200 200 200 200 aWarrant level per product kg: Vitamin A, 7.500.000 UI; Vitamin D3, 2.500.000
UI; Vitamin E, 18.000 mg; Vitamin B12, 12.500 mg; Vitamin K3, 1.200 mg; Niacin, 35.000 mg; Pyridoxine, 2.000 mg; Riboflavine, 5.500 mg; Thiamine, 1.500 mg; Biotin, 67 mg; Calcium pantothenate, 10.000 mg; Folic acid, 550 mg; Antioxidant, 5.000 mg; bWarrant level per product kg: Iron, 60.000 mg;
Copper,: 13.000 mg; Manganese, 120.000 mg; Zinc, 100.000 mg; Iodine,: 2.500 mg; Selenium, 500 mg; cPure for analysis; dDemicotoxin adsorbent,
Aluminosilicate; eEB, electrolytic balance.
Data Collection
The weight gain (WG) and feed intake were re-corded weekly. To correct the feed intake (FI) and feed conversion ratio (FCR), the mortality occurring during the experimental period was computed. At the end of
the performance experiment ( 42 days), two birds with the mean weight were selected and identified to repre-sent the experimental unity in weight evaluation and in the carcass and parts yield. After being selected, the birds were submitted to 6 h of fasting. The birds
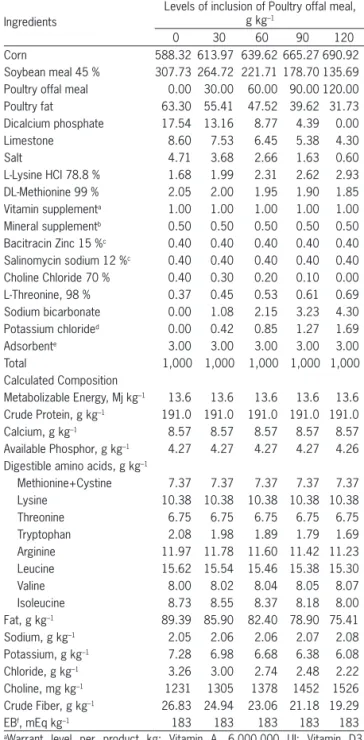
Table 5 – Ingredients and chemical composition of experimental diets for 28 to 42 day old.
Ingredients
Levels of inclusion of Poultry offal meal, g kg–1
0 30 60 90 120
Corn 588.32 613.97 639.62 665.27 690.92 Soybean meal 45 % 307.73 264.72 221.71 178.70 135.69 Poultry offal meal 0.00 30.00 60.00 90.00 120.00 Poultry fat 63.30 55.41 47.52 39.62 31.73 Dicalcium phosphate 17.54 13.16 8.77 4.39 0.00
Limestone 8.60 7.53 6.45 5.38 4.30
Salt 4.71 3.68 2.66 1.63 0.60
L-Lysine HCl 78.8 % 1.68 1.99 2.31 2.62 2.93 DL-Methionine 99 % 2.05 2.00 1.95 1.90 1.85 Vitamin supplementa 1.00 1.00 1.00 1.00 1.00
Mineral supplementb 0.50 0.50 0.50 0.50 0.50
Bacitracin Zinc 15 %c 0.40 0.40 0.40 0.40 0.40
Salinomycin sodium 12 %c 0.40 0.40 0.40 0.40 0.40
Choline Chloride 70 % 0.40 0.30 0.20 0.10 0.00 L-Threonine, 98 % 0.37 0.45 0.53 0.61 0.69 Sodium bicarbonate 0.00 1.08 2.15 3.23 4.30 Potassium chlorided 0.00 0.42 0.85 1.27 1.69
Adsorbente 3.00 3.00 3.00 3.00 3.00
Total 1,000 1,000 1,000 1,000 1,000
Calculated Composition
Metabolizable Energy, Mj kg–1 13.6 13.6 13.6 13.6 13.6
Crude Protein, g kg–1 191.0 191.0 191.0 191.0 191.0
Calcium, g kg–1 8.57 8.57 8.57 8.57 8.57
Available Phosphor, g kg–1 4.27 4.27 4.27 4.27 4.26
Digestible amino acids, g kg–1
Methionine+Cystine 7.37 7.37 7.37 7.37 7.37 Lysine 10.38 10.38 10.38 10.38 10.38 Threonine 6.75 6.75 6.75 6.75 6.75 Tryptophan 2.08 1.98 1.89 1.79 1.69 Arginine 11.97 11.78 11.60 11.42 11.23 Leucine 15.62 15.54 15.46 15.38 15.30
Valine 8.00 8.02 8.04 8.05 8.07
Isoleucine 8.73 8.55 8.37 8.18 8.00 Fat, g kg–1 89.39 85.90 82.40 78.90 75.41
Sodium, g kg–1 2.05 2.06 2.06 2.07 2.08
Potassium, g kg–1 7.28 6.98 6.68 6.38 6.08
Chloride, g kg–1 3.26 3.00 2.74 2.48 2.22
Choline, mg kg–1 1231 1305 1378 1452 1526
Crude Fiber, g kg–1 26.83 24.94 23.06 21.18 19.29
EBf, mEq kg–1 183 183 183 183 183 aWarrant level per product kg: Vitamin A, 6.000.000 UI; Vitamin D3,
2.000.000 UI; Vitamin E, 12.000 mg; Vitamin B12, 12.000 mg; Vitamin K3, 800 mg; Niacin, 30.000 mg; Pyridoxine, 1.500 mg; Riboflavine, 4.500 mg; Thiamine, 1.000 mg; Biotin, 50 mg; Calcium pantothenate, 10.000 mg; Folic acid, 550 mg; Antioxidant, 5.000 mg; bWarrant level per product kg: Iron,
60.000 mg; Copper, 13.000 mg; Manganese, 120.000 mg; Zinc, 100.000 mg; Iodine, 2.500 mg; Selenium, 500 mg; cIn the last week of breeding, they
were sacrificed using the cervical dislocation method. After this procedure the birds were exsanguinated, carcasses were scalded, plucked eviscerated and weighed without the head, neck, lungs and feet. The carcasses were immersed in water at a temperature close to 4 ºC for 10 min, and then, the carcasses were weighed to obtain the weight of the cold carcass. Next, the cuts were performed, separating the prime cuts (breast, drumstick and thigh) and the wings and back, all of them with skin. The abdominal fat value was obtained by adding up the fat from the abdominal re-gion and the fat from the gizzard. The characteristics of the evaluated carcasses included the weight of the cold carcass, the weight of the cuts (breast, drumstick, thigh and wing), and the percentage of abdominal fat. The cold carcass yield was determined in relation to the weight at slaughter. The yield of the parts and the abdominal fat were obtained in relation to the cold carcass weight.
Statistical Analysis
The performance and carcass data from the broiler chickens were submitted initially to analysis to verify the normality of errors and homogeneity of variance using the Cramer-von Mises and Brown and Forsythe tests, respectively. Once the presuppositions were sat-isfied in relation to the data, the data were submitted to analysis of variance, considering a probability
sig-nificance of p≤ 0.05. The mathematical models
consid-ered in the analysis of the data were linear, quadratic polynomial, broken line and segmented of two slopes (Robbins et al., 2006). The choice of regression model, the significance level and the coefficient of determina-tion were considered as R² = SQmodel/SQtreatment.
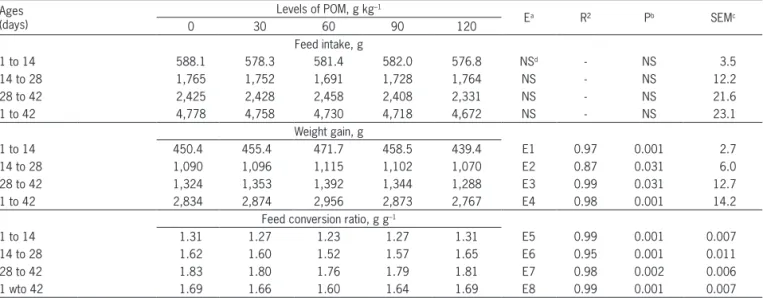
Table 6 – Means of feed intake, weight gain, and feed conversion ratio of birds fed diets with different levels of poultry offal meal (POM) during the different ages.
Ages (days)
Levels of POM, g kg–1
Ea R² Pb SEMc
0 30 60 90 120
Feed intake, g
1 to 14 588.1 578.3 581.4 582.0 576.8 NSd - NS 3.5
14 to 28 1,765 1,752 1,691 1,728 1,764 NS - NS 12.2
28 to 42 2,425 2,428 2,458 2,408 2,331 NS - NS 21.6
1 to 42 4,778 4,758 4,730 4,718 4,672 NS - NS 23.1
Weight gain, g
1 to 14 450.4 455.4 471.7 458.5 439.4 E1 0.97 0.001 2.7
14 to 28 1,090 1,096 1,115 1,102 1,070 E2 0.87 0.031 6.0
28 to 42 1,324 1,353 1,392 1,344 1,288 E3 0.99 0.031 12.7
1 to 42 2,834 2,874 2,956 2,873 2,767 E4 0.98 0.001 14.2
Feed conversion ratio, g g–1
1 to 14 1.31 1.27 1.23 1.27 1.31 E5 0.99 0.001 0.007
14 to 28 1.62 1.60 1.52 1.57 1.65 E6 0.95 0.001 0.011
28 to 42 1.83 1.80 1.76 1.79 1.81 E7 0.98 0.002 0.006
1 wto 42 1.69 1.66 1.60 1.64 1.69 E8 0.99 0.001 0.007
aE, regression equation; bP, probability; cSEM, standard error of the mean; dNS, non significant, p > 0.05. Weight gain: E1,
WG=471.4-0.338×(67.12-POM)-0.605×(POM-67.12); E2, WG=1086+0.919×POM-0.0086×POM²; E3, WG=1398-1.264×(60.78-POM)-1.86×(POM-60.78); E4, WG=2860-2.0286×(65.33-POM)-3.519×(POM-65.33). Feed conversion ratio: E5, FC=1.231+0.00119×(62.72-POM)+0.00143×(POM-62.72); E6, FC=1.5116+0.00176×(67.71-POM)+0.00262×(POM-67.71); E7, FC=1.7607+0.00115×(60-POM)+0.000863×(POM-60); E8, FC=1.5995+0.00148×(61.61-POM)+0.00148×(POM-61.61).
The statistical procedures were conducted using PROC NLMIXED in SAS (Statistical Analysis System, version 9.2).
Results
The normality presuppositions of errors and ho-moscedasticity of variance for the performance and car-cass results were tested and satisfied.
Performance of Broiler Chickens
The inclusion of POM in the diets favored the WG of the poultry (Table 6). Therefore, it is estimated that the best response to WG occurs with the inclusion of 67.12
g kg–1 of POM, producing a WG of 471.4 g per bird (E1,
WG=471.4-0.338×(67.12-POM)-0.605×(POM-67.12). In the growing (14-28 days) and final phases (28-42 days), the equations for WG, in the respective phases, also sug-gest levels of 53.4 and 63 g kg–1, respectively for
maxi-mum performance. These events contributed to improve the FCR of the birds fed with a ration containing POM. According to the equations presented in Table 6, the
in-clusion of 62 g kg–1 POM in the diet enabled the best
FCR throughout the entire period (1-42 days) of the ex-periment.
Carcass Yield of Broiler Chickens
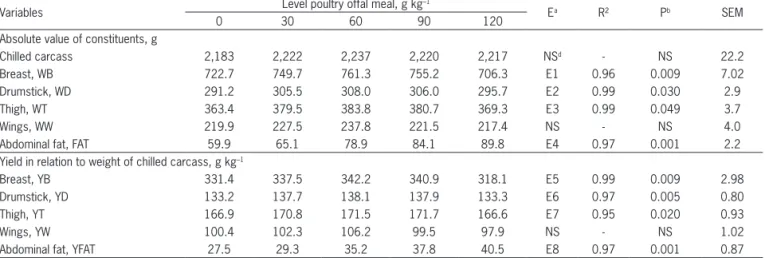
As for the carcass constituents (Table 7), the major-ity of the absolute values (weight of cold carcass, breast, drumstick, thigh and wings) showed quadratic behavior, and the higher and lower estimated levels were found to be 57.1, 63.1 and 64.0 g kg–1 of POM for the breast,
in the birds increased by approximately 2.62 grams for each percentage point of POM included in the diet (E4, FAT =59.81+2.62×POM, R² = 96.78 %).
The yield of the carcass parts in relation to the chilled carcass, shown in Table 7, was influenced by the treatments. The greatest improvement achieved in the yield of prime cuts occurred when an estimated mean of 67 g kg–1 POM was included in the diet (82, 60, 60 g
kg–1 of POM for the best yield in the breast, drumstick
and thigh, respectively), which may be attributed to the amino acid balance of the diets.
Discussion
Performance of Broiler Chickens
From 1 to 42 days, the treatments had no effect on FI. The first three limiting amino acids (methionine+cystine, lysine and threonine) were affected but this not the tryp-tophan. The amino acid levels are related to the regula-tion of intake by means of serotonin, ghrelin and gastric inhibitory peptide; such hormones involve tryptophan in their synthesis mechanism (Tsiolakis and Marks, 1984; Zhang et al., 2007). Variations of the plasmatic levels interfered with the standard consumption of swine and birds, as reported by Geelissen et al. (2006).
The magnitude of the effects of the tryptophan level on the feed may be inferred, although such mecha-nisms are still only partially explained in birds, because some formulations of POM tested with high levels and, without supplementation with synthetic amino acids, became deficient in this amino acid. Bellaver et al. (2001) used formulations based on corn and soybean meal with
the inclusion of 140 g kg–1 of POM without tryptophan
supplementation, and did not verify the effect of trypto-phan on FI. Hassanabadi et al. (2008) also verified simi-lar behavior with the inclusion of 150 g kg–1 of POM in
diets based on corn (Zea mays), soybean (Glycine max), wheat (Triticum spp.) and meat meal.
The increased inclusion of POM and the supple-mentation of synthetic amino acids in the feed, with a subsequent decrease of soybean, demonstrated positive effects. That effect may be related to an improvement in the osmolarity of the birds’ digestion by decreasing viscosity (Leske and Coon, 1999). Such a condition is essential to obtaining optimal activity of the hydrolytic enzymes present within the intestinal lumen.
Leske and Coon (1999) also reported that a de-crease of soybean oligosaccharide (galactosides) en-hanced the use of the essential amino acids (3.3; 4.4 and 5.6 % for lysine, threonine and methionine, respec-tively), and non-essential amino acids increased digest-ibility by 11.7 % (alanine). Thus, the decrease of such constituents by the removal of soybean meal from the diet may have improved hydrolysis in the lumen and in the intestinal mucosa.
Another hypothesis refers to the presence of pro-tease inhibitors in the composition of soybean meal that, as reported by Feng et al. (2007), correspond to almost
3 mg g–1 of soybean dry matter. The use of processing
to avoid such undesirable components is unavoidable. Parsons (1996) found a reduction of digestible lysine by 14.3 and 24.2 %, respectively, when the processing of soybean meal moved from mild to severe. The alteration in the diet’s digestible lysine directly affects the relation-ships between amino acids that use lysine as a reference. This hypothesis is derived from the fact that inclusion of POM has improved the relation of lysine/amino acids in the diet. Bellaver et al. (2001) also verified improved per-formance for birds fed with POM. Superiority in WG was attributed to the improved balance of amino acids offered with the inclusion of 73.7 g kg–1 of POM in the diet, with
supplementation of synthetic methionine and lysine.
Table 7 – Absolute values, carcass and commercial parts yield of broilers fed diets with different levels of poultry offal meal (POM) at 42 days old.
Variables Level poultry offal meal, g kg
–1
Ea R² Pb SEM
0 30 60 90 120
Absolute value of constituents, g
Chilled carcass 2,183 2,222 2,237 2,220 2,217 NSd - NS 22.2
Breast, WB 722.7 749.7 761.3 755.2 706.3 E1 0.96 0.009 7.02
Drumstick, WD 291.2 305.5 308.0 306.0 295.7 E2 0.99 0.030 2.9
Thigh, WT 363.4 379.5 383.8 380.7 369.3 E3 0.99 0.049 3.7
Wings, WW 219.9 227.5 237.8 221.5 217.4 NS - NS 4.0
Abdominal fat, FAT 59.9 65.1 78.9 84.1 89.8 E4 0.97 0.001 2.2
Yield in relation to weight of chilled carcass, g kg–1
Breast, YB 331.4 337.5 342.2 340.9 318.1 E5 0.99 0.009 2.98
Drumstick, YD 133.2 137.7 138.1 137.9 133.3 E6 0.97 0.005 0.80
Thigh, YT 166.9 170.8 171.5 171.7 166.6 E7 0.95 0.020 0.93
Wings, YW 100.4 102.3 106.2 99.5 97.9 NS - NS 1.02
Abdominal fat, YFAT 27.5 29.3 35.2 37.8 40.5 E8 0.97 0.001 0.87
aE, regression equation; bP, probability; cSEM, standard error of the mean; dNS, non significant, p > 0.05. Absolute value of constituents: E1,
Some authors found an equivalence between the protein, POM and soybean meal sources during this phase (Bellaver et al., 2001; Caires et al., 2010), which did not occur in the present study, in which the results obtained in the initial phase were maintained in the subsequent phases. Currently, data regarding the amino acid digestibility of ingredients are used to formulate feed for birds. The experimental feed was formulated in this way; however, the differences were maintained in the growth and final phases. This finding is attributed to a possible improvement in the availability of amino ac-ids in the diet, above all lysine, with the removal of 280
g kg–1 of protein from the soybean meal, assuming that
the processing of the feed may have caused greater inci-dence of lysine complex, which is reported to disappear in the gastrointestinal tract but is not used in protein anabolism (Plakas et al., 1988).
The POM and the soybean meal, similarly, use temperature as a main agent during processing, and among the factors that interfere in the quality of protein in food, the thermal treatment stands above all else. This step is necessary because both ingredients require de-naturing and annulling of possible anti-nutritional and microbiological activities.
The occurrence of amino acid-carbohydrate com-bination complex is common and may be aggravated ac-cording to the degree of processing (Parsons, 1996). These include groupings, such as N 1-(1-deoxy-D-fructosyl)-Ly-sine, derived by the condensation of the -NH2 groups from residual lysine and the carbonyl groups of reducing sugars (glucose, fructose, lactose or maltose), by means of the Maillard reaction. Such an event may cause a de-crease in available lysine content, which means that in-testinal absorption still takes place (Plakas et al., 1985); however, at the cell level, the transcription by tRNAlis
does not occur once this messenger is specific; conse-quently, the reading is not carried out, and codification to protein synthesis does not occur (Voet and Voet, 2010).
The greater efficiency of nutrients and energy in the diets with POM may be inferred to decrease the an-ti-nutritive compounds, such as trypsin and galactoside, present in soybean. Feng et al. (2007) quantified the en-zymatic activity (in units of substrate composed per mil-ligram of dry matter from digestion) in the duodenum, jejunum and ileum and verified an increase of 52 % in the proteolytic activity of trypsin in the duodenum and jejunum, with a decrease of this compound within the lumen. Furthermore, this activity increases the height of the villus and the depth of the crypt in the three seg-ments of the large intestine, resulting in greater capacity of digestion and absorption. Such effects were verified by Mendonça Jr and Jensen (1989) using another methodol-ogy, in growth experiments, with the inclusion of 100 g
kg–1 POM in diets based on corn, soybean and chicken
fat. By means of partial collection of the excrement with 20 g kg–1 of chromic oxide, the authors observed that the
inclusion of POM increased the capacity for metaboliz-ing energy from the diet by up to 5.2 percentile units.
This greater assimilation reflects a significant improve-ment in the birds’ FCR.
Escalona and Pesti (1987) conducted two experi-ments. During the first, they verified in practical diets (with supplementation of methionine) based on corn and soybean meal that reaching 13.1 g kg–1 of total lysine did
not overcome the FCR of birds fed with 50 g kg–1 POM,
reaching 12.4 g kg–1 total lysine. The second experiment
used just one different POM from another poultry ren-dering plant; the referred authors verified that the result obtained with inclusion of POM (5 to 10 %) in practical diets is not linear and depends on the POM used. The birds fed with inclusion of POM were less efficient, even with supplementation of lysine in the diet.
Carcass Yield of Broiler Chickens
A linear effect on abdominal fat with the replace-ment of POM in the diets of 0.115 g kg–1 (per unit
inclu-sion) was observed. Mendonça Jr and Jensen (1989) and Hassanabadi et al. (2008) also verified that inclusion of POM in diets based on corn and soybean increased the deposition of fat by the birds. The greater disposition of FAT with inclusion of the POM is a proof that with a bet-ter usage of nutrients and energy, when an imbalance of amino acids occurs in the diet, the FAT tends to decrease (Yeh and Leveille, 1969; Cabel et al., 1988).
Aletor et al. (2000) verified that as the crude pro-tein of the diet was reduced by using synthetic amino acid supplementation, the amino acid profile of the diet improved, which was later reflected in the lysine reten-tion in the carcass and a greater deposireten-tion of FAT by the bird. This is because enzymes that are part of the synthe-sized complex in lipogenesis are sensitive to the levels of NAD; therefore, the equivalent of NADH reduction to NADP+ by the enzymes (NAD-malic dehydrogenase and malic enzyme) must be favored, so that biosynthesis of fatty acids may occur (Yeh and Leveille, 1969).
When an imbalance occurs, it causes an increase in the enzymatic activities of glutamic oxaloacetic trans-aminase and isocitrate dehydrogenase, which demand, via mitochondrial citrate, the intermediary alpha keto-glutaric acid that depends on NADPH for its activation (Rosebrough et al., 1990). The carbonic structure in the gluconeogenic process, converted into glucose, reduces the equivalent of the reduction (of NADPH levels) nor-mally required by the addition of residues of acetyl dur-ing lipogenesis. In this way, through the decrease of the citrate and NADPH levels, the decrease of malic enzyme activity is verified. This is aggravated in birds, as there are reports that the carbonic structure cannot maintain the levels of NADPH by the pentose cycle (Yeh and Lev-eille, 1969).
In conclusion, the performance of poultry and improvement in the carcass and prime cuts were
maxi-mized with the inclusion of 53 to 67 g kg–1 POM,
re-spectively, in the diet, and the inclusion of 120 g kg–1
Acknowledgments
The authors thank CNPq (Brazilian National Council for Scientific and Technological Development) for providing the scholarship, Banco do Nordeste for financing the research, Agropecuária Serrote Redondo Company for donating the poultry offal meal, and the Pro-rectory of the Graduate School of the Federal Rural University of Pernambuco for financial aid to publish this article.
References
Aletor, V.A.; Hamid, I.I.; Nieb, E.; Pfeffer, E. 2000. Low-protein amino acid-supplemented diets in broiler chickens, effects on performance, carcass characteristics, whole-body composition and efficiencies of nutrient utilization. Journal of the Science of Food and Agriculture 80: 547-554.
Bellaver, C.; Brum, P.A.R.; Lima, G.M.M.; Boff, J.; Kerber, J. 2001. Partial substitution of soybean meal by poultry offal meal in diets balanced according to protein and total or digestible amino acids for broilers. Brazilian Journal of Poultry Science 3: 233-240 (in Portuguese, with abstract in English).
Cabel, M.C.; Goodwin, T.L.; Waldroup, P.W. 1988. Feather meal as nonspecific nitrogen source for fat reduction in broiler during the finishing period. Poultry Science 67: 300-306. Caires, C.; Fernandes, E.; Fagundes, N.; Carvalho, A.; Maciel,
M.; Oliveira, B. 2010. The use of animal byproducts in broiler feeds: use of animal co-products in broilers diets. Brazilian Journal of Poultry Science 12: 41-46.
Degussa AG. 1997. Amino Acid Recommendations for Poultry: Feed Formulation Guide. Degussa AG, Hanau, Germany. Escalona, R.R.; Pesti, G.M. 1987. Nutritive value of poultry
by-product meal. 3. Incorporation into practical diets. Poultry Science 66: 1067-1070.
Feng, J.; Liu, X.; Xu, Z.R.; Lu, Y.P.; Liu, Y.Y. 2007. Effects of fermented soybean meal on intestinal morphology and digestive enzyme activities in weaned piglets. Digestive Diseases and Sciences 52: 1845-1850.
Geelissen, S.M.; Swennen, Q.; Geyten, S.V.; Kühn, E.R.; Kaiya, H.; Kangawa, K.; Decuypere, E.; Buyse, J.; Darras, V.M. 2006. Peripheral ghrelin reduces food intake and respiratory quotient in chicken. Domestic Animal Endocrinology 30: 108-116. Hassanabadi, A.; Amanloo, H.; Zamanian. M. 2008. Effects of
substitution of soybean meal with poultry by-product meal on broiler chickens performance. Journal of Animal and Veterinary Advances 7: 303-307.
Leske, K.L.; Coon, C.N. 1999. Hydrogen gas production of broiler chicks in response to soybean meal and -galactoside free, ethanol-extracted soybean meal. Poultry Science 78: 1313-1316.
Mendonça Jr, C.X.; Jensen, L.S. 1989. Effect of formulating diets with different assigned energy data for poultry by-product meal on the performance and abdominal fat: content of finishing broilers. Poultry Science 68: 1672-1677.
Mongin, P. 1981. Recent advances in dietary anion-cation balance: applications in poultry. Proceedings of the Nutrition Society 40: 285-294.
National Research Council. 1994. Nutrient Requirements of Poultry. 9ed. National. Academies Press, Washington, DC, USA. Parsons, C.M. 1996. Digestible amino acids for poultry and swine.
Animal Feed Science and Technology 59: 147-153.
Plakas, S.M.; Lee, T.C.; Wolke, R.E.; Meade, T.L. 1985. Effect of maillard browning reaction on protein utilization and plasma amino acid response by rainbow trout (Salmo gairdneri). Journal of Nutrition 115: 1589-1599.
Plakas, S.M.; Lee, T.C.; Wolke, R.E. 1988. Bioavailability of lysine in maillard browned protein as determined by plasma lysine response in Rainbow Trout (Salmo gairdneri). Journal of Nutrition 118: 19-22.
Robbins, K.R.; Saxton, A.M.; Southern, L.L. 2006. Estimation of nutrient requirements using broken-line regression analysis. Journal Animal Science 84 E155-165.
Rosebrough, R.W.; Mitchell, A.D.; Von Vleck, M.F.; Steele, N.C. 1990. Protein and energy relations in the broiler chicken. British Journal of Nutrition 64: 515-523.
Rostagno, H.S.; Albino, L.F.T.; Donzele, J.L.; Gomes, P.C.; Oliveira, R.F.; Lopes, D.C.; Ferrreira, A.S; Barreto, S.L.T. 2005. Brazilian Tables for Poultry and Swine: Composition of Feedstuffs and Nutritional Requirements. UFV, Viçosa, MG, Brazil.
Silva, E.P.; Lima, M.B.; Rabello, C.B.V.; Ludke, J.V.; Albino, L.F.T.; Sakomura, N.K.; 2011. Nutritional aspects of poultry offal meal and its use for broiler chicken feeding. Acta Veterinaria Brasilica 5: 108-118 (in Portuguese, with abstract in English). Tsiolakis, D.; Marks, V. 1984. The differential effect of in
tragastric and intravenous tryptophan on plasma glucose, insulin, glucagon, GLI and GIP in the fasted rat. Hormone and Metabolic Research 16: 226-229.
Voet, D.; Voet, J.G. 2010. Biochemistry. 4ed. John Wiley, Hoboken, NJ, USA.
Yeh, Y.Y.; Leveille, G.A. 1969. Effect of dietary protein on hepatic lipogenesis in the growing chick. Journal of Nutrition 98: 356-366.