ISSN 0100-879X
BIOMEDICAL SCIENCES
AND
CLINICAL INVESTIGATION
www.bjournal.com.br
www.bjournal.com.br
Volume 44 (7) 606-728 July 2011
Braz J Med Biol Res, July 2011, Volume 44(7) 700-706
doi: 10.1590/S0100-879X2011007500073
Stability of relative oxygen pulse curve during repeated
maximal cardiopulmonary testing in professional soccer
players
R.R. Perim, G.R. Signorelli and C.G.S. Araújo
Faculdade de Medicina de Ribeirão Preto Campus
Ribeirão Preto
Institutional Sponsors
The Brazilian Journal of Medical and Biological Research is partially financed by
analiticaweb.com.br S C I E N T I F I C Hotsite of proteomics metabolomics
Stability of relative oxygen pulse curve during
repeated maximal cardiopulmonary testing
in professional soccer players
R.R. Perim
1, G.R. Signorelli
1and C.G.S. Araújo
1,21Programa de Pós-Graduação em Educação Física, Universidade Gama Filho, Rio de Janeiro, RJ, Brasil 2Clínica de Medicina do Exercício (Clinimex), Rio de Janeiro, RJ, Brasil
Abstract
During cardiopulmonary exercise testing (CPET), stroke volume can be indirectly assessed by O2 pulse profile. However, for a
valid interpretation, the stability of this variable over time should be known. The objective was to analyze the stability of the O2 pulse curve relative to body mass in elite athletes. VO2, heart rate (HR), and relative O2 pulse were compared at every 10%
of the running time in two maximal CPETs, from 2005 to 2010, of 49 soccer players. Maximal values of VO2 (63.4 ± 0.9 vs
63.5 ± 0.9 mL O2.kg-1.min-1), HR (190 ± 1 vs 188 ± 1 bpm) and relative O2 pulse (32.9 ± 0.6 vs 32.6 ± 0.6 mL O2.beat-1.kg-1)
were similar for the two CPETs (P > 0.05), while the final treadmill velocity increased from 18.5 ± 0.9 to 18.9 ± 1.0 km/h (P <
0.01). Relative O2 pulse increased linearly and similarly in both evaluations (r2 = 0.64 and 0.63) up to 90% of the running time.
Between 90 and 100% of the running time, the values were less stable, with up to 50% of the players showing a tendency to a
plateau in the relative O2 pulse. In young healthy men in good to excellent aerobic condition, the morphology of the relative O2
pulse curve is consistent up to close to the peak effort for a CPET repeated within a 1-year period. No increase in relative O2 pulse at peak effort could represent a physiologic stroke volume limitation in these athletes.
Key words: Exercise testing; Sport cardiology; Maximal oxygen uptake; Stroke volume; Ramp protocol; Heart rate
Introduction
Correspondence: C.G.S. Araújo, Clinimex - Clínica de Medicina do Exercício, Rua Siqueira Campos, 93/101, 22031-070 Rio de Janeiro, RJ, Brasil. Fax: +55-21-2549-4295. E-mail: [email protected]
Received December 1, 2010. Accepted May 24, 2011. Available online June 17, 2011. Published July 25, 2011.
During a maximum cardiopulmonary exercise testing (CPET), also known as ergospirometry (1), an integrated evaluation of the cardiorespiratory responses is possible through the quantification of expired volume and analysis of gas fractions. Among the various indices obtained during CPET, the O2 pulse, the ratio between oxygen consumption (VO2) and heart rate (HR), is one of the most important, due to its physiological and clinical implications (2). By re-arranging the Fick equation, it is numerically equivalent to the product of stroke volume and the arteriovenous oxygen difference. Although the arteriovenous oxygen gradient is directly related to maximum aerobic power, its curve profile during progressive maximal exercise testing is relatively uniform for almost all subjects, excluding those with some specific myopathies (3).
Thus, different investigators using distinct populations and/or clinical and sports settings have proposed that the O2 pulse can indirectly reflect stroke volume, so that both the maximum value and the curve shape, which are a
function of CPET duration, will be directly associated with cardiac inotropism and lusitropism (4-10). In this context, several studies have shown that relatively low maximum O2 pulse values are associated with a lower survival rate among middle-aged individuals as well as patients with heart failure (11,12), most likely reflecting impaired inotropic and/or lusitropic capacity and then disturbing the stroke volume response to exercise. In addition, the shape of the O2 pulse curve during progressively more intense exercise is equally important, since it may be altered in a variety of situations, such as the presence of coronary artery disease (3,13). Therefore, recent evidence has pointed to a role for O2 pulse data as an important clinical tool to detect severe myocardial ischemia (10,14,15).
interpreta-Oxygen pulse stability during maximal exercise testing 701
tion of this variable - maximum O2 pulse value and curve shape -, it is worthwhile to know its intra-individual variability over a given time interval, which is also called late reliability or stability. However, at the best of our knowledge, stability of the maximum value and shape of the O2 pulse curve during repeated annual evaluations in healthy and young athletes has not yet been determined.
Thus, our objective was to determine if the O2 pulse - maximum value relative to body mass and curve shape - is stable in young and aerobically fit athletes over a given period of time.
Material and Methods
Sample
We retrospectively analyzed data from sports medicine evaluations of 207 professional soccer players from the first professional league of Brazil (Rio de Janeiro) and Angola overseen by our research team from January 2005 to January 2010. Only players who met the following inclusion criteria were selected for the study: a) having undergone at least two truly maximum CPETs (see criteria in the next section); b) not having interrupted the sports training routine due to injury for more than three months between evalu-ations; c) not having changed clinical condition or regular use of potentially relevant medications (capable of affect-ing HR and VO2) between the two CPETs; d) presenting a difference of 15 bpm or less in maximum HR between the two evaluations, and e) having remained in the same soccer club between evaluations. The players included in this study were also subjected to clinical evaluation to rule out the existence of relevant illnesses that could affect the results or competitive eligibility. Any resting electro-cardiogram abnormalities compatible with an athlete’s past and present sports history were identified and, when necessary, confirmed as physiological adaptations based on echocardiogram findings (17). Furthermore, as part of the medical-functional evaluations of these players, rest-ing spirometry, anthropometry, body composition, balance, agility, flexibility, muscle strength and power, and cardiac vagal tone were also assessed. It should be emphasized that all subjects were elite athletes, competing for several years at a high level in their respective professional leagues, following training protocols commonly observed for this sports modality.
After applying the inclusion criteria, we were able to select 49 players, 38 Brazilians and 11 Angolans. Age, body mass, and height of the players ranged from 18 to 31 years, 57.5 to 92.7 kg, and 165 to 190 cm, respectively. The average interval between evaluations was 12 months, ranging from 2 to 24 months. Before data collection, all subjects signed an informed consent form explicitly au-thorizing the procedures undertaken and the use of the data (excluding identifiable information) for research and statistical purposes. Helsinki declaration procedures were
followed. The use of our data for retrospective analysis has been formally approved by an institutional Ethics Committee (SINEP-MS/SUPREMA).
Maximum cardiopulmonary exercise testing
We used a single ramp protocol on an ATL Master treadmill (Inbrasport, Brazil), aiming to achieve a maximum duration of 10 to 15 min. After 1 min at 5.5 km/h, the velocity was suddenly changed to 8 km/h and then increased by 0.1 km/h every 7.5 s (0.8 km/h for each minute). Immediately after maximum tolerable velocity was reached, the treadmill velocity was reduced to 5.5 km/h and then maintained for 2 min. Considering the characteristics of soccer, no treadmill incline was used. The criteria we adopted to guarantee a maximum test were: a) voluntary exhaustion achieved despite intense verbal stimulation and accompanied by a maximum effort sensation (a grade of 10 on the Borg 0-10 scale); b) ventilation curve pattern suggesting that a ventilatory threshold was surpassed, and c) a respiratory exchange ratio greater than 1.1. The maximal HR obtained was not used as a criterion to define maximum CPET. None of the CPETs were interrupted early for clinical reasons or due to technical problems with the execution. The expired gas was collected through a preVent™ Pneumotach (Med-Graphics, USA) attached to a mouthpiece in order to collect saliva. A nose clip was also used to warrant complete nasal occlusion. Pulmonary ventilation was quantified, and the partial oxygen and carbonic gas fractions were analyzed and expressed every 10 s by a VO2000 Metabolic Analyzer (MedGraphics), which was periodically calibrated with a 2-L syringe and with gases of known concentrations.
Cardiorespiratory measurements
Considering the clearly non-linear increase in energetic requirements during the first 2 min of the ramp protocol, due to the transition from rest to a low-intensity run (quickly changing from approximately 1.5 to 9 metabolic equivalents), data analysis was started at the end of the second minute of the CPET, when the treadmill velocity reached 8.8 km/h.
HR was sampled every 10 s from a continuous record in a single lead (normally CC5 or CM5) obtained from a Micromed digital electrocardiograph with the Elite ErgoPC software, versions 3.2.1.5/3.3.6.2 (Micromed, Brazil). Sub-sequently, in order to eliminate possible artifacts, HR values were visually confirmed, and when the difference between two consecutive 10-s measurements exceeded 5 beats, the electrocardiographic tracing was visually inspected, the duration of 5 RR intervals was precisely measured, and HR values corrected. In fewer than 3% of cases, due to tracing artifacts, HR values had to be interpolated by assuming linearity of the curve. Maximum HR was defined as the highest HR value recorded from the 10-s interval readings during CPET.
val-ues were calculated from the average of the six readings obtained at each minute, which were then normalized to body mass; maximum VO2 was taken as the greatest 1-min VO2 value. O2 pulse was calculated every 10 s from the VO2/HR ratio. The same criterion described above for VO2 was applied to determine the maximum O2 pulse value. Again, in order to eliminate the influence of body mass on O2 pulse values, an effect that occurs with VO2, the values were also expressed by dividing the absolute O2 pulse (mL O2.kg-1.min-1) by the athlete’s body mass (kg), as done in other studies (11,12). To facilitate reading of the data, the relative O2 pulse values were multiplied by 100 in all calculations, tables, and figures of the study.
Statistical analysis
Since some of the variability was likely to occur in the aerobic fitness of the players and, therefore, in the two CPET durations, the VO2, HR, and relative O2 pulse values were calculated at every 10% of the maximum running time (beginning at 8.8 km/h) for each evaluation. We compared the HR, relative VO2 and O2 pulse values every 10% of the individual time interval during CPET by two-way ANOVA (with group and % of CPET duration as factors), with Bon-ferroni’s corrections as post hoc procedures as needed.
By linear regression analysis, the coefficients of deter-mination and the slope and intercept values of the relative O2 pulse curves as a function of % of the CPET duration were obtained. For comparisons of these variables and for other measurements taken in the study, such as age, body mass, height, and resting HR, a two-tailed paired t-test was
used. Finally, to more closely analyze the final part of the
maximum CPET, we identified the number of players that did not show an increase of more than 1% in relative O2 pulse values between the last 2 min of the CPET, meaning that they had a plateau or a decline at the end of the curve, and compared their frequency for the two maximum CPETs by the chi-square test.
We considered P < 0.05 as the criterion for statistical sig -nificance. All data are reported as means + SD, except where specifically noted, and all analyses were carried out using the Prism 5 software, version 5.01 (GraphPad, USA).
Results
The body mass of the players was slightly greater (around 1 kg) at reevaluation (P < 0.01), but height (P = 0.16) and HR at rest (P = 0.79) did not change. The maximum velocity reached, and thus the duration of the CPET, were also slightly greater at reevaluation (P < 0.01), increasing, on average, by 0.4 km/h and 30 s, respectively. The VO2 and the velocity reached at the anaerobic threshold (P = 0.95) were virtually identical in both evaluations, while HR was 3 bpm less at reevaluation, with no significant differ -ence between them.
ANOVA indicated that the values for relative VO2, HR, and relative O2 pulse progressively increased, essentially every 20% of the CPET duration (P < 0.01). However, when the results of the two evaluations were compared, HR was highest in the first evaluation between 10 and 30% of the maximum CPET time and remained stable from then on, but neither VO2 nor O2 pulse differed during any of the time ranges analyzed (P > 0.05). Table 1 shows the demographic
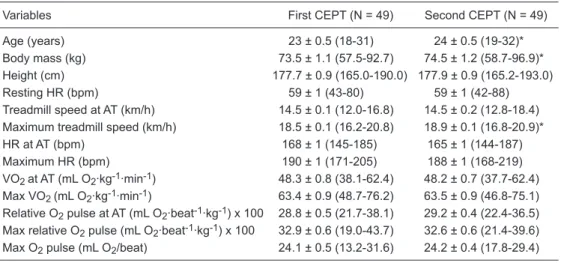
Table 1. Anthropometric and physiological variables of professional soccer players on the occasion of two
CPETsessions.
Variables First CEPT (N = 49) Second CEPT (N = 49)
Age (years) 23 ± 0.5 (18-31) 24 ± 0.5 (19-32)* Body mass (kg) 73.5 ± 1.1 (57.5-92.7) 74.5 ± 1.2 (58.7-96.9)* Height (cm) 177.7 ± 0.9 (165.0-190.0) 177.9 ± 0.9 (165.2-193.0) Resting HR (bpm) 59 ± 1 (43-80) 59 ± 1 (42-88) Treadmill speed at AT (km/h) 14.5 ± 0.1 (12.0-16.8) 14.5 ± 0.2 (12.8-18.4) Maximum treadmill speed (km/h) 18.5 ± 0.1 (16.2-20.8) 18.9 ± 0.1 (16.8-20.9)* HR at AT (bpm) 168 ± 1 (145-185) 165 ± 1 (144-187) Maximum HR (bpm) 190 ± 1 (171-205) 188 ± 1 (168-219) VO2 at AT (mL O2·kg-1·min-1) 48.3 ± 0.8 (38.1-62.4) 48.2 ± 0.7 (37.7-62.4) Max VO2 (mL O2·kg-1·min-1) 63.4 ± 0.9 (48.7-76.2) 63.5 ± 0.9 (46.8-75.1) Relative O2 pulse at AT (mL O2·beat-1·kg-1) x 100 28.8 ± 0.5 (21.7-38.1) 29.2 ± 0.4 (22.4-36.5) Max relative O2 pulse (mL O2·beat-1·kg-1) x 100 32.9 ± 0.6 (19.0-43.7) 32.6 ± 0.6 (21.4-39.6) Max O2 pulse (mL O2/beat) 24.1 ± 0.5 (13.2-31.6) 24.2 ± 0.4 (17.8-29.4)
Data are reported as the mean ± SEM (range). CPET = cardiopulmonary exercise testing; HR = heart rate; AT = anaerobic threshold; Max VO2 = maximal oxygen consumption; Max O2 pulse = maximal oxygen
Oxygen pulse stability during maximal exercise testing 703
characteristics and the main cardiorespiratory responses of the players during the two CPETs.
The mean values of the coefficients of determination of the relative O2 pulse curve as a function of CPET duration were virtually identical in the first and second evaluations, i.e., 0.64 and 0.63, respectively. The slope and intercept values of the relative O2 pulse curves were 0.013 ± 0.007 and 23 ± 3.1 for the first evaluation, and 0.012 ± 0.007 and 23 ± 4.3 for the second evaluation, respectively. There were no significant differences when the slopes (P = 0.44) and the intercepts (P = 1.00) of the relative O2 pulse curves were compared between the two CPETs. Data from the final 2 min of CPET showed that 15 (30%) players had a plateau or a decline at the end of the relative O2 pulse curve in the first evaluation, and 25 (51%) in the second evaluation (P = 0.06); this phenomenon coincided for just 8 players in the two evaluations.
Discussion
The present study sought to determine the stability of the relative O2 pulse curves in a group of elite professional soccer players who were reevaluated after an average interval of 1 year. We should emphasize that since this is a retrospective study, and because the players were selected consecutively, excluding only those who did not meet the inclusion criteria, this can be considered a blind study. In other words, at the time the CPETs were performed, the physicians responsible for administering the procedure did not know that the results obtained would be subsequently used for a study that would evaluate the stability of the relative O2 pulse curve.
Although O2 pulse and, very likely, stroke volume tend to progressively diminish during a 40-min exercise at a workload equivalent to 80% of the anaerobic threshold (2), during the running phase of a progressive incremental treadmill exercise testing the relative O2 pulse tended to increase linearly, starting at a velocity of 8.8 km/h with no incline added. This was shown by the high coefficients of determination obtained in the two evaluations, as well as by ANOVA, and it was especially true for up to 90% of the duration of the CPET running phase. Thus, the maximum mean values and the intercepts of the slopes of the regres-sions showed that maximum baseline and relative O2 pulse behavior during almost all the CPETs were quite stable and similar for the two evaluations. As expected, among healthy young men who remained engaged in training routines for competitive soccer, neither maximum VO 2 nor maximum HR substantially varied over 1 year. Although there is a tendency for a maximum HR reduction with increasing age, a significant decrease was not expected during the short period of our study (18). Additionally, studies have shown that aerobic training does not tend to affect maximum HR (19). With respect to the HR values at submaximal exercise intensities, it was observed that during the first three-tenths
of the running time analyzed (10, 20, and 30%), HR was significantly lower in the reevaluation. These results may be due to non-physiological factors such as lower pre-CPET anxiety resulting from a prior exposure to the same situation, or, more probably, due to a greater mechanical efficiency while running at lower treadmill velocities (greater habitu -ation) (20), reflected by values that were approximately 5 bpm and 4% lower for HR and relative VO2, respectively, at velocities of 9.6 and 12 km/h in the reevaluations. Inter-estingly, although the maximum values of VO2 and HR did not change between the two evaluations, the players were able to run longer and to reach a higher maximum velocity (18.5 ± 0.9 vs 18.9 ± 1.0 km/h) in the reevaluation, most
likely due to an improvement in mechanical efficiency for treadmill running and/or in anaerobic capacity.
In this study, the O2 pulse was normalized to body mass. Thus, because we observed no significant difference be -tween the evaluations for maximum values of VO2 and HR, the maximum O2 pulse value also remained stable despite a minimal increase in the average body mass of the players at reevaluation. In addition, at submaximal intensities (10 to 90% of CPET duration), the relative O2 pulse values did not differ among the percentiles of the running time analyzed in the two evaluations, which was also true for the somewhat lower HR values at the first three intensities analyzed in the reevaluation.
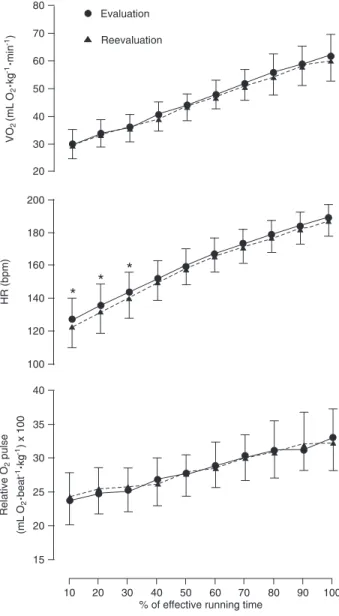
or left ventricular dysfunction and may be considered a physiological limitation of cardiac inotropism or lusitropism. In practice, as can be observed in Figure 1, there were no differences in the last two measures of relative O2 pulse in the reevaluations. This means that the players managed to run a little longer without a substantial increase of VO2 or a variation of HR, suggesting that the physiologic limit was probably reached secondary to stroke volume.
Various factors can influence the stability of a given physiological variable measured at consecutive CPETs, many of which are difficult to control. For example, although all players were instructed to avoid exhaustive exercise in the preceding 24 h and not to ingest large quantities of food in the hours prior to the CPET, it is possible that these instructions were not followed uniformly. Other causes may include the amount of time spent sleeping on the previous day, the player’s emotional status, and the time of day when the CPET was performed. Considering these fac-tors, the scientific literature has reported (16,24-26) that the coefficient of variation of VO2 and HR at two consecu-tive CPETs is approximately 5%, with the possibility of a larger systematic variation at the beginning of exercise. However, even though such variations probably affect the stability of the maximum value and the shape of the rela-tive O2 pulse curve, no studies have directly evaluated the stability between two CPETs, separated by an interval of 1 year with a homogenous sample, as performed in our study. Additionally, studies that evaluated the stability of VO 2 and HR primarily used individuals with heart disease in their samples, which prevents a comparison of their results with the present ones.
O2 pulse has been most commonly reported in the literature in absolute terms (mL O2/beat) (27-30); how-ever, VO2 (and also cardiac output and stroke volume) depends on body dimensions and is directly proportional to the muscle mass involved in the exercise. Additionally, obese individuals have greater submaximal VO2 values at the same exercise intensity than non-obese subjects (3). Based on these arguments, O2 pulse values in the current study, and in others from our research group (11,12,31), were normalized to body mass (mL O2.kg-1.min-1). In ad-dition, because normalizing VO2 to body mass is already a common procedure in clinical practice, we believe that normalizing O2 pulse to body mass is the best way to ex-press this variable.
Even with our effort to minimize the intervening variables as much as possible and thereby increase the external valid-ity of these results, the current study has some limitations: a) because the O2 pulse is a variable that is mainly used in the clinical environment for prognostic stratification (11) and to detect myocardial ischemia (14), we may speculate that the results obtained from healthy young men having good to excellent aerobic fitness may not be applicable to other populations of greater clinical interest. On the other hand, because the subjects most likely did not present changes
in relation to their aerobic training routine during the period of data collection and did not exhibit cardiorespiratory ill-nesses that could affect the maximum value of their relative O2 pulse curve, any changes in these variables represent patterns within normal variation and not pathological altera-tions, which are frequently observed in clinical practice; b) considering the nature of a competitive season in this sports modality, it would not be feasible to precisely control the volume and intensity of aerobic training of these players between the evaluations. However, having excluded those players who had relevant injuries that required prolonged training interruptions, and also considering that all players
Figure 1. Oxygen consumption (VO2), heart rate (HR), and rela
-tive O2 pulse curves expressed as a function of percent duration
Oxygen pulse stability during maximal exercise testing 705
belonged to top professional soccer clubs in Brazil and Angola, it is reasonable to expect that the training charac-teristics remained quite consistent along the competitive season. Supporting this belief, our data showed that the maximum aerobic power of the players was practically identical for both evaluations.
According to the present results, we may conclude that among healthy young men who are regularly active, having good to excellent aerobic fitness, the maximum value and the shape of the relative O2 pulse curve during CPET are stable after an interval of 1 year for up to 90% of the maximum exercise intensity. In addition, an important finding of this study was that the behavior of the relative O2 pulse was less stable and less predictable in the last 2 min of a maximum CPET ramp protocol, and a plateau or even a decline may occur in up to 50% of individuals with the characteristics of our population.
Because our results demonstrate stability of the maximum value of the relative O2 pulse curve under well-controlled conditions, differences of this variable in a
re-evaluation may contribute to a better clinical understanding of disease states and therapeutic interventions (for example, physical training or medications). Future studies should evaluate the stability of these results (the maximum value and the shape of the O2 pulse curve) when other variables change, such as gender, longer time intervals, other proto-cols/ergometers, among individuals of different ages, and in various aerobic and clinical conditions. A potentially even more interesting study would be to evaluate the diagnostic and prognostic implications of possible changes in these variables for a given individual.
Acknowledgments
R.R. Perim and G.R. Signorelli were supported by CNPq graduate scholarships. C.G.S. Araújo is the recipient of research grants/fellowships from CNPq and FAPERJ. C.G.S. Araujo received a lecture honorarium and equipment subsidies from the Micromed and Inbrasport companies in the last 3 years.
References
1. Araújo CG. Teste de exercício: terminologia e algumas con-siderações sobre passado, presente e futuro baseadas em evidências. Rev Bras Med Esporte 2000; 6: 77-84. 2. Araújo CG. Respostas cardiorrespiratórias a um exercício
submáximo prolongado. Arq Bras Cardiol 1983; 41: 37-45.
3. Wasserman K, Hansen JE, Sue DY, Casaburi R, Principles
of exercise testing and interpretation. 3rd edn. Baltimore:
Lippincott Williams & Wilkins; 1999.
4. Goldstein BH, Connor CE, Gooding L, Rocchini AP. Relation
of systemic venous return, pulmonary vascular resistance, and diastolic dysfunction to exercise capacity in patients
with single ventricle receiving Fontan palliation. Am J Cardiol
2010; 105: 1169-1175.
5. Serra SM, Costa RV, Teixeira De Castro RR, Xavier SS, No -brega AC. Cholinergic stimulation improves autonomic and
hemodynamic profile during dynamic exercise in patients with heart failure. J Card Fail 2009; 15: 124-129.
6. Crisafulli A, Piras F, Chiappori P, Vitelli S, Caria MA, Lobina
A, et al. Estimating stroke volume from oxygen pulse during exercise. Physiol Meas 2007; 28: 1201-1212.
7. Sundstedt M, Hedberg P, Jonason T, Ringqvist I, Brodin LA, Henriksen E. Left ventricular volumes during exercise in
endurance athletes assessed by contrast echocardiography. Acta Physiol Scand 2004; 182: 45-51.
8. Whipp BJ, Higgenbotham MB, Cobb FC. Estimating exercise
stroke volume from asymptotic oxygen pulse in humans. J Appl Physiol 1996; 81: 2674-2679.
9. Bhambhani YN. Prediction of stroke volume during upper and lower body exercise in men and women. Arch Phys Med Rehabil 1995; 76: 713-718.
10. Klainman E, Fink G, Lebzelter J, Krelbaumm T, Kramer MR. The relationship between left ventricular function assessed
by multigated radionuclide test and cardiopulmonary
exer-cise test in patients with ischemic heart disease. Chest 2002;
121: 841-845.
11. Oliveira RB, Myers J, Araújo CG, Abella J, Mandic S, Froe-licher V. Maximal exercise oxygen pulse as a predictor of mortality among male veterans referred for exercise testing. Eur J Cardiovasc Prev Rehabil 2009; 16: 358-364. 12. Oliveira RB, Myers J, Araújo CG, Arena R, Mandic S,
Ben-simhon D, et al. Does peak oxygen pulse complement peak
oxygen uptake in risk stratifying patients with heart failure?
Am J Cardiol 2009; 104: 554-558.
13. Pinkstaff S, Peberdy MA, Fabiato A, Finucane S, Arena R. The clinical utility of cardiopulmonary exercise testing in
suspect or confirmed myocardial ischemia. Am J Lifestyle Med 2010; 4: 327-348.
14. Munhoz EC, Hollanda R, Vargas JP, Silveira CW, Lemos AL, Hollanda RM, et al. Flattening of oxygen pulse during
exercise may detect extensive myocardial ischemia. Med Sci Sports Exerc 2007; 39: 1221-1226.
15. Zafrir N, Fink G, Klainman E, Sulkes J, Spitzer S. Relation between aerobic capacity and extent of myocardial ischemia in patients with normal cardiac function. Am Heart J 1999; 138: 1088-1092.
16. Keteyian SJ, Brawner CA, Ehrman JK, Ivanhoe R, Boehmer
JP, Abraham WT. Reproducibility of peak oxygen uptake and other cardiopulmonary exercise parameters: implications for clinical trials and clinical practice. Chest 2010; 138:
950-955.
17. Araújo CG, Castro CL, Franca JF. Prevalência de marca -dor de risco tardio no eletrocardiograma de repouso de futebolistas brasileiros e africanos. Rev SOCERJ 2008; 21: 42-49.
18. Robert A, Landwehr R, Landwehr R. The surprising history of the “HRmax=220-age” equation. J Exerc Physiol 2011; 5: 1-10.
Mathews DK. Frequency and duration of interval training programs and changes in aerobic power. J Appl Physiol
1975; 38: 481-484.
20. Monteiro WD, Araújo CG. Cardiorespiratory and perceptual
responses to walking and running at the same speed. Arq Bras Cardiol 2009; 93: 418-425.
21. Gledhill N, Cox D, Jamnik R. Endurance athletes’ stroke
volume does not plateau: major advantage is diastolic func-tion. Med Sci Sports Exerc 1994; 26: 1116-1121.
22. Zhou B, Conlee RK, Jensen R, Fellingham GW, George JD,
Fisher AG. Stroke volume does not plateau during graded exercise in elite male distance runners. Med Sci Sports Exerc 2001; 33: 1849-1854.
23. Strand PO, Cuddy TE, Saltin B, Stenberg J. Cardiac output
during submaximal and maximal work. J Appl Physiol 1964; 19: 268-274.
24. Corra U, Mezzani A, Bosimini E, Giannuzzi P. Prognostic value of time-related changes of cardiopulmonary exercise testing indices in stable chronic heart failure: a pragmatic and operative scheme. Eur J Cardiovasc Prev Rehabil 2006; 13: 186-192.
25. Meyer K, Westbrook S, Schwaibold M, Hajric R, Peters K, Roskamm H. Short-term reproducibility of cardiopulmonary measurements during exercise testing in patients with se -vere chronic heart failure. Am Heart J 1997; 134: 20-26.
26. Janicki JS, Gupta S, Ferris ST, McElroy PA. Long-term
reproducibility of respiratory gas exchange measurements
during exercise in patients with stable cardiac failure. Chest
1990; 97: 12-17.
27. Campione A, Terzi A, Bobbio M, Rosso GL, Scardovi AB,
Feola M. Oxygen pulse as a predictor of cardiopulmonary events in lung resection. Asian Cardiovasc Thorac Ann
2010; 18: 147-152.
28. Cohen-Solal A, Barnier P, Pessione F, Seknadji P, Logeart D, Laperche T, et al. Comparison of the long-term prognos -tic value of peak exercise oxygen pulse and peak oxygen
uptake in patients with chronic heart failure. Heart 1997; 78:
572-576.
29. Laukkanen JA, Kurl S, Salonen JT, Lakka TA, Rauramaa
R. Peak oxygen pulse during exercise as a predictor for coronary heart disease and all cause death. Heart 2006; 92: 1219-1224.
30. Vassaux C, Torre-Bouscoulet L, Zeineldine S, Cortopassi F, Paz-Diaz H, Celli BR, et al. Effects of hyperinflation on the
oxygen pulse as a marker of cardiac performance in COPD. Eur Respir J 2008; 32: 1275-1282.
31. Perim RR, Signorelli GR, Myers J, Arena R, Araújo CGS. The oxygen pulse slope does not depend on the maximal heart rate in elite soccer players. Clinics 2011; 66: