CONTRIBUTION TO THE STUDY OF MEASURES FOR THE REDUCTION OF
APPARENT WATER LOSS IN URBAN AREAS
1
CRISTINA MENDES SILVA2 VALTER LÚCIO DE PÁDUA3
JORGE MARTINS BORGES4
1 Introduction
In Brazil, regulatory agencies have sought to set performance targets for water utilities in order to reduce waste of natural resources and to achieve better management performance. However, this is still a challenge for most utilities, in which big economic and environmental impacts due to the high rates of water loss can be observed.
Estimates made by GO Associados (2013), based on SNIS (2009) and Rosito (2012), revealed that, considering a period of 17 years (2009 to 2025) and a scenario in which there was a 38% reduction of water losses, gross gains would be R$ 29.93 billion. Assuming the reinvestment of half of that amount of money in the implementation of a water losses reduction programs, the net gain would still be R$14.97 billion, an average of R$880 million a year, representing approximately 12% of all that was invested in the water and sewage sector in Brazil in 2011.
Water losses can be subdivided into real losses, related to water leaks, and appa-rent losses, related to the water that reaches the consumer but is not registered in the accounts. It is observed that, although both types of water losses need to be studied to improve utilities’ performances and foster the rational use of water, apparent losses have generally received less attention in the scientific literature than real losses. However, it should be noted that most of the financial gain would come from reducing the apparent
1. The authors thank the Brazilian funding agencies CNPq and FINEP for the financial support, and SAAE of Itabira for the material and logistic support of the research.
2. Graduated in Civil Engineering by the Federal University of Minas Gerais (UFMG), MBA in Civil Construction Management by the University Center UNA, and Masters in Sanitation, Environment and Water Resources by UFMG. Currently is Engineering Analyst at the Urbanization and Housing Company of Belo Horizonte (Urbel). E-mail: [email protected]
3. Graduated in Civil Engineering by the Federal University of Minas Gerais (UFMG), master’s and doctoral degree in Hydraulic and Sanitation Engineering by the University of São Paulo. Currently is Associate Professor at the Department of Sanitary and Environmental Engineering, UFMG. E-mail: [email protected]
losses by the same amount, instead of the real losses, since the value of the charge to the consumer rate is based on what is effectively registered in accounts.
In this context, the study aimed to quantify and analyze water losses in one sector of a public supply system, evaluating a way to minimize the apparent losses by tackling one of its components: under-registration by water meters. In this regard, the variables analyzed in laboratory-scale and full-scale tests were, respectively, the usage time and the metrological class of the equipment. Furthermore, in order to portray the theme more broadly, the influence of water tanks with float valves installed - commonly used by customers - in under-registration by water meters was incorporated to the literature review, and there was a discussion of the tariff policy, whose structure can affect both the performance of the water utilities and the consumption of users.
2 Literature Review
2.1
Water losses in public supply systems
According to Ueda and Bernoulli (2009), the Tokyo Metropolitan Water Bureau, which is perhaps one of the best utilities in the world, providing a service with 100% co-verage for a population of about 12 million, has about 5.8% of water unbilled. In contrast to that scenario there is Brazil’s reality, for which the “Diagnosis of Water and Sewage Services - 2010” showed an average rate of revenue loss of 35.9% (SNIS, 2012).
According to the technical manual entitled “Performance Indicators for Water Supply Services” published by the International Water Association (IWA), water losses are the difference between the water entering the system and the authorized consumption (ALEGRE et al., 2000), and they are subdivided into:
• Real losses: physical water losses in a pressurized system, up to the point of cus -tomer metering, during the reference period, covering volume loss originating from all kinds of cracks, breakages and overflows.
• Apparent losses: refering to all types of inaccuracies associated to produced water and consumed water measurements, and also to unauthorized consump-tion (illicit use).
Mutikanga et al. (2011) reported that there are no procedures or guidelines esta-blished to assess the apparent losses yet and, in the absence of adequate data, developed countries use default values for calculating apparent losses, which tend to be lower for well--managed systems and are not suitable for developing countries. This assertion, borne out by the discrepancy between the report of the AWWA (2009, apud Richards et al., 2010), which states that the loss of revenue due to apparent water loss can represent from 0.5 to 5% of the total turnover of the service provider, and the result of the study by Mutikanga et al. (2011), in which apparent water loss by under-registration corresponded to 22 ± 2% of billed water, and the apparent total loss was equivalent to 37% of the billed water.
2.2
Tariff policy related to the water supply service
According to Martins et al. (2011), knowledge of the cost structure of public water services is essential to identify the presence or absence of incentives to meet demand efficiently. The authors reported the determination of the Water Framework Directive (WFD), according to which European Union member states must recover all costs rela-ted to water supply through tariffs, and if the inefficiency costs (relarela-ted to water loss, for example) are included, users have to pay more for water service.
In Brazil, according to Federal Law 11.445 / 2007 (BRAZIL, 2007), utilities pro-viding public sanitation services may provide directly or delegate these services and, in the latter case, they must define an entity responsible for regulation and supervision. As stated in Article 12 of that law, it is up to that regulatory body to set “the payment mechanisms of differences relating to bad debt of users, commercial and physical losses and other credits due, if applicable”.
With regard to the imposition of tariffs, public prices and fees for basic sanitation services, it is important to mention that Federal Law 11.445 / 2007 (BRAZIL, 2007) provides, among other guidelines, for the inhibition of superfluous consumption and waste of resources. Moreover, it contemplates the adoption of subsidies to increase poor citizens and low-income localities’ access to these services.
At the state level, there is State Law 18.309 / 2009 (ALMG, 2009) which created, among others, the Agência Reguladora de Serviços de Abastecimento de Água e Esgo-tamento Sanitário de Minas Gerais (ARSAE-MG) in order to simulate a competitive environment and, thus, stimulate the efficiency of service delivery and the sharing of productivity gains with users in the existing natural monopoly environment, where high fixed costs made it impossible for more than one provider to exist in the same region.
At the municipal level, there is a case cited of tariff restructuring in the city of Itabira in which the practical part of the present research was developed. This town is located in the state of Minas Gerais and is served by an Autonomous Water and Sewa-ge Service (SAAE); a local authority established by Law No. 151 dated May 20, 1955 (ARSAE-MG, 2010).
15, 2012, the minimum billing, which corresponded to 15 m3 for the residential category, was replaced by a tariff with two components: tariff of availability (fixed) and tariff for real volume (variable). Furthermore, a social tariff has been established. With respect to this tariff restructuring, ARSAE-MG elucidated:
With the new tariffs, billing calculation with two rate components - availability and real consumption - and the end of the minimum consumption, users with low water consumption and low income, about half of the families, will be benefited from the reduction of their bills. The largest consuming users will have increases in their bills, but receive incentives to save water. (ARSAE-MG, 2012, p.2)
Indeed, the elimination of minimum consumption billing ends cases of clients who in spite of consuming a very low volume of water monthly were forced to pay for the stipulated 15m³. In contrast, those residential customers whose water consumption went beyond 10 m³ monthly had the value of the bill increased in 2012, after the tariff restructuring. It should be noted that the change in the form of billing had no effect on total revenue of Itabira’s SAAE, because it was, by nature, a cross-subsidy system in which users with more capacity to pay defray the costs of needy users.
It should also be noted that the revenue from a minimum consumption scheme masks the revenue loss rate, reducing it, because in this situation the provider receives payment from the customer for a volume that was not actually consumed. That assertion endorsed by the work of Almeida et al. (2007), which analyzed the effect of reducing the minimum volume being charged for on the magnitude of revenue loss in the city of Belo Horizonte. That tariff change had been implemented by COPASA in March 2006, and the minimum monthly volume charged for was reduced from 10 to 6 m³ to economize. The authors found that, after implementation of the new minimum volume, there was an increase of revenue loss in all regional districts of Belo Horizonte, ranging from 12 to 30%. The SAAE of Itabira can expect a similar effect from the tariff restructuring and its respective consequences for that portion of small consumers formerly benefitted by the minimum billing.
Regarding the waste of resources, ARSAE-MG (2012) found, among other issues, that the SAAE of Itabira has high technical losses, meaning that part of the costs related to water pumping and chemical products for the treatment could stop being spent. Thus, in the tariff review, in the items of electricity costs and treatment materials, a Reducer of Losses (Rp) has been applied, and these costs were not fully accepted. It was also em-phasized that, regarding non-technical losses (defined by ARSAE-MG as losses related to micro measurement less than the volume consumed by users), although its reduction does not generate cost savings, it makes reduction of tariffs possible by expanding the billed volume. Finally, the agency warned that the provider must «adopt strict measures to control losses (technical and non-technical) in order to avoid incurring higher costs than those it allows for».
them to consume less, which means it is contributing to inhibition of superfluous con-sumption, as set out by Federal Law 11.445 / 2007; and (ii) not fully incorporating the costs of the provider’s inefficiency in the customers’ tariff (unlike the recommendation imposed by the European Water Framework Directive), but providing progressive targets for improving services. It is also leading to reduction in waste of resources’ reduction and better services for the customer, thereby offering the possibility of expanding the service, if necessary, without the need to increase the water tariff and / or increase the flow of the production system.
2.3
Factors involved in apparent water loss by under-registration
Apparent water loss, as already mentioned, is related to unauthorized consumption and to measurement failures, which can occur due to many factors like errors in meter re-ading, fraud in water meters, bypass, illegal connections to the network, under-registration by water meters and errors in data handling.
Among the several factors that influence apparent water loss by under-registration, due to the importance attributed to some of them by the literature, and their relation to the subject of this research, three have been chosen to be examined in detail, namely: metrological class, time of use of water meters and the use of water tanks with float valves.
2.3.1
Metrological class of water meters
According to Inmetro (2000), the flow rates used for the characterization of water meters are defined as follows:
• Maximum flow rate (Qmax): highest flow, expressed in m³/h, in which the water meter is required to operate for a short period of time, within its maximum per-missible error range, maintaining its metrological performance when employed later in the usual conditions of use;
• Nominal flow rate (Qn): higher flow in conditions of utilization, expressed in m³/h, in which the meter is required to operate in a satisfactory way within the maximum permissible error range;
• Transitional flow (Qt): flow rate in uniform flow, which defines the separation between the lower and upper measuring ranges;
• Minimum flow rate (Qmin): lower flow rate in which the water meter provides indications that do not have errors greater than the maximum permitted; • Start of the movement: flow rate at which the water meter starts giving indication
of volume, without submission to maximum permissible errors.
can be different from the volume that actually crossed the equipment, extrapolating the measurement errors permitted for other flow rates.
The minimum and transitional water meter flow rates vary according to the metro-logical class and nominal flow thereof. Considering meters for cold water with nominal flow up to 15 m³/h, like the class C meters, for which the minimum flow rate is 1% of the nominal flow, they are more sensitive at low flows than Class B meters, for which the minimum flow rate is equal to 2% of the nominal flow. Therefore, it follows that a high percentage of apparent water loss through under-registration by a water meter in a specific connection may indicate inadequacy of the metrological class of the installed equipment for the customer’s consumption profile. Coelho (2009) highlighted the need to encourage research in order to determine the typical consumption characteristics of each region and, based on that, make a proper dimensioning, so that the measuring ranges of water meters coincide as much as possible with their workflows.
The study observed that failing to consider the data related to customer’s consumption profile and opting for a water meter capable of registering very high flow rates as a “secu-rity measure”, may mean neglecting small flows and facilitating the occurrence of under--registration. At the same time, if the local flow exceeds the maximum flow the meter can measure, the equipment may suffer internal rupture or severe wear, impairing measurement accuracy (ARREGUI, et al, 2005, apud MALHEIRO, 2011; GONÇALVES and ITONAGA, 2007; PNCDA, 2003a). It must also be taken into account that, as corroborated by PNCDA (2003a), the choice, for example, of a metrological Class C water meter, more sensitive to low flow rates, makes the installation more expensive. Therefore, it must verified whether the volumes measured at lower flow rates are sufficient to make that a profitable option; a situation which obviously varies according to the customers’ consumption profiles.
In that respect, Miranda (2005) recommended the development of studies to determine the under-registration of water meters at the minimum flow rate in several typical situations, and Depexe and Gasparini (2012) suggested the investigation of the viability of replacing metrological Class B water meters with class C water meters, mainly for connections with higher average consumption.
Borges (2007) compared the micro measurement between these two classes of water meters, in a study conducted in 25 houses in Uberlândia. The author found that, on average, the Class C equipment recorded a volume 13.56% higher than that measured by Class B equipment. A result close to that was found in an experiment conducted under the technical supervision of the Liceu de Artes e Ofício de São Paulo, where the wet type Class C water meter measured 12% more volume than the dry Class B type (PNCDA, 2003b). In this study, it was concluded that the price difference between Class C and Class B water meters would be paid off in about five months.
2.3.2
Time of use of water meters
average reduction in the micro measured volume of approximately 1.0% per year was observed. The authors mentioned that Arregui et al. (2010) consider that the efficiency reduction rates are between 0.1% and 0.9%, a range of values lower, but very close to that obtained by them.
In a similar vein, Criminisi et al. (2009) developed a study involving 180 water meters that had between 0 and 45 years of use. In their experiment, they found that wa-ter mewa-ters with less than 5 years use under-regiswa-tered volumes by 2.6%, while for those with between 40 and 45 years of use, under-registration was found to be 83.6%. Another relevant point in this research was that for tests with a flow of 120 L/h, the newest water meters (under 20 years of use) presented positive errors, that is, they registered a higher volume than had actually flowed.
It is worth noting that the reduction in the accuracy of the equipments over time is to some extent allowed for by INMETRO Ordinance nº. 246 (2000), since it defines, in the tests to determine the indication errors, maximum permissible error values for testing meters not yet marketed stricter than those for regular and eventual inspections of water meters in use.
Moreover, the need for water utilities to evaluate losses caused by under-registration in real conditions was emphasized by Coelho (2009), who highlighted the fact that nowa-days there is little information about the performance over time of installed water meters or about the various factors that affect the accuracy of such equipment.
2.3.3
Use of water tanks with float valves
Measurement errors of water meters are amplified in places where consumers use water tanks (Criminisi et al, 2009). According to Miranda (2005), that is why under--registration of the minimum flow rate is very expressive in Brazil. This is because, even if the customer uses water at a flow rate higher than the minimum flow rate of the water meter, if there is a water tank with a float valve installed between the point of consumption and the water meter, the flow will be amortized. Thus, this flow may become lower than the flow of the start of movement for which the meter is unable to record the volume, or it may fall in the range between the minimum flow and the start of movement flow, for which standard limits for measurement error have not been established and, thus, there can be significant errors. That is to say, in these cases under-registration can occur and consequently an increase of apparent water losses.
In the work of Mutikanga et al. (2011)’ addressing data of 90 consumers, 25% of under-registration was detected in the water meters of homes that had water tanks and 7% in those receiving direct supply. According to the authors, most domestic water me-ters (> 5 years) were unable to register flows below 100 L/h. In contrast, the proportion of the volume of water that passed through the water meter in lower flows than 100 L/h was about 40% for houses that had a water tank (82% of consumers) and less than 3% for homes with direct supply (18% of consumers).
difference between them in several supply situations. The results of this study showed a loss of 49% in residences whose supply was constant and 8% in the houses that were supplied intermittently, with a service period of about 16 h/day. In two other homes that were only supplied at night, according to the authors, the apparent losses due to the use of float valves were negligible. Criminisi et al. (2009) concluded their analysis by pointing out that when the tank is almost full, measurement errors are amplified due to the low inflows. They also made it clear that if the tank is filled and emptied periodically, measu-rement errors can be reduced because the refueling generally requires much higher flows than those typical of household water use.
Although the use of water tanks with float valves raises apparent water losses in the system, according to Miranda and Koide (2003), this fact alone is not enough for proposing the non-use of domestic water tanks in Brazil. The same authors mention that besides the existence of large amounts of intermittent systems in the country, there are also implications of an economic and financial order related to the distribution network, since the use of water tanks prevents the adoption of a reinforcement coefficient in dimensio-ning the pipes, resulting in reduced diameters. Thus, Hovany (2012) and Criminisi et al. (2009) suggested, as a way of minimizing the problem of under-registration, the adoption of impulse valves instead of conventional float valves. Although promising, according to Pereira and Ilha (2008), the main obstacle to the use of high flow float valves is the fact they depend on the final consumer for their proper installation.
Having exposed the magnitude of water losses and intervening factors, especially with regard to the portion of apparent losses, this study aimed to analyze specifically, among the variables considered, the influence of the two most amenable to intervention by the water utility, namely: metrological class and time of use of water meters.
3 Objectives
• To evaluate the effect of replacing used metrological Class B water meters with new metrological Class C water meters in a supply sector in Itabira-MG; • To verify the economic feasibility of replacing metrological Class B water meters
with metrological Class C water meters; and
• To analyze the influence of time of use on the accuracy of metrological Class B water meters.
4 Material and Methods
The methodology contemplated three stages, each of which aimed to achieve one of the above objectives, as described below.
4.1
Stage 1
The condominium had 83 active water connections provided with water meters in regular operation. Among these connections, 73 were from residential buildings, 5 from commercial buildings and the other 5 were under the condominium’s responsibility and corresponded to consumption such as that related to the guardhouse and to the irrigation of common green areas. The condominium meters were metrological class B flow velocity, dry-type, with magnetic transmission. Except for one single-jet meter with Qn equal to 0.75 m³/h, the rest were multijet and had a Qn of 1.5 m³/h.
As the volume of condominium water flowing to the outlets was being registered by the water meters, the first step of this research consisted of installing an electromagnetic macrometer to register the volume of water flowing into the condominium. After that, the daily readings started, Monday through Friday, both from macrometer and from the 83 water meters of the condominium.
At the end of 25 days of reading, new water metrological class C meters, more sensitive to low flows, replaced all the water meters of the condominium. However, the other characteristics of installation were kept unchanged. These Class C water meters were monitored in order to totalize another 25 days of readings. The total water loss was calculated, for each two sequential days of readings, as being the difference between the macro-measured volume and the sum of the volumes registered by the individual water meters.
In order to better base the interpretation of the results of the percentage of the condominium’s total water losses, a questionnaire was administered to the joint owners, in which they were questioned about the type of water supply of their homes, to be defined as direct, indirect or mixed.
To verify whether the replacement of used Class B water meters with new Class C water meters significantly alters the values of water losses obtained in the condominium, the Student T test to a 1% significance level was performed using Statistica software and the following hypotheses were postulated:
• H0: water losses with micro measurement performed by metrological Class B and C water meters are equal;
• Ha: water losses are different.
4.2
Stage 2
The economic feasibility of replacing Class B water meters with Class C ones was evaluated using the discounted payback method, which is one of the methods presented by Lapponi (2006) for evaluation of investment projects. This method consists of calculating the time required to recover the money invested and paid at the required rate k (DPB) and its comparison with the maximum tolerated time (MTT), as follows:
Using information supplied by Itabira’s SAAE, invested capital was computed as a total of R$ 4.980,00 representing the difference between the acquisition cost of the Class C water meters and that of Class B ones. MTT was taken to be 5 years, corresponding to the maximum acceptable time determined by Inmetro (2000) to check the water meters and to the useful life time of such equipment as indicated by the Water Utilities Performance-Based Contracting Manual in Brazil (GO ASSOCIADOS, 2013). The tariff used was the one that best fitted the average profile of the condominium’s consumption, which is R $ 3.419 / m³ as readjusted by the SAAE in 2013. Finally, the Selic interest rate of 0.81% corresponding to the month of October 2013 was adopted, according to the recommendation of the financial sector of the SAAE.
4.3
Stage 3
The 83 Class B water meters had been installed in the condominium between 2001 and 2013. Thus, when they were removed for replacement in 2013, they had different times of use. In order to evaluate the interference of this variable on the accuracy of the equipment, tests on a laboratory scale were performed on 12 of the 83 water meters. The selected equipments were sent to a laboratory accredited by Inmetro, where they were submitted to the Determination of Errors – Errors’ curve test as established by Ordinance n0.246 INMETRO (2000).
With those results, for each of the tested flow rates, a check was made for any correlation between the time of use and the water meters errors of indication by means of the Spearman R test using Statistica software and at a 5% significance level. For that, the following assumptions were made:
• H0: there is no correlation between the time of use and the error of indication of the water meters (rs = 0);
• Ha: there is a correlation
5 Results
5.1
Stage 1
The questionnaire regarding the type of supply of the 83 water connections of the condominium was answered by 77.1% of the joint owners. The results showed a percentage of 72.3% of the mixed supply type, no indirect supply and 4.8% of direct supply, this last value corresponding to four of the five connections that were under the condominium’s responsibility.
consumption at lower flow rates associated to private water tanks that, together with the continuous supply, favors under-registration by water meters.
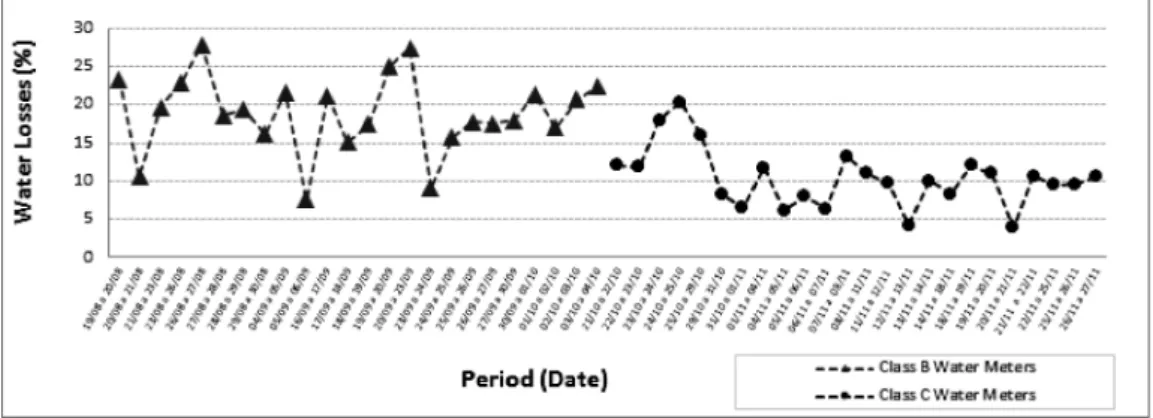
Regarding the condominium’s total water losses, the percentages measured by metrological Class B and Class C meters throughout the monitoring period are shown in FIG. 1.
FIGURE 1: Condominium water losses before and after the replacement of the me-trological Class B water meters with Class C ones
Source: authors’ elaboration, 2014
Average condominium water losses were 18.9% and 10.4% when micro measure-ment was done with metrological classes B and C meters respectively. That is, in this case study, the act of replacing these equipments resulted in a 45% reduction of water losses (reduction of under-registration, one of the components of water losses).
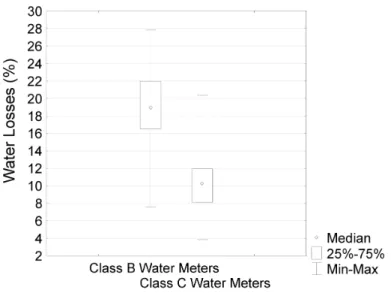
In FIG. 2, in which shows the median and the minimum, maximum and the first and third quartiles of those water losses, it can be seen that over 75% of water loss data of Class C water meters are lower than the value of the first quartile of the data for Class B meters, showing the reduction of losses after the replacement of the equipment.
After verifying the normality of data by applying the Shapiro-Wilk W test, it was proved by the application of the Student’s T-test, at a 1% significance level, that the replacement of used Class B water meters by the new Class C ones significantly reduced loss of water in the condominium; so the hypothesis of equality H0 was rejected.
5.2
Stage 2
The time required to recover the capital invested and interest (DPB) was 5.6 months; lower than the maximum tolerated time (TMT) of 5 years, indicating that, in this case study, the investment project proved to be economically viable.
5.3
Stage 3
Class B water meters removed from the condominium had different times of use (x), as shown in the histograms of simple, absolute and relative accumulated frequencies of FIG. 3.
FIGURE 3: Distribution of values of time of use of the 83 Class B water meters in the studied water supply sector.
Source: authors’ elaboration, 2014
FIGURE 2: Box and whisker plot of water losses in the condominium with micro measurements made by metrological classes B and C water meters.
Source: authors’ elaboration, 2014
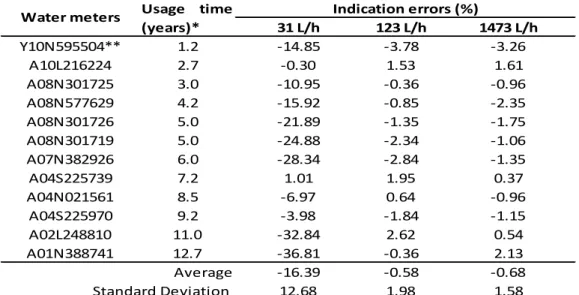
From each time of use interval shown in FIG. 3, a water meter was selected beginning with one year of use, except in the 5 ≤x<6 interval, for which two meters were selected, and the 10 ≤x<11 interval, that had no meter selected. 12 water meters altogether were subjected to the test of determining the error curve, and the results are listed in Table 1.
TABLE 1: Indication errors of the 12 Class B water meters selected from among the condominium’s 83
Source: authors’ elaboration, 2014
In all 12 tested water meters, indication errors found in flow rates of 123 and 1473 L/h, corresponding to the Qt and Qn rates, respectively, were lower than the percentage of ± 5%, set by INMETRO (2000) as the maximum error permissible for approval of water meters. However, for the flow of 31 L/h, referring to the Qmin range, among the 12 tested water meters, 8 failed the test because they had errors of indication greater than the maximum permissible error of ± 10% established for that flow rate.
It is worthy of note that among the 36 results, 9 errors of indication were positive, that is, water meters measured a higher volume than what actually went through them, in which case the consumers suffer because it leads them to pay for a volume of water not consumed.
Regarding the time of use, the results were more discrepant. For example, the water meter with 9.2 years of use that passed the tests with a -3.98% error of indication in the flow of 31L/h and the water meter with three years of use, for the same flow, which failed with a -10.95% error of indication. To verify the existence of correlation between the time of use and the error of indication of the water meters, Spearman R tests were
per-31 L/h 123 L/h 1473 L/h
Y10N595504** 1.2 -14.85 -3.78 -3.26
A10L216224 2.7 -0.30 1.53 1.61
A08N301725 3.0 -10.95 -0.36 -0.96
A08N577629 4.2 -15.92 -0.85 -2.35
A08N301726 5.0 -21.89 -1.35 -1.75
A08N301719 5.0 -24.88 -2.34 -1.06
A07N382926 6.0 -28.34 -2.84 -1.35
A04S225739 7.2 1.01 1.95 0.37
A04N021561 8.5 -6.97 0.64 -0.96
A04S225970 9.2 -3.98 -1.84 -1.15
A02L248810 11.0 -32.84 2.62 0.54
A01N388741 12.7 -36.81 -0.36 2.13
-16.39 -0.58 -0.68
12.68 1.98 1.58
Average Standard Deviation
*Due to different dates of installation there are water meters with the same year of manufacture that have different usage times.
**While the other meters have a Qn of 1.5 m3/ h, the meter with 1 year of use has a Qn of 0.75 m3 / h, and the flow rates used for testing it were different from those listed above, namely: 15, 62 and 740 L / h.
Water meters Usage time (years)*
formed at a significance level of 5% with the results of tests in a laboratory scale in each of the three tested flow rates. According to the tests, there is no evidence of correlation between the error of indication and the time of use of the water meters for any of the three flow rates. The null hypothesis H0 was not rejected however. It is noted that there may well be correlation but the small number of the sample did not make it possible to detect such an association. Moreover, as the tested water meters were not all from the same manufacturer, this may have led to implications in the sense that there may be equipment with varying quality.
6 Discussion
According to ARSAE-MG (2012), the total loss of water from Itabira’s SAAE (cal-culated by the relation between the volume of produced water and the micro measured volume) in 2010 was 38.3%. In addition, in the condominium studied, average water losses of 18.9% were detected when the micro measurement was being carried out for the class B meters, and 10.4% for micro measurement with Class C meters.
It is assumed that the lower percentage of water losses in the condominium is due to the fact that in the system between the installed macrometer and the 83 water meters there are, probably, no losses related to fraud in water meters or illegal connections, and if there have been losses related to error readings and to leaks, these had a smaller magnitude than that might possibly occur between the water treatment station and the houses of Itabira.
The new Class C water meter registered 8.5% more of the consumed volume than the Class B meters in use; an amount lower than the 12% recorded in the study of SE-MASA (PNCDA, 2003b) and than the 13.56% mentioned by Borges (2007). Even so, the economic feasibility of replacing water meters was clearly demonstrated.
The difference between the percentages recorded the most by the water meter Class C meters in this study and the percentages obtained in the other two referenced researches may be due to several factors, such as differences in water quality (possible deposit of particles contained in the water in the submerged gears of wet–type meters, for example), consumption profiles, types and time of use of water meters.
Finally, it is believed that most of the 10.4% of loss of the water that still occurred in the condominium after replacing the water meters, was either because of the type of water supply to homes, which, according to the questionnaire applied, is predominantly mixed, and that is in addition to outlet point (s) with direct supply, and also, the resi-dences have private water tanks with float valves installed. Studies cited above, like that of Mutikanga et al. (2011) in which the under-registration by water meters installed in homes with a private water tank was 25% whereas in the water meters with direct supply, it was only 7%, corroborate this hypothesis. Another point to be emphasized is that in the study condominium the water supply is constant, which increases the under-registration caused by the use of float valves, as discussed in the study by Criminisi et al. (2009).
7 Conclusion
From this case study, it is possible to arrive at the following conclusions:
• The average water losses measured in the condominium, 18.9% and 10.4%, were lower than the 38.3% of the city of Itabira.
• The new Class C water meters were more accurate than the B class meters in use, as it was proven that the replacement of Class B equipments with Class C ones reduced the condominium water losses significantly, at a significance level of 1%. • The action of replacing the water meters effectively reduced the apparent losses
of the condominium, because it resulted in a relative reduction of 45% of the total losses of the water on site, which dropped from 18.9% to 10.4%.
• The project of replacement of water meters turned out to be economically feasible given that the period of 5.6 months required to recoup the investment was lower than the maximum tolerated time.
• Based on the analyzed data, it was not possible to detect evidence of correla -tion between the error of indica-tion and the water meter time of use, at a 5% significance level.
8 References
ALEGRE, H; HIRNER, W; BAPTISTA, J. M; PARENA, R. Indicadores de desempenho para serviços de abastecimento de água. Tradução de Patrícia Duarte, Helena Alegre e Jaime Melo Baptista. International Water Association, London, 2000. Título original: Performance indicators for water supply services.
ALMEIDA, F. S.; DIAS, D. M.; FRANCA, J. E. M.; LIBÂNIO, M. Avaliação do impacto da redução do volume mínimo tarifado mensal no sistema de abastecimento de água de Belo Horizonte. In: CONGRESSO BRASILEIRO DE ENGENHARIA SANITÁRIA E AMBIENTAL, 24., 2007, Belo Horizonte. Anais... Belo Horizonte, Brasil: ABES, 2007.
ALMG - ASSEMBLEIA LEGISLATIVA DO ESTADO DE MINAS GERAIS. Legislação Mineira - LEI 18309, de 03/08/2009 - Assembleia de Minas. Disponível em: <http://www. almg.gov.br/consulte/legislacao/completa/completa.html?tipo=LEI&num=18309&com p=&ano=2009>. Acesso em: 26 abr. 2013.
ARSAE-MG - AGÊNCIA REGULADORA DOS SERVIÇOS DE ÁGUA E DE ES-GOTAMENTO SANITÁRIO DO ESTADO DE MINAS GERAIS. NOTA TÉCNICA 04/2012: Detalhamento do Cálculo da Revisão Tarifária do Serviço Autônomo de Água e Esgoto de Itabira - SAAE de Itabira. Resultado Final da Audiência Pública. Coordenadoria Técnica de Regulação e Fiscalização Econômico-Financeira. 2012. Disponível em: < http://www. arsae.mg.gov.br/images/documentos/nota_tecnica_04_2012_revisao_tarifaria_saae_itabi-ra.pdf>. Acesso em: 17 mar. 2013
ARSAE-MG - AGÊNCIA REGULADORA DOS SERVIÇOS DE ÁGUA E DE ESGO-TAMENTO SANITÁRIO DO ESTADO DE MINAS GERAIS. SAAE-Itabira encontra-se com Diretoria da ARSAE-MG em BH. 2010. Disponível em: <http://www.arsae.mg.gov. br/noticias/83-saaeitabira18052010>. Acesso em: 26 abr. 2013.
ARREGUI, F; CABRERA, E; COBACHO, R; GARCÍA, J. Key factors affecting water meter accuracy. LEAKAGE, Halifax, Canada, 2005.
ARREGUI, F.; COBACHO, R.; SORIANO, J.; GARCÍA-SERRA, J. Calculating the optimum level of apparent losses due to water meter inaccuracies. In:WATER LOSS 2010, Specialist Conference. Proceedings... São Paulo, SP, 2010. 8p.
AWWA. Manual of water supply practices M36 (3rd ed). Water audits and loss control programs. Denver: AWWA, 2009.
BORGES, E. J. B. Análise da micromedição do volume de água potável domiciliar e sua influ-ência no cálculo das perdas no sistema de distribuição. 2007. 88 f. Dissertação (Mestrado em Engenharia Civil) - Universidade Federal de Uberlândia, Uberlândia, 2007.
COELHO, A. C. Micromedição em sistemas de abastecimento de água. João Pessoa: Editora Universitária da UFPB, 2009. 348 p.
CRIMINISI, A.; FONTANAZZA, C. M.; FRENI, G.; LA LOGGIA, G. Evaluation of the apparent losses caused by water meter under-registration in intermittent water supply. Water Science & Technology - WST, 60.9, 2009.
DEPEXE, M. D.; GASPARINI, R. R. Determinação de taxas anuais de redução da efi-ciência da medição de hidrômetros.Saneas, v. 45, n. XII, 2012.
FANNER, P.; STURM, R.; THORNTON, J.; LIEMBERGER, R. Leakage management technologies. Awwa Research Foundation. Denver, USA/London, UK: AWWA/IWA ,2007.
GONÇALVES, E.; ITONAGA, L. C. H. Curso de perdas de distribuição de água: nível 3. Brasília: RECESA, 2007. 238 p.
GO ASSOCIADOS. Water utilities performance-based contracting manual in Brazil - WAUPBN. International Finance Corporation and World Bank Group: 2013.
HOVANY, L. Error in water meter measuring due to shorter flow and consumption shorter than the time the meter was calibrated. [S.I]: Intech, 2012. DOI: 10.5772/51046.
INMETRO - INSTITUTO NACIONAL DE METROLOGIA, QUALIDADE E TEC -NOLOGIA. Regulamento técnico metrológico a que se refere a portaria INMETRO No. 246
de 17 de outubro de 2000. 2000.
LAPPONI, J. C. Matemática financeira. Rio de Janeiro: Elsevier, 2006.
LAMBERT, A. O.; BROWN, T. G.; TAKIZAWA, M.; WEIMER, D.(1999) A review of performance indicators for real losses from water supply systems. Aquat. J. Water Serv. Res. Technol.,48 (6), 227–237. 1999.
MALHEIRO, R. M. G. Controlo de perdas aparentes em sistemas de abastecimento de água com utilização de telecontagem. 2011. 120 f. Dissertação (mestrado em engenharia civil) - Universidade do Porto, Porto, Portugal. 2011.
MARTINS, R.; COELHO, F.; FORTUNATO, A. Water losses and hydrographical regions influence on the cost structure of the Portuguese water industry. Journal of Productivity Analysis, v. 38, p. 81-94. 2011.
MCKENZIE, R; SEAGO, C. Assessment of real losses in potable water distribution sys-tems: some recent developments. Water Sci. Technol. Water Supply, 5 (1), 33–40. 2005.
MIRANDA, E. C.; KOIDE, S. Indicadores de perdas de água: O que, de fato, eles in-dicam? In: XXII CONGRESSO BRASILEIRO DE ENGENHARIA SANITÁRIA E AMBIENTAL, 22.; 2003, Joinville. Anais... Joinville, Brasil: ABES, 2003.
MUTIKANGA, H. E.; SHARMA, S. K.; VAIRAVAMOORTHY, K. Assessment of apparent losses in urban water systems. Water and Environment Journal, v. 25, n. 3, p. 327–335, 2011.
PEREIRA, L. G.; ILHA, M. S. O. Avaliação da submedição de água em edificações resi-denciais unifamiliares: o caso das unidades de interesse social localizadas em Campinas, no estado de São Paulo. Ambiente Construído, v. 8, n. 2, p. 7-21, 2008.
PNCDA - PROGRAMA NACIONAL DE COMBATE AO DESPERDÍCIO DE ÁGUA. DTA - Documento Técnico de Apoio no D3: micromedição. Brasília: MCIDADES.SNSA,
2003a.
PNCDA - PROGRAMA NACIONAL DE COMBATE AO DESPERDÍCIO DE ÁGUA. DTA - Documento Técnico de Apoio no C2: Panorama dos sistemas públicos de abastecimento
no país. Casos selecionados de estratégias de combate ao desperdício. Brasília: MCIDA-DES.SNSA, 2003b.
RICHARDS, G. L; JOHNSON, M. C; BARFUSS, S. L. Apparent losses caused by water meter inaccuracies at ultralow flows.JournalAmerican Water Works Association, Denver, p. 123-133, maio. 2010.
ROSITO, C. Política nacional de saneamento: do Planasa ao Plansab. In: GRUPO DE ECONOMIA DO SANEAMENTO, ENERGIA & SOLUÇÕES AMBIENTAIS, 2012, São Paulo. Anais... [S.I.: s.n], [2012?].
SNIS - SISTEMA NACIONAL DE INFORMAÇÕES SOBRE SANEAMENTO. Visão geral da prestação dos serviços de água e esgotos - 2004. Brasília: MCIDADES.SNSA, 2005.
SNIS - SISTEMA NACIONAL DE INFORMAÇÕES SOBRE SANEAMENTO. [Visão da prestação dos serviços de água e esgotos]. Brasília: MCIDADES.SNSA, 2009.
SNIS - SISTEMA NACIONAL DE INFORMAÇÕES SOBRE SANEAMENTO. Diag-nóstico dos serviços de água e esgotos - 2010. Brasília: MCIDADES.SNSA, 2012.
UEDA, S.; BENOUAHI, M. Accountable water and sanitation governance: Japan’s ex-perience. In: JAGANNATH, N. V; MOHAMED, A. S; KREMER, A. Water in the Arab World: Management Perspectives and Innovations.The International Bank of Recons-truction and Development/The World Bank, 2009.
Submitted on: 09/02/2015 Accepted on: 10/08/2015
Abstract: In Brazil, the average revenue losses of water utilities is around 36%. This value, resulting from high water losses, warns of the need for improvement in the efficiency of service providers, especially as regards the share of apparent losses which can represent more than 50% of total water losses. Focusing on this point, in this study was evaluated the influence of metrological class and the usage time of meters on under-registration, through study on pilot scale and tests in a laboratory scale. Thus, was proven significant reduction of apparent water losses due to the replacement of class B meters by the class C meters, and the economic viability of this investment. Furthermore, discoursed out about the interference of the use of water tanks and about the influence of tariff policy on the financial performance of the utilities and consumption of users.
Key-words: Apparent water losses; Meters; Water tanks; Tariff policy.
Resumo: No Brasil, o valor médio do índice de perdas de faturamento das concessionárias de água é de aproximadamente 36%. Tal valor, resultante das elevadas perdas de água, alerta sobre a necessidade de melhoria na eficiência das prestadoras de serviço, principalmente no tocante à parcela das perdas aparentes que pode representar mais de 50% das perdas totais. Focando neste aspecto, na presente pesquisa avaliou-se a influência da classe metrológica e do tempo de uso dos hidrômetros na submedição, por meio do estudo em escala piloto e testes de bancada. Assim, comprovou-se redução significativa das perdas aparentes de água devido à substituição de hidrômetros classe B por hidrômetros classe C, e a viabili-dade econômica desse investimento. Ademais, discorreu-se sobre a interferência do uso de caixas d’água e acerca da influência da política tarifária no desempenho financeiro das concessionárias e consumo dos usuários.
Palavras-chave: Perdas aparentes de água; Hidrômetros; Caixas d’água; Política tarifária.
Resumen: En Brasil, el promedio de las pérdidas de facturación de las empresas opera-doras de los servicios de agua es de aproximadamente 36%. Este valor advierte acerca de
CONTRIBUTION TO THE STUDY OF MEASURES FOR THE REDUCTION OF
APPARENT WATER LOSS IN URBAN AREAS
CRISTINA MENDES SILVA VALTER LÚCIO DE PÁDUA
las pérdidas aparentes, que pueden representar más de 50% del total. Tomando en cuenta dicho aspecto, en este estudio se evaluó la influencia de la clase metrológica y del tiempo de servicio de los hidrómetros en la sub medición, por medio de estudio a escala piloto y de banco. Los resultados mostraron reducción significativa de las pérdidas aparentes debido a la sustitución de hidrómetros clase B por los C, y su viabilidad económica. Además, se pronunció acerca de la interferencia del uso de reservorios y sobre la influencia de la política arancelaria en los resultados financieros de las operadoras y en el consumo de los usuarios.