vol. 40, n. 3, jul./set., 2004
Enantiomeric separation and quantitative determination of propranolol
enantiomers in pharmaceutical preparations by chiral liquid
chromatography
Anil K. Singh, Erika R. M. Kedor-Hackmann , Maria Inês R. M. Santoro*
Departamento de Farmácia, Faculdade de Ciências Farmacêuticas, Universidade de São Paulo
This paper describes validated direct liquid chromatographic chiral methods for enantiomeric separation and quantitative determination of clinically significant β-blocking agent, propranolol. A liquid chromatographic method was validated and applied for enantiomeric determination of propranolol enantiomers in pharmaceutical formulations. Separation were obtained in polar organic mode on a α-Burke 2® chiral stationary phase (250 x 4.6
mm, 5µm) with mobile phase composed of dichloro-methane:methanol (90:10 v/v), along with 12 mM of ammonium acetate, at a flow rate of 0.9 mL/min. Detection was made by ultraviolet absorption at 280 nm. In all cases the run time was less than 10 min. The correlation coefficient for linear regression curves of R-propranolol and S-propranolol were 0.9995 and 0.9998 respectively. The intra-day precision, expressed as RSD was less than 2%. The accuracy determined by average recovery of R-propranolol and S-propranolol from sample matrices were 97.3% and 100.1% in commercial sample and 99.5% and 100.4% in simulated samples, respectively. Excellent levels of limit of detection (mean value = 1.34 ng) and limit of quantitation (mean value = 4.47 ng), along with rapid elution time of both enantiomers, makes the method useful for routine enantiomeric quality control applications.
*Correspondence: M. I. R. M. Santoro Departamento de Farmácia Faculdade de Ciências Farmacêuticas – USP
05508-900 - Av. Prof. Lineu Prestes, 580, Bloco – 13
São Paulo - SP - Brasil E-mail: [email protected]
Uniterms:
• Enantiomeric separation • Liquid chromatography • Method validation • Propranolol • Tablets
INTRODUCTION
Recent important advances in enantiomerically pure pharmaceuticals and the need for stereoselective quality control require constant development of validated efficient analytical methods. Direct enantiomeric separation and determination with liquid chromatography using chiral
1996; Ekelund et al., 1995; Petersen et al., 1997). Surely constant development of new efficient HPLC-CSP methods and thorough validation studies contributes to ensure accurate and reproducible determination of enantiomers in pharmaceuticals.
Propranolol (DL-1-(isopropylamino)-3-(1-naphthyloxy)-2-propanol) is a potent β-adrenergic antagonist drug, predominantly used in the treatment of angina pectoris, systemic and renal hypertension, cardiac arrhythmias and several other cardiovascular disorders (Barrett, Cullum, 1968; Moffat et al., 1986). Its molecular structure contains an aromatic naphthyloxy group attached to a side alkyl chain possessing a secondary hydroxyl and amine functional group (Figure 1). It possesses two enantiomers due to the presence of a chiral carbon in the alkyl side chain, adjacent to a hydroxyl group. The well acknowledged differential pharmacodynamic and pharmacokinetic profiles of R- and S-enantiomers rationalize their separation and determination in pharmaceuticals as well as in other relevant matrices.
Several indirect (Barrett, Cullum, 1968; Silber, Riegelman, 1980; Walle et al., 1984; Yang et al., 1997) as well as direct liquid chromatographic methods (Santoro, Cho, Kedor-Hackmann, 2001; Schmid et al., 2001;
Phem-Huy et al., 1995; Egginger et al., 1993; Aboul-Enein, Al-Duraibi, 1999; Mislanova et al., 2000; Aboul-Enein, Bakr, 1998; Matchett, Branch, Jefferies, 1996; Ekelund et al., 1995; Petersen et al., 1997; Chiral Application Guide, 2000) have been reported for their analysis. Most of these methods are shown to be useful for enantiomeric determination in biological samples (Phem-Huy et al., 1995; Egginger et al., 1993; Mislanova et al., 2000; Silber, Riegelman, 1980; Yang et al., 1997; Stoschitzky et al., 1995) but seldom in quality control or stability studies (Santoro, Cho, Hackmann, 2001; Singh, Kedor-Hackmann, Santoro, 2001; Petersen et al., 1997). In a previous work, enantiomeric separations and a quantitative determinations of atenolol and metoprolol (Singh, Kedor-Hackmann, Santoro, 2001) and propranolol (Santoro, Cho, Kedor-Hackmann, 2001) in pharmaceutical formulations, using cellulose based CSP (Chiralcel OD®) were presented. In the present paper an improved, specific, accurate and reproducible method for rapid routine stereospecific and quantitative analysis of propranolol (prop) enantiomers in a pharmaceutical dosage form is described.
MATERIAL AND METHODS
Material
Samples
The description of the samples studied is presented in Table I. The simulated sample (sample B) was prepared by mixing equivalent amount of racemic prop with excipients (Table I).
Reagents and solutions
Racemic prop. HCl (99%), R-prop. HCl (98%) and
S-prop. HCl (98%) were purchased from Aldrich (Milwaukee, WI, USA). All the solvents were of HPLC grade except ammonium acetate (analytical grade). Dichloromethane, methanol and ammonium acetate were obtained from Merck® (Darmstadt, Germany).
TABLE I - Representative commercial and simulated tablet samples selected for analysis
Sample Drug Tablet composition
A Racemic prop (40 mg)/tablet Commercial sample containing prop, starch, microcrystalline cellulose, lactose (monohydrate), gelatin, magnesium stearate (Mean wt. = 0.157 g) B Racemic prop (40 mg)/tablet Simulated sample prepared in laboratory with same composition as sample
A (Mean wt. = 0.160 g)
Placebo None Starch, microcrystalline cellulose, lactose (monohydrate), gelatin, magnesium stearate (Mean wt. = 0.160 g)
Equipments
A liquid chromatographic system consisted of a solvent delivery system, an auto injector fitted with 50 µL loop, an online degaseification system, a column thermostat oven; an UV/VIS photodiode array detector (Shimadzu Corporation, Japan) and a chiral stationary phase (S, S) α -Burke 2® (250 x 4,6 mm i.d.) [dimethyl N -3,5-dinitro-benzoyl-α-amino-2,2-dimethyl-4-pentenylphosphonate] covalently bound to 5 µm mercaptopropyl silica, 100 A° (Regis Technologies, Inc. USA) were used to perform the chiral separations.
Methods
Analytical conditions
Analytical conditions for prop were standardized through high performance liquid chromatography system using α-Burke 2® as chiral stationary phase. The samples were chromatographed at room temperature (24 °C ± 2), with an injection volume of 20 µL, a flow rate of 0.9 mL/min, UV detection was made at 280 nm. The mobile phase was constituted by a mixture of dichloromethane:methanol (90:10 v/v), along with 12 mM ammonium acetate. The mobile phase was prepared fresh each day and vacuum filtered throughhydrophobic membrane, 0.22 µm, Millipore® GVHP, and degassed for 20 minutes. The conditioning of the CSP was done by washing the system for 90 minutes with the mobile phase prior to injections.
Calibration curve
The calibration curve was constructed by analyzing in triplicate, nine different calibration standards ranging from 1.0 to 16.0 µg/mL of R- or S-prop, separately. The stock solution of R-prop and S-prop were prepared separately by weighing exactly 20.0 mg of standard, free base, in a 50 mL volumetric flask. Approximately 45 mL of methanol was added, followed by ultrasonication for 10 min. The volume was completed with the same solvent. An aliquot of 5.0 mL was transferred to a 100 mL volumetric flask and volume made up with mobile phase to obtain solutions containing 20.0 µg/mL of R-prop or S-prop. Appropriate dilutions were made with mobile phase to obtain nine concentration levels between 1.0–16.0 µg/mL of each enantiomer. Calibration curve was constructed by plotting mean peak-area of the individual enantiomer versus enantiomer concentration injected.
Preparation of standard solution for intra-day repeatability
Standard solution containing 400.0 µg/mL of R- or S -prop was prepared separately, as explained in calibration
curve section. A 5.0 mL aliquot of R-prop and equal volu-me of S-prop solution were transferred to a 100 mL volumetric flask and volume was made up with mobile phase. The final solution contains 40.0 µg of racemic prop/mL of solution.
Preparation of sample solutions for intra-day repeatability
Amounts of sample A or B, in triturated form, equivalent to 40.0 mg of prop free base was accurately weighed and transferred to a 100 mL volumetric flask. Approximately 95 mL of methanol was added to it and ultrasonicated for 10 min. The volume was completed with the same solvent. After filtration through Whatman no. 1 paper filter, 5.0 mL of filtrate was transferred to a 50 mL volumetric flask and the volume was made up with the mobile phase. The final solution contains 40.0 µg of racemic prop/mL of solution.
Three final dilutions containing 3.2, 16.0 and 32.0 µg/mL of racemic prop were obtained by appropriate dilution of above standard and sample solutions with mo-bile phase. Six replicates of each sample solution (sample A and B) and triplicate injection of standard solutions, were injected (20 µL) into the HPLC system. All the solutions, before injection, were filtered through HV Millex, Durapore® membrane, 0.45 µm, 13 mm.
Sample preparation for recovery test
Standard solution and sample solutions (A and B) were prepared separately as described above to obtain 40.0 µg/mL of racemic prop. The method accuracy was accessed by determining the agreement between the difference in the measured analyte concentrations of the fortified and unfortified samples and the known amount of analyte added to the fortified sample. Single enantiomer solutions with known concentrations were used to fortify racemic sample solution. Triplicate determinations were performed at three concentration levels. Further details are presented in Table V (Jenke, 1996; ICH, 2001).
RESULTS AND DISCUSSION
Enantiomeric separation
Prop is a basic molecule with pKa 9.5 (Moffat et al., 1986). The manufacturers of α-Burke 2® CSP (Chiral Application Guide, 2000) recommend utilization of ammonium acetate at low concentration (10–40 mM) for peak elution and improvement of peak shape. Systematic experiments were conducted to study the effect of ammonium acetate concentration and operating temperature on enantiomeric resolution, retention time and peak asymmetry. Most efficient separation was obtained at room temperature utilizing mobile phase constituted of
dichloromethane:methanol (90:10 v/v) with 12 mM of ammonium acetate at a flow rate of 0.9 mL/min. Detection was made at 280 nm (Figure 2). All conditions were selected for validation of method keeping in view practical application of proposed method for efficient routine analysis of prop enantiomers in pharmaceutical formulations.
System suitability test
System suitability tests are an integral part of all liquid chromatographic methods. The test was performed by repeated analysis of sample solution (n=6) and relative
standard deviation amid elution parameter studied. There was insignificant deviation in the values of relative retention (k1 and k2) selectivity (α), resolution (Rs) and number of theoretical plates (N) (Table II).
Selectivity
The formulation excipients did not interfere in the analysis of enantiomers. The placebo sample injected under similar analytical conditions demonstrated selectivity of the proposed method. The elution order of R- and S-prop was determined by injecting them, separately, into the system.
Linearity
The calibration curves for R- and S-prop were constructed at nine concentration levels in the range from 1.0 to 16.0 µg/mL, and triplicate determination was made at each level (n=3). Two calibration curves, one for each enantiomer, were constructed by plotting mean response area against corresponding concentration injected, using the least squares method. The correlation coefficient for
R-prop (r = 0.9995) and for S-prop (r = 0.9998) along with other relevant data, indicates good linearity (Table III). Low concentration ranges were intentionally selected to make the proposed method especially useful for the
determination of R- or S-prop impurities in the presence of its antipode.
Limit of detection and limit of quantitation
The limit of detection (LOD) and limit of quantitation (LOQ) with acceptable precision (RSD < 2 %) (Jenke, 1996) were determined based on the standard deviation (SD) of the responses and the slope of the calibration curve (S), via equation LOD = 3 x (SD/S) and LOQ = 10 x (SD/S). The calculated theoretical values were cross checked by actual analysis (in triplicate) of refereed concentrations and relative standard deviation of the responses determined. The limit of detection values for R-prop and S-R-prop were 1.31 ng and 1.37 ng and corresponding values for limit of quantitation were 4.37 ng and 4.58 ng, respectively (Table III). Unlike previously reported liquid chromatographic methods, the proposed method presents excellent sensitivity in the determination of R- and S-prop.
Precision
Method precision was determined by measuring intra-day repeatability of responses for R-prop and S-prop in commercial and simulated samples. The analysis were carried out at three concentration levels, i.e. 3.2, 16.0 and 32.0 µg/mL of racemic sample A or sample B. Variations were expressed in terms of relative standard deviation values calculated from six replicate determination at each concentration level of R- and S-prop. The low level of RSD with excellent confidence limits indicates good precision of the proposed method (Table IV).
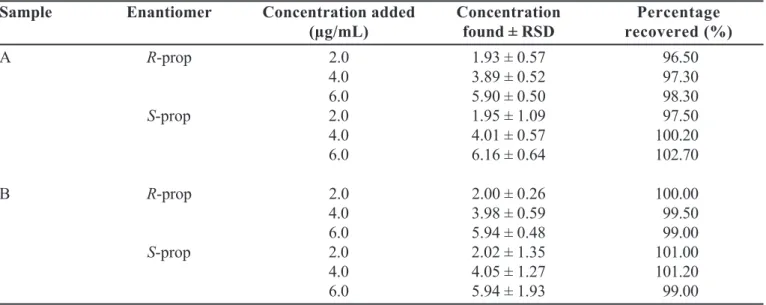
Accuracy
Method accuracy was determined at three concentration levels i.e. 8.0, 10.0 and 12.0 µg/mL, with triplicate determination at each concentration level. The accuracy of the method was expressed as average recovery of the analyte from the sample matrix (Sample A and sample B) (Jenke, 1996; ICH, 2001). The three
TABLE II - Chromatographic data for propranolol enantioseparation on α-Burke 2® by analysis of samples A and B (n=6)
0 0 1 1
t
t
t
K
=
−
0 0 2 2
t
t
t
K
=
−
1 2
k
k
=
α
2
(
12 12)
w
w
t
t
Rs
+
−
=
2 16 ⎟ ⎠ ⎞ ⎜ ⎝ ⎛ = b r w t N1.62 2.1 1.3 3.0 6724 (R-prop) 5184(S-prop)
TABLE III - Linearity of the calibration curve for R- and S -propranolol enantiomers
Parameter R-propranolol S-propranolol
Concentration range 1.0 – 16.0 * 1.0 – 16.0 * (µg/mL)
Calibration points 9 9
Linearity
Intercept 2038.2 119.39
Slope 21122 21157
Correlation coefficient 0.9995 0.9998 Limit of detection * 1.31 ng 1.37 ng Limit of quantitation * 4.37 ng 4.58 ng
concentrations were selected in such a way, so that, they fall within 80.0–120.0% of the mean value and at the same time covering the same range as that for linearity (AOAC, 1990). The recoveries of R- as well as S-prop from sample matrices were near 100 percent with acceptable deviations (Table V).
CONCLUSION
The proposed method for enantiomeric separation
and quantitative determination of prop enantiomers in tablets and bulk drugs is efficient and sensitive. The excipients of the commercial sample analyzed did not in-terfere in the analysis, which proved the enantio-specificity of the method. The ease of sample preparation permits fast and efficient application of the proposed method in quantitation of prop with precision and accuracy. The shorter analysis time permits its application in the routine quality control of prop enantiomers in commercial samples.
TABLE IV- Statistical data showing precision of the proposed method, at three concentration levels (n=6), in the determination of propranolol enantiomers in samples A and B
Sample Enantiomer Conc. of racemic Peak area Standard deviation Relative standard
sample (µg/ml) (SD) deviation (RSD)
A R-prop 2.0 34030 465 1.50
4.0 165263 597 0.39
6.0 336112 853 0.28
S-prop 2.0 34858 421 1.32
4.0 173015 2229 1.41
6.0 350125 3739 1.71
B R-prop 2.0 34450 380 1.21
4.0 168225 869 0.58
6.0 338952 1701 0.55
S-prop 2.0 35495 463 1.43
4.0 175982 1713 1.07
6.0 356902 3808 1.17
TABLE V - Statistical data showing accuracy of the proposed method, at three concentration levels (n=3), in the determination of propranolol enantiomers in samples A and B
Sample Enantiomer Concentration added Concentration Percentage
(µg/mL) found ± RSD recovered (%)
A R-prop 2.0 1.93 ± 0.57 96.50
4.0 3.89 ± 0.52 97.30
6.0 5.90 ± 0.50 98.30
S-prop 2.0 1.95 ± 1.09 97.50
4.0 4.01 ± 0.57 100.20
6.0 6.16 ± 0.64 102.70
B R-prop 2.0 2.00 ± 0.26 100.00
4.0 3.98 ± 0.59 99.50
6.0 5.94 ± 0.48 99.00
S-prop 2.0 2.02 ± 1.35 101.00
4.0 4.05 ± 1.27 101.20
RESUMO
Separação e determinação quantitativa dos enantiômeros do propranolol em preparações
farmacêuticas por cromatografia quiral
Neste trabalho é descrito um método validado empre-gando a cromatografia líquida de alta eficiência com fase estacionária quiral para a separação e determi-nação quantitativa dos enantiômeros do propranolol em formulações farmacêuticas. A separação foi
obti-da em meio orgânico polar empregando a coluna α
-Burke 2® como fase estacionária quiral (250 x 4,6 mm,
5μm) e fase móvel constituída por diclorometano:
metanol (90:10 v/v) juntamente com 12 mM de acetato de amônio e vazão de 0,9 mL/min. A detecção foi efe-tuada por absorção no ultravioleta a 280 nm. Em to-dos casos o tempo de corrida foi menor do que 10 min. O coeficiente de correlação obtido pelo método de
regressão linear foi de 0,9995 para o R-prop e de
0,9998 para o S-prop. A precisão intra-dia, expressa
como desvio padrão relativo, foi menor do que 2%. A
exatidão, determinada pela recuperação média de R
-e S-prop nas amostras foi de 97,3% e 100,1% para a
amostra comercial e de 99,5% e 100,4% para a amos-tra simulada, respectivamente. Excelentes níveis para os limites de detecção (1,34 ng) e de quantificação (4,47 ng), além do tempo rápido de eluição dos enantiômeros do propranolol, confirmam a aplicabilidade do método no controle de qualidade de preparações farmacêuticas contendo este fármaco.
UNITERMOS: Separação enantiomérica. Cromatografia líquida. Validação do método. Propranolol. Comprimidos.
ACKNOWLEDGEMENT
We are indebted to FAPESP (Fundação de Ampa-ro à Pesquisa do Estado de São Paulo, São Paulo, Brazil) for continuous financial support.
REFERENCES
ABOUL-ENEIN, H.Y.; ABOU-BASHA, L.I.; BAKR, S.A. Direct enantioselective separation of some propranolol analogs by HPLC on normal and reversed cellulose chiral stationary phases. Chirality, New York, v. 8, p. 153-156, 1996.
ABOUL-ENEIN, H.Y.; AL-DURAIBI, I.A. Enantiomeric separation of propranolol and analogs on newly developed Chirose C1 chiral stationary phase. Enantiomer., Reading, v. 4, p. 451-454, 1999.
ABOUL-ENEIN, H.Y.; BAKR, A.S. Enantiomeric resolution of propranolol and analogs on two cellulose (Chiralcel OF and OC) and one amylose (Chiralpak AD) chiral stationary phases. J. Liq. Chromatogr. Rel. Tech., New York, v. 21, p. 1137-1145, 1998.
ASSOCIATION OF OFFICIAL ANALYTICAL CHEMISTS (AOAC). Official methods of analysis of the Association of Official Analytical Chemists. 15.ed. Arlington, 1990. p.15-17.
BARRETT, A.M.; CULLUM, V.A. Biological properties of optical isomers of propranolol and their effects on cardiac arrhythmias. Br. J. Pharmacol., Basingstoke, v. 34, p. 43-55, 1968.
CHIRAL APPLICATION GUIDE III. Morton Grove: Regis Technologies, 2000. 77p.
EGGINGER, G.; LINDNER, W.; VANDENBOSCH, C.; MASSART, D. Enantioselective bioanalysis of β -blocking agents: focus on atenolol, betaxolol, carvedilol, metoprolol, pindolol, propranolol and sotolol. Biomed. Chromatogr., Sussex, v. 7, p. 277-295, 1993.
EKELUND, J.; VANARKENS, A.; BRONNUMHANSEN, K.; FICH, K.; OLSEN, L.; PETERSEN, P.V. Chiral separations of β-blocking drug substances using chiral stationary phases. J. Chromatogr. A., Amsterdam, v. 708, p. 253-261, 1995.
INTERNATIONAL CONFERENCE ON HARMONI-ZATION OF TECHNICAL REQUIREMENTS FOR REGISTRATION OF PHARMACEUTICALS FOR HUMAN USE: ICH Harmonized Tripartite Guideline.
Validation of analytical procedures: methodology.
Disponível em: <http://www.ifpma.org/pdfifpma/ q2b.pdf>. Acesso em: 27 set. 2001.
MATCHETT, M.W.; BRANCH, S.K.; JEFFERIES, T.M. Polar organic chiral separation of propranolol and analogues using a β-cyclodextrin bonded stationary phase.
Chirality, New York, v. 8, p. 126-130, 1996.
MISLANOVA, C.; STEFANCOVA, A.; ORAVCOVA, J.; HORECKY, J.; TRNOVEC, T.; LINDNER, W. Direct high-performance liquid chromatographic determination of (R)- and (S)-propranolol in rat microdialysate using on-line column switching procedures. J. Chromatogr. B., Amsterdam, v. 739, p. 151-161, 2000.
MOFFAT, A.C., JACKSON, J.V., MOSS, M.S., WIDDOP, B. In: _____. Clarke’s isolation and identification of drugs in pharmaceuticals, body fluids and
post-mortem material. 2.ed. London: The Pharmaceutical
Press, 1986. 1223p.
PETERSEN, P.V.; EKELUND, J.; OLSEN, L.; OVESEN, S.V. Chiral separations of β-blocking drug substances using the Pirkle-type alpha-Burke 1 chiral stationary phase. J. Chromatogr. A., Amsterdam, v. 757, p. 65-71, 1997.
PHEM-HUY, C.; RADENEN, B.; SAHUIGNASSI, A.; CLAUDE, J.R. High performance liquid chromatographic determination of (S) and (R)-propranolol in human plasma and urine with a chiral β -cyclodextrin bonded phase. J. Chromatogr. B., Amsterdam, v. 665, p. 125-132, 1995.
SANTORO, M.I.R.M.; CHO, H.S.; KEDOR-HACKMANN, E.R.M. Enantiomeric separation and quantitative determination of propranolol in tablets by chiral high-performance liquid chromatography. Drug Dev. Ind. Pharm., New York, v. 27, p. 693-697, 2001.
SCHMID, M.G.; GECSE, O.; SZABO, Z.; KILAR, F.; GUBITZ, G.; ALI, I.; ABOUL-ENEIN, H.Y. Comparative study of the chiral resolution of β-blockers on cellulose tris (3,5-dimethylphenylcarbamate) phases in normal and reversed phase modes. J. Liq. Chromatogr. Rel. Tech., New York, v. 24, p. 2493-2504, 2001.
SILBER, B.; RIEGELMAN, S. Stereospecific assay for (-) and (+)-propranolol in human and dog plasma. J. Pharmacol. Exp. Ther., Baltimore, v. 215, p. 643-648, 1980.
SINGH, A.K.; KEDOR-HACKMANN, E.R.M.; SANTORO, M.I.R.M. Development and validation of a chiral liquid chromatographic method for the determination of atenolol and metoprolol enantiomers in tablet preparations. J. Assoc. Off. Anal. Chem. Int., Gaithersburg, v. 84, p. 1724-1729, 2001.
STOSCHITZKY, K.; KAHR, S.; DONNERER, J.; SCHUMACHER, M.; LUHA, O.; MAIER, R.; KLEIN, W.; LINDNER, W. Stereoselective increase of plasma concentrations of the enantiomers of propranolol and atenolol during exercise. Clin. Pharmacol. Ther., St. Louis, v. 57, p. 543-551, 1995.
WALLE, T.; WALLE, U.K.; WILSON, M.J.; FAGAN, T.C.; GAFFNEY, T.E. Stereoselective ring oxidation of propranolol in man. Br. J. Clin. Pharmacol., Oxford, v. 18, 741-748, 1984.
YANG, X.J.; FUKUSHIMA, T.; SANTA, T.; HOMMA, H.; IMAI, K. Enantiomeric separation and sensitive detection of propranolol, metoprolol and atenolol derivatized with a fluorogenic reagent, 4-(N-chloroformylmethyl-N- methyl)amino-7-N,N-dimethylaminosulfonyl-2,1,3-benzoxadiazole (DBD-COCI), on cellulose chiral columns in the reversed-phase mode. Analyst, Cambridge, v. 122, p. 1365-1369, 1997.