Article
J. Braz. Chem. Soc., Vol. 28, No. 8, 1517-1527, 2017. Printed in Brazil - ©2017 Sociedade Brasileira de Química 0103 - 5053 $6.00+0.00
*e-mail: [email protected]
Implementation of a Spectrofluorimetric Method to the Determination of 8-Methoxypsoralen
in Capsules and Creams Used in Treatment of Psoriasis and Vitiligo: an Evaluation of the
Quality of Compounding Pharmacies in Rio de Janeiro
Catarina A. Oliveira,a,b Marcos M. Gouvêa,a,c Flávio H. S. A. Ribeiro,c
Eduardo Ricci-Júniord and Flávia F. C. Marques*,a,c
aPrograma de Pós-Graduação em Química, Universidade Federal Fluminense,
24020-141 Niterói-RJ, Brazil
bInstituto Federal de Educação, Ciência e Tecnologia do Rio de Janeiro, Campus Rio de Janeiro,
20270-021 Rio de Janeiro-RJ, Brazil
cDepartamento de Química Analítica, Instituto de Química, Universidade Federal Fluminense,
24020-141 Niterói-RJ, Brazil
dDepartamento de Fármacos e Medicamentos, Faculdade de Farmácia,
Universidade Federal do Rio de Janeiro, 21941-972 Rio de Janeiro-RJ, Brazil
8-Methoxypsoralen is a widely sold drug in Brazil as handled capsules and creams because it is only industrially available as soft gel capsules of 10 mg. In order to contribute to the quality control of these pharmaceutical forms, a spectroluorimetric method was implemented and applied for the evaluation of the quality of compounding pharmacies in the state of Rio de Janeiro (Brazil). Solutions of 8-methoxypsoralen prepared in ethanol/water (30:70 v/v) produced luorescence signals at excitation/emission wavelengths of 305/495 nm. The method presented good precision (relative standard deviation, RSD < 4.8%) and recoveries in the pharmaceutical samples from 88.5-108% indicated its feasibility. The results of assay (dosing) and uniformity of content suggested that two of the three evaluated pharmacies did not have appropriate techniques in the preparation of these formulations, which could potentially reduce the eficiency of dermatoses treatment. The implemented method is an alternative to those described in literature for pharmaceutical forms containing 8-methoxypsoralen.
Keywords: 8-methoxypsoralen, spectroluorimetry, compounded medicine, quality control,
compounding pharmacy, dermatosis
Introduction
Dermatoses are a series of skin conditions that can occur in individuals of all ages and both sexes, and may be caused by infections, allergic reactions, inlammation, genetic factors, etc. It is a main cause of demand for health services, indicating a public health problem.1 These skin diseases are
accompanied by symptoms and clinical manifestations such as stains, peeling, dryness, itching, swelling and/or pain. Furthermore, the progression of these lesions on the body surface has repercussions on the personal, professional and social life of sufferers, which signiicantly affects their quality of life and self-esteem.2
The psoralens, such as 8-methoxypsoralen (8-MOP) (Figure 1), belong to a class of natural substances called furanocoumarins and represent one of the most used drugs in the treatment of skin diseases, including psoriasis, vitiligo and mycosis fungoides.3-6
subsequent partial or total body surface exposure to ultraviolet (UV) radiation. This photochemical treatment is commonly called photochemotherapy or PUVA therapy, which stands for psoralen associated to radiation in the UVA (320-400 nm) region. The major responses to this treatment are due to immunomodulatory/immunosuppressive, anti-inlammatory, antiproliferative and pigment effects.7
Currently, there are various commercially available pharmaceutical forms containing 8-MOP. Among the forms available for sale in the United States, those approved by the Food and Drug Administration (FDA) stand out as sterile solutions (UVADEX®, Therakos, Inc.), capsules for oral administration (8-MOP®, Valeant Pharmaceuticals Intl, OXSORALEN-ULTRA®, Dow Pharmaceutical Sciences, Inc.) and lotions for topical use (OXSORALEN®, Valeant Pharmaceuticals Intl). In Brazil, the industrialized production of these drugs is available in the form of soft capsules of 10 mg (OXSORALEN®, Valeant Pharmaceuticals of
Brazil). However, the use of the drug is also allowed by the Brazilian Health Regulatory Agency (ANVISA) in the form of compounded products, commonly prescribed as hard capsules and creams.
The compounded medicines are extremely important to fulill the needs of people with special medical prescription, since the manufactured pharmaceutical products have limited quantities of speciic forms and dosages. Therefore, some forms do not always meet the therapeutic requirements inherent to each individual.8 Each pharmaceutical form
has a quality control procedure described in the Good Manufacturing Practice for Compounded Medicines determined by ANVISA. When the units contain 25 mg or less of drug dosage, the compounding pharmacy must perform this analysis of at least one formulation every two months in its laboratory or outsourced.9,10
In this context, many studies and information are reported about compounding, such as the assessment of the inal product quality, comparison with industrial formulations and evaluation of manipulation process.11-14
It is noteworthy that compounding pharmacies can produce their based pharmaceutical formulations recommended in standard reference sources or provided by manufacturers of pharmaceutical raw materials. However, non-oficial formulations may exhibit variations in their compositions when manipulated in different pharmacies, leading to varied products.8
According to Brazilian Pharmacopoeia, spectro-photometry is the reference method for the 8-MOP content determination in raw material.15 However, its use in
medicines and complex samples is limited, since the method does not suggest any treatment for elimination of possible interferences. In Brazil, it is allowed to use pharmacopoeial
methods from other countries, when there is no speciic national monograph for a drug product. Commonly, it is employed the United States Pharmacopoeia (USP), in which chromatographic technique with UV detection is recommended to determine the dosage of this drug in medicines and raw material.16
Then, this work aims the implementation of an analytical method to the determination of 8-MOP in medicines and, consequently, evaluate the quality of compounded pharmaceutical preparations commercially available as creams and capsules. A spectroluorimetric determination was chosen for quantiication of 8-MOP in the manipulated formulations due to the knowledge about the intrinsic luorescence characteristics of the molecule.17 This is a low-cost
and simple technique when compared to the chromatographic methods described in the literature for 8-MOP and its isomer 5-methoxypsoralen (5-MOP),18-21 becoming more
appealing for compounding pharmacies. Said et al.22
published a paper describing a spectroluorimetric method to another psoralen (5-methoxypsoralen) in serum samples of patients, but did not show results for 8-MOP. Therefore, this paper suggests a simple and direct spectroluorimetric determination of 8-MOP in compounded medicines available in Brazilian market as capsules and creams.
Experimental
Instrumentation
Fluorescence measurements were performed using a Varian luminescence spectrophotometer (Cary Eclipse model). Fluorescence spectra were acquired on a computer using the SW Eclipse® Bio Pack V 1.1 (XP WIN2000) software. Quartz cuvette (1 cm optical path length), 10 or 20 nm spectral bandpass and 1200 nm s-1 scan velocity were
used. The 8-MOP luorescence intensities were obtained in its maxima wavelengths of excitation (305 nm) and emission (495 nm), after optimization of selected parameters.
For the optical microscopy of the 8-MOP standard and hard capsules, it was used an optical microscope Quimis (4×), model Q711TH-PL, attached to an image analyzer (Moticam 1000, Motic) with the software Motic Images Plus version 2.0.
Chemicals and solutions
Tedia Brazil, Rio de Janeiro, Brazil) were employed in preliminary studies. Ultrapure water (resistivity of 18.2 MΩ cm) was prepared through a Simplicity System
(Millipore, United States of America (USA)) following reverse osmosis (Rios D3, Millipore, USA).
Solutions of Britton-Robinson buffer (0.04 mol L-1)
were employed in the pH study. They were prepared by mixing aqueous solutions of acetic acid, boric acid and phosphoric acid (analytical grades, Vetec, Rio de Janeiro, Brazil) in the same proportions. The pH of the buffer solutions (from 2 to 12) were adjusted by the addition of a concentrated solution of sodium hydroxide (analytical grade, Vetec, Rio de Janeiro, Brazil). Analyte stock solutions were prepared in 100% ethanol, and potassium chloride (analytical grade, Vetec, Rio de Janeiro, Brazil) was used in pretreatment of semisolid samples (creams).
Commercial samples of creams (CRM-1, CRM-2 and CRM-3) and hard capsules (CP-1, CP-2 and CP-3) containing 0.1% m/m and 10 mg of 8-MOP, respectively, were obtained from three different compounding pharmacies (1, 2 and 3). Two of them are located in Rio de Janeiro city and one in Niteroi city, state of Rio de Janeiro, Brazil.
General procedures
The luminescent characteristics of 200 ng mL-1 8-MOP
solutions were investigated by changing the medium polarity, adding different proportions of water (0-99%); and by varying apparent pH using a ixed ratio of organic solvent in buffer solution (pH 2-12). The solvents methanol, ethanol, acetonitrile and acetone were tested, due to the low solubility of 8-MOP in water.
An additional study of stability of 8-MOP in ethanol and water was proceeded to establish the most suitable time for luorescence measurements of solutions prepared with the mixture of these solvents. In this step, 1000 ng mL-1
analyte solutionswere studied in the media containing ethanol/water (30:70 v/v).
After implementation of the best conditions for analyte measurement, the method validation was done considering the following parameters: linearity, limit of detection (LOD), limit of quantiication (LOQ), precision, accuracy and robustness. The method was applied to evaluate the content of 8-MOP in solid and semisolid pharmaceutical forms from compounding pharmacies.
Procedures for determination of 8-MOP in hard capsules
Tests of average weight (AW), content of the active ingredient in the pool of capsules (assay) and uniformity
of content (UC) were performed based on the Brazilian Pharmacopoeia.23 To carry out the irst test, 20 units had
the weight of the contents individually determined by the difference between the masses of the full and empty capsules. With the values obtained, the average weight of the contents was calculated.
The assay of 8-MOP in hard capsules was determined using a mixing of the contents of ive capsules. This mixture was dissolved in ethanol with the aid of ultrasonic bath during 5 min. This solution was diluted to 500 µg mL-1 of
8-MOP in the same organic solvent and then centrifuged at 6000 rpm (2.012 g) for 10 min. After that, aliquots of the supernatant were taken and diluted to theoretical analyte concentrations of 800 ng mL-1 and prepared under
optimal conditions for analytical measurement (ethanol/ water 30:70 v/v).
Finally, the uniformity tests of unit doses were carried out according to the procedure of UC described in the Brazilian Pharmacopoeia,23 which allowed the assessment
of the amount of active component present in each capsule of the same batch. It was based on the determination of the content of 10 single unit doses, which were analyzed employing the proposed spectroluorimetric method.
Procedures for determination of 8-MOP in topical creams
For the assay of semisolid dosage forms using the proposed spectroluorimetric method, a pretreatment of these samples was necessary in order to obtain a clear extract to measure the luorescence signal of the 8-MOP. For this purpose, 250 mg of each product were weighed (in triplicate), dissolved in ethanol under ultrasonic bath during 5 min, and transferred to a 25 mL volumetric lask. From this solution, an aliquot was diluted in medium containing ethanol/1.0 mol L-1 KCl (30:70 v/v) to concentrations
situated in the range of the analytical curve. This saline solution replaced the aqueous medium (ethanol/water 30:70 v/v) without compromising the performance of the measurements of 8-MOP in their wavelengths of excitation and emission (305/495 nm). This solution was vigorously stirred in vortex mixer for 10 s, centrifuged for 10 min at 6000 rpm (2.012 g), iltered through a 0.45 µm polytetraluoroethylene (PTFE) syringe ilter and inally measured directly in the luorescence spectrophotometer.
Results and Discussion
Fluorescence studies for 8-MOP
luminophore. The presence of delocalized π electrons due to
the presence of the aromatic ring, and rings with conjugated double bonds favors transitions between the π electronic
orbital and π* antibonding orbital, resulting in a so-called ππ* excited state. In general, the presence of an electron
donor substituent (methoxyl group) bonded to the aromatic ring induces the luorescence signal. The heteroatoms with free electrons in a conjugated system also contribute for quantum eficiency because of the promotion of electrons from an orbital n to a π* antibonding orbital resulting in
an excited state (nπ*).24,25
Although the luorescence capacity is a function of the molecular structure, the solvent can also have a strong effect on it.26 The choice of the solvent system must consider both
the analyte solubility and the signal intensity.27 The solutions
of 8-MOP prepared in ethanol, acetone and acetonitrile showed good solubility even at high concentrations. However, methanol was disregarded in subsequent studies because of the prolonged time needed to dissolve the same quantity of the analyte and due to its higher toxicity.
The ππ* singlet excited state is strongly dependent upon
the nature of the solvent, affecting the luorescence signal of the molecule.28 In non-polar solvents, the luorescence
is too weak to be measured, while in polar solvents, higher intensities are observed. Protic solvents, such as ethanol, lead to an increase in the yield of luorescence compared to non-protic solvents, like acetone and acetonitrile. The hydrogen bonds reduce the energy of the transitions ππ*,
a desirable effect in the phenomenon of luorescence. As can be seen in the Figure 2, ethanol was able to stabilize more eficiently the molecules of 8-MOP in the
excited state through electrostatic attractions, favoring the process of radiative deactivation.
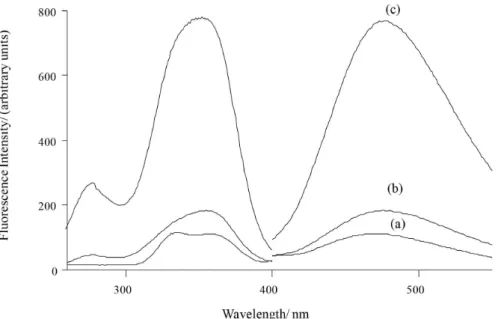
The effect of solvent polarity is best evidenced in Figure 3, using different proportions of ethanol and water, both protic solvents. The addition of water in the solution substantially increased the luorescence of the molecule. However, in amounts higher than 70% of water, the 8-MOP luorescence is reduced, probably because of the decreasing solubility in the aqueous medium. Another effect observed was the bathochromic shift of the emission wavelength of the analyte from 475 to 505 nm, which was larger with the increase of the amount of water in the solvent system. Therefore, the maximum luorescence intensity was observed in the polar solvent system containing ethanol/water 30:70 v/v, at 305 and 495 nm as maximum wavelengths of excitation (λexc) and emission (λem), respectively.
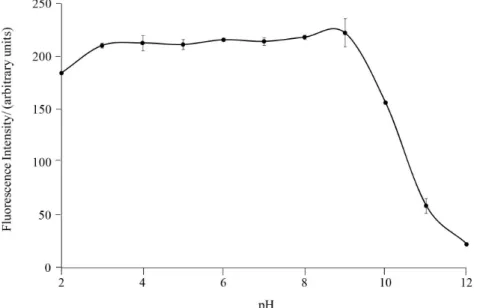
The effect of pH is also important in the luorescence of molecules, because it is very common to observe a signiicant difference between the luminescent properties of protonated and non-protonated molecules, besides the possibility of acidic or basic hydrolysis. The charged species have more intense signals owing to their higher molecular rigidity, which affects the energy of the excited state and consequently increases the luorescence quantum yields.29 The luorescence signal of 8-MOP as a function of
apparent pH was robust at a pH range from 3 to 8 (Figure 4). As the original pH of the hydroalcoholic solution of 8-MOP is 5.5 ± 0.2, this study indicated that it was not necessary to use a buffer solution or pH adjustment.
Stability studies of the analytes during the implementation of the analytical method are important to
Figure 2. Fluorescence excitation and emission spectra for 8-MOP (200 ng mL-1) solutions prepared in (a) acetone; (b) acetonitrile; (c) ethanol. Their
respective blank signals are not signiicant in the maximum wavelengths. Measurement conditions: quartz cuvette of 1 cm optical path length, 20 nm spectral bandpass, 1200 nm s-1 scan velocity and λ
ensure the reliability of results.30 Therefore, a short-time
evaluation of the stability of three 8-MOP stock solutions prepared in ethanol (100%) at a concentration of 200 ng mL-1, kept under refrigeration (2-8 oC), was done for
thirty days. As the largest relative standard deviation (RSD) obtained, considering fluorescence measurements at
λexc/λem = 305/495 nm, was 4% (reference value is 15%),31
the 8-MOP solutions prepared in ethanol (100%) could be considered stable along the period evaluated. However, the solutions prepared in the polar solvent system containing
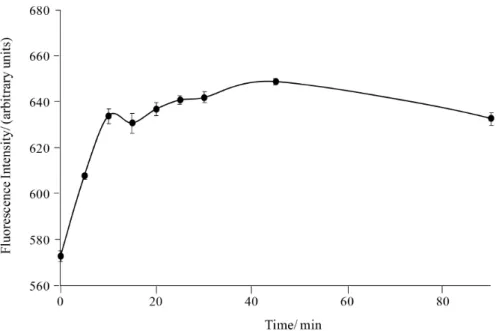
ethanol/water 30:70 v/v, showed instability and had an increase of about 20% in the signal during the irst 15 min after its preparation. Thus, their luorescence signals must be measured at least 20 min after solution preparation, time from which the signal is stable at least up to 2 hours (Figure 5).
The results under such final optimized conditions showed that the best signals (λexc/λem = 305/495 nm) were
achieved in 8-MOP solutions prepared in ethanol/water 30:70 v/v, which has a pH value of 5.5 ± 0.1 and must be
Figure 3. Fluorescence intensity of 8-MOP (1000 ng mL-1) in function of increasing polarity of the solvent with the addition of water to the ethanolic
solution and the bathochromic shift of the emission wavelength from 475 to 505 nm, where (a) 0%; (b) 40%; (c) 70%; (d) 99% of water. Measurement conditions: quartz cuvette of 1 cm optical path length, 10 nm spectral bandpass, 1200 nm s-1 scan velocity and λexc/λem = 305/475 to 505 nm.
Figure 4. Inluence of pH in the luorescence intensity of 8-MOP (1000 ng mL-1) solutions prepared in ethanol/Britton-Robinson buffer (30:70 v/v).
Measurement conditions: quartz cuvette of 1 cm optical path length, 10 nm spectral bandpass, 1200 nm s-1 scan velocity and λ
measured at least 20 min after preparation to guarantee the best luorescence signal stabilization.
Analytical parameters of merit
The analytical parameters of merit were obtained for 8-MOP in the optimized conditions set for its determination in manipulated hard capsules and creams and were evaluated according to the International Conference on Harmonization ICH Q2 (R1),32 and Resolution No. 899 of
ANVISA,31 which follows international regulations.
The parameters of the analytical curves, constructed using luorescence signals (arbitrary units) from 8-MOP solutions prepared in ethanol/water 30:70 v/v in the range of 40 to 1400 ng mL-1, were obtained by the least squares
method and indicated good linear responses (R2 = 0.9996).
The absence of outliers for each concentration level was demonstrated by the Grubbs test and a normal distribution of residuals was conirmed by Shapiro-Wilk test (conidence limit of 95%), with value of W = 0.874, which is above the critical tabulated value (0.803). The statistical signiicance of the curves was veriied by analysis of variance (ANOVA) and the F-test for lack of it (conidence limit of 95%). The F value calculated by ANOVA (F= 14012) was larger than the tabulated value (4.74), while in the lack of it test, the obtained F value (0.87) was lower than the tabulated value (3.66), showing that the linear model is adequate to describe the proportionality between luorescence signals and concentrations.32
The LOD and LOQ were calculated according to the 3sb/m and 10sb/m criteria, where sb is the standard deviation
of 10 replicates of the blank solution and m is the slope of the regression line. In this study, the LOD and LOQ obtained were 12 and 40 ng mL-1, respectively.
Repeatability lower than 3.2% was estimated using the RSD (%) based on three consecutive measurements of three concentration levels (80, 800 and 1400 ng mL-1) of 8-MOP
standard solutions under the same experimental conditions. These results showed the very good precision of the method even in the lowest portion of the analytical curve.
The intermediate precision better than 4.8% was obtained by measurements of 8-MOP solutions at three concentration levels (80, 800 and 1400 ng mL-1) in
independent triplicates, prepared by the same analyst on two different days. The mean of the luorescence signal intensity obtained on different days were compared by the Student’s t-test (conidence limit of 95%). The calculated
value of t (1.272) was smaller than the tabulated value
(2.780), indicating that the implemented method presents good intermediate precision for 8-MOP determination.32
The robustness of the method was evaluated taking into consideration the inluence of the pH variation and ratio of water in the luorescence signal of 8-MOP. A robust condition with no signiicant variation of the signal was found for the pH values ranging from 3.0 to 8.0, and for 8-MOP solutions prepared in ethanol/water in the proportions between 40:60 and 20:80 v/v. The F values were calculated based on ANOVA. The calculated F values, FpH = 1.4 and Fratio of water = 9.3, did not exceed the tabulated
value 5.192 and 9.552, respectively, indicating no statistical difference between the means obtained at different pH values and proportions of water in the solutions of 8-MOP. Figure 5. Stability of 8-MOP solutions (700 ng mL-1) prepared in ethanol/water (30:70 v/v). Measurement conditions: quartz cuvette of 1 cm optical path
length, 20 nm spectral bandpass, 1200 nm s-1 scan velocity and λ
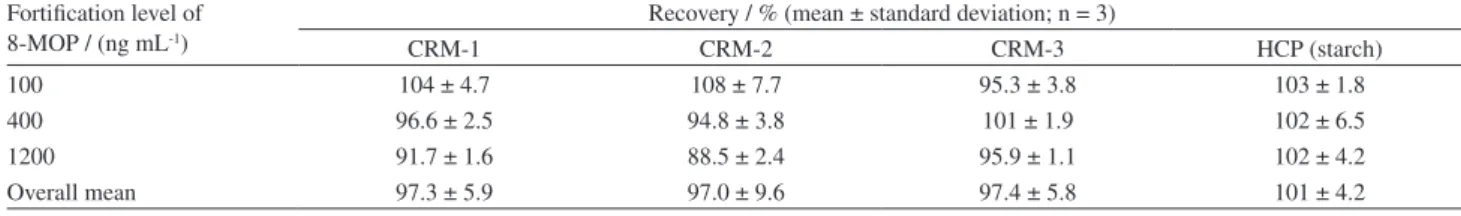
Method trueness was evaluated through recovery studies of spiked topical creams samples and spiked placebo of capsules (starch for all formulations), applying the extraction procedures (Experimental section, General procedures sub-section) and the spectrofluorimetric method. Recovery rates were calculated dividing the difference between the measured concentrations of spiked and non-spiked samples by the spiked concentration and expressing this ratio in a percentage basis. Recovery tests performed on three concentration levels (100, 400 and 1200 ng mL-1), in independent triplicates, led to recoveries
between 88.5 and 108% for creams and placebo of capsules. At the target concentration (level representing the center of the analytical curve), recoveries between 94.8 and 102% were obtained, demonstrating a good accuracy of the proposed method for 8-MOP determination in hard capsules and creams (Table 1). All analytical parameters of merit described above are summarized in Table 2.
The ability of the method to properly quantify the analyte in the samples is illustrated in Figure 6.
The proposed spectrofluorimetric method for the determination of 8-MOP offers many advantages over
Table 1. Recovery results for topical cream samples (CRM) and hard capsules placebo (HCP)
Fortiication level of 8-MOP / (ng mL-1)
Recovery / % (mean ± standard deviation; n = 3)
CRM-1 CRM-2 CRM-3 HCP (starch)
100 104 ± 4.7 108 ± 7.7 95.3 ± 3.8 103 ± 1.8
400 96.6 ± 2.5 94.8 ± 3.8 101 ± 1.9 102 ± 6.5
1200 91.7 ± 1.6 88.5 ± 2.4 95.9 ± 1.1 102 ± 4.2
Overall mean 97.3 ± 5.9 97.0 ± 9.6 97.4 ± 5.8 101 ± 4.2
8-MOP: 8-methoxypsoralen.
Table 2. Analytical parameters of merit of the implemented spectro-luorimetric method
Parameter Result
Regression linea y = 0.6048x + 3.050
Coeficient of determinationa (R2) 0.9996
Linear range / (ng mL-1) 40 to 1400
Limit of detectionb / (ng mL-1) 12
Limit of quantiicationb / (ng mL-1) 40
Repeatability (RSD, n = 9) / % better than 3.2 Intermediate precision (RSD, n = 6
in 2 days) / %
better than 4.8
Robustness pH 3.0-8.0
solutions prepared in ethanol/water in the proportions between 40/60
and 20/80 v/v
Recoveryc (n = 3) / % 88.5-108
aAverage of 3 curves, y = luorescence intensity, x = [8-MOP; ng mL-1]; bcalculated according to the 3s
b/m and 10sb/m criteria; crange recovery
obtained for the spiked samples (hard capsules and topical creams).
Figure 6. Typical excitation and emission spectra obtained in the optimized conditions of (a) 100 ng mL-1 8-MOP standard solution; (b) cream sample
(theoretical concentration of 400 ng mL-1 to 8-MOP), after extraction procedures; (c) cream sample spiked with 100 ng mL-1 8-MOP standard solution,
after extraction procedures; (d) hard capsule sample (theoretical concentration of 600 ng mL-1 to 8-MOP), after extraction procedures; (e) hard capsule
sample spiked with 100 ng mL-1 8-MOP standard solution, after extraction procedures. Their respective blank signals are not signiicant in the maximum
wavelengths. Measurement conditions are the same as the Figure 5.
the spectrophotometric method described in Brazilian Pharmacopoeia.15 The indicated concentration for 8-MOP
shows a low sensitivity of this technique when compared to the work range on spectroluorimetry (40 to 1400 ng mL-1).
The high fluorescence capacity of 8-MOP ensured selectivity to this drug in the different formulations tested, while the oficial method is suitable only for raw materials. Moreover, the oficial method requires 100% of organic solvents while the spectroluorimetric method uses 70% of water in the preparation of solutions. To quantify 8-MOP in medicines, the use of separation techniques, such as HPLC, is recommended. According to the American Pharmacopoeia,16 the concentration of 8-MOP must be at
least 4 µg mL-1 for measurement by HPLC-UV. Moreover,
this technique is more expensive when compared to the other two (spectroluorimetry and spectrophotometry), making it less attractive for compounding pharmacies routine. It consumes not only ethanol and water as well as acetonitrile and internal standard (trioxsalen).
Method application
The applicability of the method was conducted through studies of assay and uniformity of content in random samples from three different compounding pharmacies that were analyzed by the proposed method. However, to the study of the uniformity of content, the average weight was also evaluated.
Assay of manipulated hard capsules containing 10 mg of 8-MOP
After following the procedures (described in Experimental section, Procedures for determination of 8-MOP in hard capsules sub-section), the results of the assay (blend of ive units) for the manipulated hard capsules (declared value of 10 mg for 8-MOP) from CP-1, CP-2 and CP-3 indicated, respectively, 90.35 ± 0.57, 62.64 ± 3.18 and 98.94 ± 0.93% of the active ingredient content (mean + standard deviation; n = 6). According to the American Pharmacopoeia, methoxsalen content in capsules must be between 90 and 110% of the declared value.16 So,
in the case of CP-2, 8-MOP content was lower than the expected, suggesting that it may inluence the therapeutic eficacy of the treatment.
Average weight and UC in manipulated hard capsules containing 10 mg of 8-MOP
According to the fifth edition of the Brazilian Pharmacopoeia,23 the speciied limits for the standard
deviation related to the average weight of capsules are ± 10.0% for those below 300 mg and ± 7.5% for those
equal to or greater than 300 mg. No more than two units must be outside these limits and no capsule should be above or below twice these speciied percentages. Table 3 shows that CP-1 and CP-3 had average weights (n = 20) below 300 mg and a RSD lower than 10%. For CP-1, no capsule was outside of the limit (± 10.0%), while for CP-3 only one capsule was outside this limit and no unit above or below 20%. Therefore, both are in accordance with the Pharmacopoeia standards. Nevertheless, the average weight (n = 20) of CP-2 hard capsules was above 500 mg with a RSD greater than 7.5% (50% of the samples were outside this limit), indicating that CP-2 does not meet the parameters laid down in legislation.
Also according to the ifth edition of the Brazilian Pharmacopoeia,23 the product fulills the uniformity of
content test if the acceptance value (AV) calculated for the irst 10 units tested is not greater than the limit of 15.0 (L1). Besides that, the quantity of the active component in any individual dose must not be lower or higher than (1 ± L2 × 0.01)M, where the limit L2 = 25 and M varies as indicated in Table 2 notes. The results of hard capsules samples from CP-1 showed concordance with the limits established by the consulted pharmacopoeia, presenting AV < 15 and no unit outside the limits 73.88 and 123.12%. The indicated deviation from quality for CP-2 (AV = 63.4) and CP-3 (AV = 64.9) was based on the analysis of 10 units, but the acceptance value should be calculated to another 20 capsules for disapproval of the batch.
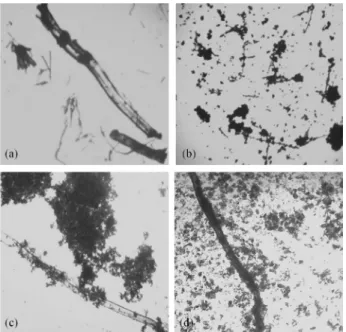
Although approved in the assay test (98.94%), the uniformity of content (measured in 10 capsules individually) for CP-3 was not satisfactory (AV > 15). This result indicated that this pharmacy had a problem in the mixing process of the active ingredient with the excipients for powder preparation, what caused non-uniformity in the capsules content of the same batch. The geometric dilution technique is widely used in compounding pharmacies to ensure greater uniformity of drugs mixed with excipients. Therefore, all components of the mixture must be in the same shape and size to facilitate mixing. The use of 8-MOP in the form of needle crystals, for example, may hinder the uniform distribution of the drug in the powder mixture. Optical microscopy images of the 8-MOP crystals in standard and capsules (CP-1, CP-2, CP-3) are shown in Figure 7. In the CP-2 and CP-3 capsules, intact crystals of 8-MOP were found, indicating the absence of adequate crushing and homogenization prior to the naked eye. In CP-1 capsules, very small fragments of needle crystals of 8-MOP were microscopically observed, making possible a more eficient distribution of the drug in the carrier.
formulations and, consequently, to evaluate the quality of the compounding pharmacies.
Assay of manipulated creams (0.1% m/m 8-MOP)
Cream is a semisolid pharmaceutical form consisting of an emulsion, comprising a lipophilic phase, and a hydrophilic phase. As it is a thermodynamically unstable system, it is necessary to use one or more emulsifying agents to ensure stability during the shelf life. The use of ionic surfactants in this kind of formulation makes it sensitive to changes in the ionic strength in the middle (caused by the use of strong electrolytes, e.g.), inluencing the electrostatic interactions present in the emulsions. Thus, the use of concentrated salt solution (KCl, e.g.) reduces the concentration of organic substances (lipids, e.g.) in the polar medium, separating the fatty phase from the emulsion (salting-out effect).33,34
In this work, the cleaning process of the matrix using the addition of 1.0 mol L-1 KCl favored the separation of the
Table 3. Determination of average weight (n = 20) and uniformity of content (n = 10) of hard capsules containing 10 mg of 8-MOP, purchased from three different compounding pharmacies (CP-1; CP-2; CP-3)
CP-1 CP-2 CP-3
Average weight / mg Uniformity of content / % Average weight / mg Uniformity of content / % Average weight / mg Uniformity of content / %
216.00 110.33 636.61a 102.51 177.57 81.99
224.96 102.47 550.87 67.50 163.51 47.66
210.26 90.58 486.29a 104.10 175.66 49.44
214.21 97.60 520.81a 68.30 171.28 75.62
221.03 100.62 519.15a 57.09 172.31 100.85
228.94 96.20 604.80 118.60 188.50 67.83
216.99 98.09 575.93 65.90 164.56 67.84
208.08 94.01 627.84a 80.10 171.08 66.44
208.80 102.87 582.83 105.82 166.83 72.40
208.24 101.23 619.64a 85.78 185.76 71.13
220.17 572.43 163.53
211.27 517.13a 164.23
217.47 627.83a 179.03
213.27 532.53 175.33
212.67 486.63a 179.43
215.07 533.73 168.73
207.27 588.53 177.73
220.97 511.83a 195.93a
210.57 603.33 171.33
218.67 622.43 159.33
Average 215.24 99.42 566.06 85.57 173.58 70.12
RSDb / % 2.76 5.44 8.80 24.58 5.35 21.67
AVc − 13.0 − 63.4 − 64.9
aUnits outside the range speciied by legislation for average weight; brelative standard deviation; cAV = |M − X| + ks, where: AV = acceptance value,
X = content uniformity’s average, k = 2.4 = acceptability constant for n = 10, s = standard deviation, M = X when 98.5% ≤ X ≤ 101.5%, M = 98.5% when X < 98.5%, M = 101.5% when X > 101.5%.
fatty material presents in the creams (Experimental section, Procedures for determination of 8-MOP in topical creams sub-section); and a limpid fraction, ideal for luorescence measurements, was obtained. Thus, the limpid extract (water-alcohol fraction) obtained with the use of KCl to break the emulsion led to results that indicated that there were no potential interfering substances that could inluence in the luorescence signals of 8-MOP in their wavelengths of excitation and emission (305/495 nm). Recovery studies and Figure 6 corroborate this information.
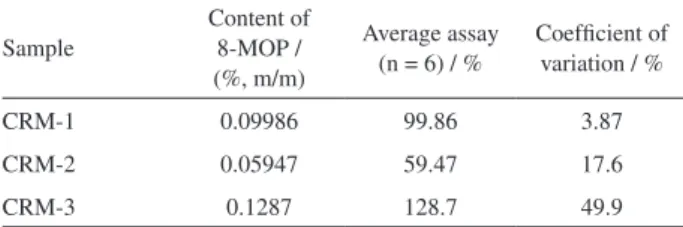
The 8-MOP content determined for semisolid pharmaceutical preparations in each of the three pharmacies are summarized in Table 3. Considering the limits for the assay of 8-MOP in capsules (90-110%),16 the average
value of drug content obtained for the CRM-1 is within the speciications (99.86%). However, the content of the drug present in the cream of pharmacies 2 and 3 (CRM-2 and CRM-3) were both outside the speciications (Table 4).
The values found for CRM-2 and CRM-3 indicated the lack of technical quality in the drug incorporation process in their respective base creams. The inhomogeneity of the two formulations could be conirmed from portions taken in different points of each sample, which indicated high values of RSD (Table 4).
Conclusions
The spectroluorimetry was applied to the implementation of a method for direct determination of 8-MOP in pharmaceutical formulations, without any derivatization reaction or use of chromophore reagents, due to the intrinsic luminescence characteristics of the molecule.
The method showed a wide range of linearity, with appropriate LOQ for the method purposes. The results also indicated good accuracy and precision of the method, and achieved good recovery to 8-MOP in solid and semisolid manipulated pharmaceutical formulations.
Moreover, the use of this methodology in assessing the quality of manipulated formulations indicated that two of the three tested pharmacies showed some non-compliance results. This suggests the disobedience of the principles
of good manufacturing practices and the need for more rigorous control on practices of preparation of medicines in these establishments.
The simplicity and low-cost of the method, with no need of costly high-purity HPLC-grade solvents, ilters and columns, suggests that it can be employed as good alternative for pharmaceutical analysis for quality control of medicines containing 8-MOP.
Acknowledgments
The authors thank FAPERJ, CNPq and PROPPi-UFF for grants that supported this study, and also Annibal Duarte Pereira Netto (UFF) and Otávio Versiane Cabral (IFRJ) for technical support. F. F. C. M. thanks FAPERJ for an individual research grant.
References
1. Agostinho, K. M.; Cavalcante, K. M. H.; Cavalcanti, P. P.; Pereira, D. L.; Cogitare Enferm. 2013, 18, 715.
2. Taborda, M. L.; Weber, M. B.; Teixeira, K. A. M.; Lisboa, A. P.; Welter, E. Q.; An. Bras. Dermatol. 2010, 85, 52.
3. Duarte, I.; Buense, R.; Kobata, C.; An. Bras. Dermatol. 2006,
81, 74.
4. Raut, A. S.; Prabhu, R. H.; Patravale, V. B.; Crit. Rev. Ther. Drug Carrier Syst.2013, 30, 183.
5. Singh, S.; Khandpur, S.; Sharma, V. K.; Ramam, M.; J. Eur. Acad. Dermatol. Venereol.2013, 27, 1344.
6. Gilchrest, B. A.; Parrish, J. A.; Takenraum, L.; Haynes, H. A.; Fitzpatrick, T. H.; Cancer Treat. Rep. 1979, 63, 663.
7. Bulat, V.; Situm, M.; Dediol, I.; Ljubicic, I.; Bradic, L.; Coll. Antropol. 2011, 35, 147.
8. Spark, M. J.; Maturitas 2014, 78, 239.
9. Agência Nacional de Vigilância Sanitária (ANVISA); Resolução No. 67 de 8 de outubro de 2007, Dispõe sobre Boas Práticas de Manipulação de Preparações Magistrais e Oficinais para
Uso Humano em Farmácias;Diário Oicial da União No. 195: Brasília, 2007, p. 29.
10. Agência Nacional de Vigilância Sanitária (ANVISA); Resolução No. 87 de 21 de novembro de 2008, Altera o Regulamento Técnico sobre as Boas Práticas de Manipulação
em Farmácias; Diário Oicial da União No. 228: Brasília, 2008,
seção 1, p. 58.
11. Polonini, H. C.; dos Santos, F. C.; Vaz, U. P.; Brandão, M. A. F.; Raposo, N. R. B.; Ferreira, A. O.; Quim. Nova2011, 34, 516.
12. D’Hondt, M.; Wynendaele, E.; Vandercruyssen, K.; Bauters, T.; Vandenbroucke, J.; Mullens, S.; Vervaet, C.; Remond, J. P.; de Spiegeleer,B.; J. Pharm. Biomed. Anal.2014, 96, 68. Table 4. Assay of 8-MOP in handled topical creams (CRM) with declared
content of 0.1% m/m
Sample
Content of 8-MOP / (%, m/m)
Average assay (n = 6) / %
Coeficient of variation / %
CRM-1 0.09986 99.86 3.87
CRM-2 0.05947 59.47 17.6
CRM-3 0.1287 128.7 49.9
13. Mahaguna, V.; McDermott, J. M.; Zhang, F.; Ochoa, F.; Drug Dev. Ind. Pharm.2004, 30, 1069.
14. Guimarães, S. S.; Sousa, G. D.; de Melo, E. K. S.; de Albuquerque, M. M.; Leal, L. B.; de Santana, D. P.; Rev. Cienc. Farm. Basica Apl.2014, 35, 75.
15. Farmacopeia Brasileira, 3rd ed.; Atheneu: São Paulo, Brasil, 1977.
16. The United States Pharmacopeia, US Phamacopeia 35, The United States Pharmacopeial Convention: Rockville, 2012. 17. Vo-Dinh, T.; White, D. A.; O’Malley, M. A.; Seligman, P. J.;
Beier, R. C.; J. Agric. Food Chem. 1988, 36, 333.
18. Yanga, W.; Fenga, C.; Konga, D.; Shi, X.; Cui, Y.; Liua, M.; Wanga, Q.; Wang, Y.; Zhanga, L.; J. Chromatogr. B: Anal. Technol. Biomed. Life Sci.2010, 878, 575.
19. Harsahay, M.; Hemant Kr, P.; Aarti, M.; Mohd,N.; Int. J. Pharmacogn. Phytochem. Res. 2014, 6, 290.
20. Kucová, D.; Marisková, D.; Davídková, P.; Gasparic, J.;
J. Chromatogr. B: Biomed. Sci. Appl.1993, 614, 340.
21. Wang, L.-H.; Tso, M.; J. Pharm. Biomed. Anal.2002, 30, 593. 22. Said, A.; Makki, S.; Muret, P.; Toubin, G.; Humbert,P.; Milet,
J.; Exp. Dermatol.1997, 6, 57.
23. Farmacopeia Brasileira, Part 1, 5th ed.; Fiocruz: Brasília, Brasil, 2010.
24. Guilbault, G. G.; Practical Fluorescence, 2nd ed.; Marcel Dekker: New York, 1990.
25. Schulman, S. G.; Molecular Luminescence Spectroscopy: Methods & Applications-Part I; John Wiley & Sons: New York, 1988.
26. Bolinová, P.; Šrámková, I.; Sklená ová, H.; Acebal, C. C.; Fernández B. S.; Solich, P.; Anal. Methods2014,6, 9392.
27. Marques, F. F. C.; da Cunha, A. L. M. C.; Aucélio, R. Q.; Anal. Lett.2010, 43, 520.
28. Lai, T. I.; Lim, B. T.; Lim, E. C.; J. Am. Chem. Soc. 1982, 104, 7631.
29. Miller, J. N.; TrAC, Trends Anal. Chem.1981, 1, 31.
30. Bajaj, S.; Singla, D.; Sakhuja, N.; J. Appl. Pharm. Sci. 2012,
2, 129.
31. Agência Nacional de Vigilância Sanitária (ANVISA); Resolução No. 899 de 29 de maio de 2003, Guia para Validação de Métodos Analíticos e Bioanalíticos; Diário Oicial da União:
Brasília, 2003.
32. International Conference on Harmonization of Technical Requirements for Registration of Pharmaceuticals for Human Use (ICH); Validation of Analytical Procedures: Text and Methodology, Q2(R1); ICH: London, 2005.
33. Kundu, P.; Agrawal, A.; Mateen, H.; Mishra, I. M.; Chem. Eng. Sci. 2013, 102, 176.
34. Franzol, A.; Rezende, M. C.; Polímeros2015, 25, 1.
Submitted: May 27, 2016