Ethanol during adolescence decreased the BDNF levels in
the hippocampus in adult male Wistar rats, but did not alter
aggressive and anxiety-like behaviors
O etanol durante a adolescência reduziu os níveis de BDNF no hipocampo de
ratos Wistar machos adultos, mas não alterou os comportamentos agressivos e
a ansiedade
Letícia Scheidt,1 Gabriel Rodrigo Fries,2 Laura Stertz,2 João Carlos Centurion Cabral,1 Flávio Kapczinski,2
Rosa Maria Martins de Almeida1
Abstract
Objective: To investigate the effects of ethanol exposure in adolescent rats during adulthood by assesssing aggression and
anxiety-like behaviors and measuring the levels of inlammatory
markers.
Methods: Groups of male Wistar rats (mean weight 81.4 g, n = 36) were housed in groups of four until postnatal day (PND) 60. From PNDs 30 to 46, rats received one of three treatments: 3 g/kg of ethanol (15% w/v, orally, n = 16), 1.5 g/kg of ethanol (12.5% w/v, PO, n = 12), or water (n = 12) every 48 hours. Animals were assessed for aggressive behavior (resident x intruder test) and anxiety-like behaviors (elevated plus maze) during adulthood. Results: Animals that received low doses of alcohol showed re-duced levels of brain-derived neurotrophic factor (BDNF) in the
hippocampus as compared to the control group. No signiicant
difference was found in prefrontal cortex.
Conclusions: Intermittent exposure to alcohol during adoles-cence is associated with lower levels of BDNF in the hippocam-pus, probably due the episodic administration of alcohol, but al-cohol use did not alter the level agression toward a male intruder or anxiety-like behaviors during the adult phase.
Keywords: Adolescence, alcohol abuse, aggression, anxiety, brain-derived neurotrophic factor.
Resumo
Objetivo: Investigar os efeitos da exposição ao etanol em ratos adolescentes durante a idade adulta sobre os comportamentos agressivos e semelhantes à ansiedade, bem como sobre as
me-didas de níveis de marcadores inlamatórios.
Métodos: Os grupos de ratos Wistar machos (peso médio de 81,4 g; n = 36) foram alojados em grupos de quatro até o dia pós-natal (DPN) 60. Entre os DPNs 30 e 46, os ratos receberam um dos três tratamentos: 3 g/kg de etanol (15% w/v, oralmente, n = 16), 1.5 g/kg de etanol (12,5% w/v, oralmente, n = 12), ou água (n = 12) a cada 48 horas. Os comportamentos agressivos (teste residente--intruso) e semelhantes à ansiedade (labirinto em cruz elevado) foram avaliados durante a idade adulta dos animais.
Resultados: Os animais que receberam doses menores de álcool
mostraram níveis reduzidos de fator neurotróico derivado do cére -bro (BDNF) no hipocampo quando comparados ao grupo controle.
Nenhuma diferença signiicativa foi veriicada no córtex pré-frontal.
Conclusões: A exposição intermitente ao álcool durante a ado-lescência é associada com menores níveis de BDNF no hipocampo, provavelmente divido a administração episódica de álcool, mas o uso não alterou o nível de agressão contra o macho intruso ou os comportamentos semelhantes à ansiedade durante a fase adulta. Descritores: Adolescência, abuso de álcool, agressão,
ansieda-de, fator neurotróico derivado do cérebro.
1 Institute of Psychology, Universidade Federal do Rio Grande do Sul (UFRGS), Porto Alegre, RS, Brazil. Laboratory of Experimental Psychology, Neurosciences,
and Behavior (LPNeC), UFRGS, Porto Alegre, RS, Brazil. 2 Molecular Psychiatry Laboratory, National Institute for Translational Medicine, Hospital de Clínicas de
Porto Alegre (HCPA), UFRGS, Porto Alegre, RS, Brazil.
Financial support: Conselho Nacional de Desenvolvimento Cientíico e Tecnológico (CNPq). Gabriel Rodrigo Fries, Flávio Kapczinski, and Rosa Maria Martins
de Almeida are CNPq research fellows. Letícia Scheidt, Laura Stertz, and João Carlos Centurion Cabral are graduate scholarship recipients from CNPq or Coordenação de Aperfeiçoamento de Pessoal de Nível Superior (CAPES).
Submitted Mar 25 2015, accepted for publication Jul 21 2015. No conlicts of interest declared concerning the publication of this article.
Introduction
Adolescence is usually considered to extend from 12 to 20 or 25 years of age in humans and to cover
the period of 28 to 42 postnatal days (PND) in rats.1
This phase can be characterized in terms of a behavioral tendency to higher levels of risk exposure, increased exploratory behavior, novelty and seeking sensation,
social interaction, and high motor activity.2 These
features are evolutionarily important to promote maturation and independence skills for adulthood, and in different species. Mice are at 21 days of age when they are able to avoid predators, locate food sources,
and establish a domestic territory.3
The adolescent brain undergoes a transition, including its maturation and changes in a variety of systems, from the molecular composition and sensitivity of receptors to neurotransmitters to more global changes in the volume of the prefrontal cortex (PFC), declining during adolescence both in humans and in rats. There are also changes in the number of synapses, the levels of dopaminergic and cholinergic innervation, as well as
modiications in a variety of brain regions.4 Therefore,
the adolescent brain is different from the adult, and adolescents also differ in their response to ethanol. Adolescent rats are less sensitive to the sedative effects
of ethanol, with a rapid and acute tolerance.5
Brain damage induced by binge drinking leads to the development of tolerance and dependence that later on promotes overconsumption, but is also associated with
changes in brain physiology, structure and function.6
In animal models, damages appear to be greater in adolescent than in adult brains, particularly in learning
and memory processes.2
There is recognized importance of hippocampal neurogenesis in learning and memory as well as in affective and mood states. One study indicated that adolescents present higher levels of neurogenesis in the hippocampus, which is also very sensitive to
alcohol-induced inhibition.4 Likewise, the consumption of a high
number of alcoholic drinks per episode seems to be correlated to a smaller volume of the PFC. Social drinkers who consume alcoholic drinks more heavily were found to have a more negative mood and poorer performance
on tasks of executive functions.7
Alcohol abuse has dramatic health effects. Cytokine levels have been related to the pathogenesis
of numerous disorders, inlammatory diseases, and
psychological ilnesses such as mood disorders.8
The tumor necrosis factor alpha (TNF-α) is a pro-inlammatory cytokine, i.e., its increase indicates
an inlammation in the body.9 Interleukin-10 (IL-10)
is an anti-inlammatory cytokine secreted by type
2 T helper lymphocytes that regulates the immune
system and inhibits allergic reactions.10 The cytokine
interleukin-1 (IL-1) is a potent defender of the host against infection and damage, both inside and outside the central nervous system (CNS), participating in the
maintenance of inlammatory response.11
Recognition of the involvement of neuroimmune activation in chronic alcohol exposure-induced
damage is relatively recent.12 The model of binge
drinking shows that alcohol-induced degeneration occurs probably due to inhibition of multiple factors related to cell generation, cellular atrophy, and cell death. Experiments have shown that alcohol alters the
balance of pro-inlammatory vs. pro-survival signaling
during intoxication. Ethanol promotes the activation of
the nuclear transcription factor κB (NF-kB), as well as increases the levels of pro-inlammatory cytokines and
oxidative stress. Ethanol also promotes a reduction in the levels of pCREB (a transcription factor, cAMP-responsive element binding protein), ultimately
sensitizing neurons to damage by inluencing the
loss of neurogenesis.6 Human alcoholics present
increased levels of brain cytokines and markers of microglia, which are consistent with these processes and therefore contribute to the loss of gray and white
matter, as well as to cognitive dysfunction.12
Despite the high prevalence of use and abuse of alcohol and related disorders in adolescence, understanding of the effects of consumption at an early age on brain development and cognition is just beginning. Understanding brain responses to ethanol in this age group is important precisely because it is
the period in which individuals usually start drinking.13
Although there are legal restrictions on the use of alcohol by adolescents, these practices are quite common and
largely uncontrolled.14
The aims of this study were to investigate the effects of ethanol exposure in adolescent rats and assess aggression and anxiety-like behaviors. Moreover, we also assessed the levels of brain-derived neurotrophic factor
(BDNF), IL-1α, IL-10 and TNF-α in PFC and hippocampus
during adulthood.
Methods
This experimental study was conducted to compare experimental groups with different doses of ethanol (E10 and E30) and a control group with regard to aggression
and anxiety-like behaviors and inlammatory activity
instead of intraperitoneal injections. Animals received either doses of 15% (w/v), 3.0 g/kg ethanol (95% EtOH) diluted in water (group E30); 5% (w/v), 1.0 g/kg of ethanol diluted in water (group E10); or just water (control group) every 48 hours, totaling eight administrations per animal. The solution was applied with a gavage. The animals were weighed immediately before each exposure for the accurate calculation of the quantity by weight. This model is intended to simulate a consumption pattern characterized by intermittent use at high doses, common in adolescent binge drinking
behavior.15 Procedures are shown in Figure 1.
Behavioral tests
Risk behavior and anxiety
Risk and anxiety behaviors were assessed using the elevated plus maze (EPM), which consisted of a wooden apparatus with four arms (50 x 10 cm), two open and two closed. The sides of the latter are closed by walls measuring 40 cm in height. The apparatus is elevated 50
cm from the ground.16,17
Animals were tested with the EPM between PNDs
64 and 65.18 In a single exposure, the rats were placed
individually in the center of the maze facing one of the open arms. The activity of the animal in the maze was examined by the number of entries into the open and closed arms and by the time spent in each arm for a period of 5 minutes. An entry was counted when the animal placed all four paws on one arm. After removal of each rat, the apparatus was cleaned and disinfected prior to testing the next animal. The experiment was recorded with a camera mounted about one meter above the apparatus.
Animals
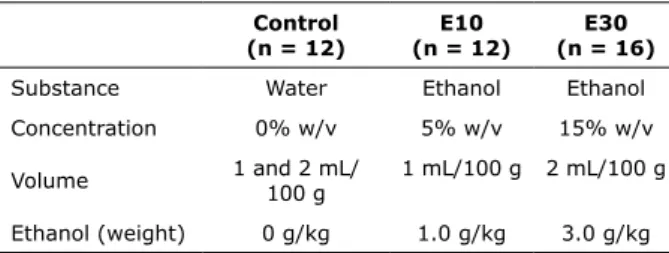
Forty male Wistar rats aged 21 days were housed in the Animal Research Unit of the Hospital de Clinicas de Porto Alegre (HCPA), under a 12 h light/dark cycle, with controlled ambient temperature (20-22 ºC) and relative humidity (40-60%). Animals were housed in groups of four rats per cage in polyurethane boxes measuring 24 cm in width, 38 cm in length, and 15 cm in height. After an acclimatization period of 7 days in the vivarium, animals were assigned to treatment groups (E10, E30, and control) (Table 1). All animals weighed between 63 and 96 g on PND 28 and received chow and drinking water without restriction throughout the experiment.
Procedures
After the assignment of subjects to groups, an intermittent exposure to ethanol was performed from the PNDs 30 to 46. The protocol was based on the one
proposed by Pascual et al.,15 however using gavage
Control (n = 12)
E10 (n = 12)
E30 (n = 16)
Substance Water Ethanol Ethanol
Concentration 0% w/v 5% w/v 15% w/v
Volume 1 and 2 mL/ 100 g 1 mL/100 g 2 mL/100 g
Ethanol (weight) 0 g/kg 1.0 g/kg 3.0 g/kg Table 1 - Division of the experimental groups according to
the administration of ethanol by gavage
Figure 1 - Flowchart of study procedures, covering the arrival of the animals at the AEU, their acclimatization, their division into three groups, ethanol administration, behavioral tests, and brain analysis. BDNF = brain-derived neurotrophic factor; EPM =
elevated plus maze; IL-1α = interleukin 1 alpha; IL-10 = interleukin 10; PFC = prefrontal cortex; PND = postnatal day; TNF-α =
tumor necrosis factor alpha; AEU = animal experimentation unit. Arriving at AEU
(PND 21)
Ethanol administration
(PND 30-46)
Collection of PFC and hippocampus
(PND 134)
Protein determination EPM
(PND 64-65) Acclimatization
(PND 21-28)
Animal groups Isolation
(PND 71-111) Intruder (PND 32)
Aggression protocol (PND 71-111) Control E10 E30
BDNF TNF-α
Subsequently, a trained observer analyzed behaviors shown in the recordings, in addition to two judges who analyzed videos of animals drawn. Latency, frequency and duration of each of the following behaviors were calculated: 1) aggressive elements: bite the intruder (bite attack), sideways threat, side posture submission with two legs (pin), nips, and persecution (pursuits); 2) non-aggressive elements: grooming, walking, standing
up (rearing), scanning, and snifing.
Collection of tissues
At the end of the aggression protocol, control and
experimental animals were sacriiced by decapitation.
Brains were immediately dissected on ice and the PFC and hippocampus structures were collected, frozen in isopentane cooled in dry ice, and stored at -80 ºC.
Protein determination
Determination of cytokines and BDNF was performed at the Laboratory of Molecular Psychiatry, HCPA, UFRGS, Brazil. Levels of cytokines in tissues were measured by cytometric bead array (CBA), using the following
kits: BD™ Rat IL-1α CBA Flex Set, BD™ Rat CBA Flex
Set IL-10, and BD™ CBA Flex Set Rat Serum TNF (BD Biosciences). Tissues were initially homogenized in 150
μL of buffer, which was followed by centrifugation and
storage of the supernatant. Afterward, samples were incubated with capture beads labeled with antibodies
speciic for the respective cytokines to be measured,
followed by the incubation with detection antibodies labeled with phycoerythrin (PE). After incubations, 1 mL of wash solution (Wash Acquire) was added, samples were centrifuged for 10 minutes at 1,000 rpm, the supernatant was discarded, and the samples were
suspended for low cytometer analysis. The results were
generated in graphical and tabular forms using BD CBA FCAP Array Software™ (BD Biosciences, San Diego, USA). Total protein concentration in the extract was
evaluated by the Bradford22 method. BDNF levels were
measured by a sandwich ELISA kit (Millipore), according to the manufacturer’s instructions.
Data analysis
Comparisons between groups were performed
assuming a signiicance level of 0.05. The EPM protocol
was subjected to analysis of variance (ANOVA) to the percentage and duration of entries into the open arms. Principal component analysis (PCA) was performed
to extract ive factors related to anxiety and risk
behavior, as suggested by Cruz et al.16 To consider
After training, two observers reviewed videorecordings and analyzed the following behaviors, according to Walf
& Frye,18 Toledo-Rodriguez & Sandi,19 and Robert et al.20:
- Behavior of the anxious type: latency, total time and number of entries into the closed arms;
- Behavior of non-anxious type: latency, total time and number of entries into the open arms;
- Risk-taking behavior/risk assessment: latency, frequency and duration of the stretching behavior (when the rodent puts his head out of the closed arm, investigating the environment); latency, frequency and duration of head dips (when the rodent extends his head beyond the limits of the open arm);
- Other: latency, frequency and duration of grooming (self-cleaning behavior), latency, frequency and duration of rearing (when the rodent stands vertically on two hindlegs).
Aggression test
To perform the assessment of aggressive behavior, animals were placed in individual transparent boxes and visually isolated by partitioning between boxes. The isolation period was between PNDs 71 and 111, totaling 40 days. The isolation is required for the animal to express more aggressive behavior repertoire to
interact with intruders. Thirty-ive animals of 32 days
of age were used as intruders, in confrontation with the residents. These were used alternately, with no resident-intruder pair being repeated throughout the interactions.
The protocol used for the experiment was based on
the aggression assessment proposed by Miczek.21 On
the PND 112, interactions began. An attacker animal, which resided with another group of animals, was placed in the transparent box-dwelling of each rat treated or not with ethanol during adolescence. The experiment was conducted during the dark cycle, twice a week, over four weeks, totalling seven events. Each exposure was recorded with an infrared device installed in front of the box and engraved with Windows Movie Maker. Interactions were held concurrently for four different teams, with four pairs of animals. Intruders were marked throughout the body to facilitate visualization and differentiation of resident crew.
The interaction time was 10 minutes from the
irst bite by the resident toward the intruder. In the
absence of attacks the experiment was terminated 10 minutes after introduction of the animal in the box. If the intruder had bitten the resident only after being attacked, the experiment was performed as normal. However, if the intruder had exhibited biting behavior
ive scores. The load of each behavioral parameter provides an estimate of how much the variable relects a factor; a value of 1.0 indicates perfect relection, while a load of < 0.4 indicates poor relection. The factors extracted from this analysis are independent and relect
different processes, explaining 84.9% of the variance. Table 2 shows the grouping of variables by factor.
Factor 1 adds variables related to risk exposure (duration and number of entries into open arms, duration and number of head dips). Factor 2 adds variables related to grooming. The third factor relates to stretching behavior (assessing risk). The factor 4 comes to anxious behaviors related to time spent in the closed arms. And the factor 5 groups duration and frequency of rearing).
After normalizing and transforming data, groups were compared by one-way ANOVA, using the factors like
anxiety scores from the PCA. No statistically signiicant
difference was found (factor 1, F = 1.09, p = 0.35; factor 2, F = 1.63, p = 0.21; factor 3, F = 0.19, p = 0.82).
Based on the work by Cruz et al.,16 an ANOVA was
also performed to assess differences between groups, E10 and E30, regarding the percentage of entries (F = 2.04, p = 0.14) and the percentage of time spent in the open arms (F = 1.04, p = 0.36) relative to the total frequency (F = 0.84, p = 0.92), but no statistically
signiicant differences were found. In addition to the
frequency and duration, an analysis of variance for the variables of latency to the expression of behavior was performed. Data of entries into closed and open arms (F = 0.46, p = 0.63 and F = 2.38, p = 0.11 respectively), stretching (F = 1.07, p = 0.35), head dipping (F = 1.78, p = 0.18), grooming (F = 0.24, p = 0.79), and rearing
(F = 0.98, p = 0.38) were not statistically signiicant.
the level of aggressiveness integrating variables, we
used the formula described by de Almeida et al.23 for
the measurement of total aggression: the sum of the frequency of aggressive acts (bites, sideways threats, pin, and nip) plus the duration of aggressive postures (sideways threats and pin). From this measurement, the animals were divided into two groups: very aggressive and less aggressive. In one analysis, we used only data from the last three days of the aggression protocol, because, given the fact that the Wistar species is
typically aggressive, the irst interactions could be
considered training and encouragement to aggressive behavior. These interactions, however, were also taken into account in the analysis of variance for repeated measures to observe the changes in the levels of aggression throughout the seven test trials in resident-intruder protocol for each resident animal.
Biochemical data showed non-normal distribution and were transformed using logarithmic function and excluding outliers in order to normalize and thus carry out parametric analysis. Two different formulas were
used: -1 * log (y) for TNF-α and IL-10 that did not fall to negative and Ln (y) for IL-1α. Shapiro-Wilk normality test was used to conirm normality. Subsequently,
one-way ANOVA with Dunnett’s post-hoc test was performed.
Results
Anxiety and risk exposure
To analyze the pattern of anxiety due to EPM, a factor
analysis was performed, as proposed Cruz et al.,16 with
the frequency and duration of each behavior generating
Factor 1 2 3 4 5
Duration open arm 0.968
Frequency open arm 0.917
Frequency head dipping 0.905
Duration head dipping 0.872
Duration closed arm -0.622 0.452
Duration grooming 0.883
Frequency grooming 0.876
Duration central square -0.563 0.534
Frequency stretching 0.856
Duration stretching 0.839
Frequency closed arm 0.925
Frequency central square 0.543 0.802
Duration rearing 0.923
Frequency rearing 0.858
the PFC were not signiicantly different between the
groups (F = 2.92, p = 0.07).
The difference in IL-10 concentration in the
hippocampus was not statistically signiicant between the
groups (F = 0.33, p = 0.72). The mean concentrations found were 1.99±0.70 pg/mg for the control group, 1.84±0.18 pg/mg for the E10 group, and 1.91±0.27 pg/ mg for the E30 group, as shown in Figure 2B.
The levels of IL-1α in the PFC showed no signiicant
differences between the groups, F = 3.01 (p = 0.06). Mean concentration was 1.58±0.34 pg/mg in the control group, 1.89±0.31 pg/mg in the E10 group, and 1.65±0.28 pg/mg in the E30 group.
The concentration of IL-1α in the hippocampus showed no signiicant differences among groups (F =
2.63, p = 0.09). Mean concentration was 1.59±0.34 pg/mg in the control group; 1.66±0.23 pg/mg in the E10 group; and 1.40±0.26 pg/mg in the E30 group, as shown in Figure 2C.
Mean BDNF concentrationin PFC were the following: 0.26±0.08 pg/mg in the control group, 0.25±0.19 pg/ mg in the E10 group, and 0.23±0.09 pg/mg in the E30
group. The presence of BDNF in PFC was not signiicantly
different between the groups (F = 0.12, p = 0.89). Regarding the presence of BDNF in the hippocampus, a mean of 0.57±0.19 pg/mg was found in the control group, 0.38±0.15 pg/mg in the E10 group, and 0.54±0.19 pg/mg in the E30 group. The concentration of BDNF in hippocampus showed a
signiicant difference among the groups (F = 3.32, p
= 0.048). The Dunnett post-hoc test showed that this
difference was signiicant between control and E10
groups (mean = 0.19), but not between control and E30 groups (mean = 0.03). Therefore, BDNF levels
were signiicantly higher in the hippocampus of the
control group (0.57 pg/mg) in comparison to the E10 group (0.38 pg/mg), but not in comparison to the E30 (0.54 pg/mg), as shown in Figure 2D.
Aggression analysis
For calculation of aggression, using the formula described – sum of frequencies (bites, sideways threats, pin, and nip) with duration (sideways threats and pin) –only the last three tests of the aggression protocol were considered for each animal. Data for the variables that were not normally distributed were normalized and described in mean±standard deviation, with mean standardized score (z score), total sum and sum with
z score at Table 3. This difference was not signiicant.
Based on the level of aggression, animals were divided into two groups: more aggressive and less aggressive for the mean. We analyzed whether any of the groups (E10, E30 or control) was more aggressive,
using the chi-square test, but there was no signiicant
difference between the groups.
Subsequently, repeated measures analysis was performed for the seven test trials of each animal, using the formula of aggression in each time. There was no statistical difference in this analysis.
Cytokines and BDNF
The presence of TNF-α in the PFC showed no signiicant differences among groups (F = 0.51, p =
0.61). Mean concentration was 0.61±0.16 pg/mg in the control group, 0.58±0.18 pg/mg in the E10 group, and 0.66±0.18 pg/mg in the E30 group.
The concentration of TNF-α in the hippocampus showed no signiicant differences among groups (F = 0.64, p =
0.53). Mean concentrations were 0.96±0.16 pg/mg in the control group, 0.92±0.21 pg/mg in the E10 group, and 0.86±0.27 pg/mg in the E30 group, as shown in Figure 2A.
For the IL-10 variable in the PFC, mean concentrations were 1.60±0.48 pg/mg for the control group, 1.25±0.14 pg/mg for the E10 group, and 1.55±0.27 pg/mg for the E30 group. IL-10 levels in
Scores Control (n = 12) E10 (n = 12) E30 (n = 16) F p-value
Total aggression 32.20±12.40 26.14±9.92 31.56±11.81 1.02 0.370
Mean of aggression z score 0.36±3.54 0.47±3.24 0.12±3.03 0.19 0.820
Sum of aggression 96.60±37.22 78.42±29.76 94.69±35.43 1.02 0.370
Table 3 - Total aggression scores: sum of frequencies of aggressive acts (bites, sideways threats pin, and nip) plus duration of aggressive postures (sideways threats and pin)
Figure 2 - IL-10, IL-1α and TNF-α levels measured in the PFC and hippocampus from male Wistar rats.
BDNF = brain-derived neurotrophic factor; IL-1α = interleukin-1 alpha; IL10 = interleukin-10; TNF-α = tumor necrosis factor
alpha; PFC = prefrontal cortex.
Control E10 E30
4
3
2
1
0
p
g
/
u
g
o
f
p
ro
tei
n
IL 10
Control E10 E30
1.0 1.5
0.5
0.0
p
g
/
u
g
o
f
p
ro
tei
n
TNF-α
Control E10 E30
4
3
2
1
0
p
g
/
u
g
o
f
p
ro
tei
n
IL 10
Control E10 E30
1.0 1.5
0.0 0.5
p
g
/
u
g
o
f
p
ro
tei
n
TNF-α
Control E10 E30
3
2
1
0
Control E10 E30 Control
1.0
0.8
0.8
0.4
0.2
0.0
E10 E30
1.0
0.8
0.8
0.4
0.2
0.0
Control E10 E30
3
2
1
0
p
g
/
u
g
o
f
p
ro
tei
n
p
g
/
u
g
o
f
p
ro
tei
n
p
g
/
u
g
o
f
p
ro
tei
n
p
g
/
u
g
o
f
p
ro
tei
n
IL -1α IL -1α
p = 0.04
BDNF
BDNF
PFC
Hippocampus
for the difference of cytokines in the structures is the presence of intervening variables that could not be controlled in the experiment.
Ethanol is known to induce an immune response in the brain, which may contribute to ethanol-induced
neurodegeneration. However, a recent study28 that
investigated the effects of ethanol in aged mice found that ethanol induced chemokine (C-C motif) ligand 2 selectively in the hippocampus and cerebellum but not in the cerebral cortex. Furthermore, ethanol did not
increase IL-6 or TNF-α expression in any of these brain
regions. Indeed, relatively little is known concerning the long-term effects of ethanol on immune activity in the CNS. Moreover, alcohol can increase the immune response in adult more than adolescent CNS. Although several studies have demonstrated the long-term effects of ethanol exposure, mainly prenatal chronic
ethanol exposure,29 data on the long-term effects of
intermittent exposure to alcohol on the adolescent brain are still controversial. Future studies are needed to evaluate the effects of continuous ethanol exposure on different parts of the brain of adult animals treated with ethanol during adolescence.
The most signiicant inding in this study was the
decrease in BDNF concentration in the hippocampus of rats exposed to the intermediate dose of ethanol during adolescence (1 g/kg; 2 mL/100 g) compared to the control group. It is known that BDNF is a regulator of
development, plasticity, and addictive behavior.30 The
literature points out that ethanol-induced decrease in neurotrophic activity in adult brain may be involved in the etiology of developmental disorders related to
alcohol neurodegeneration.31 This happens due to a
decrease in the BDNF expression or due to the inability of the receiver to translate signals in the presence of
ethanol.30 Studies have shown that chronic ethanol
treatment in rats decreases the expression of BDNF in
hippocampus and cortex.32
Apart from the behavioral tests, this study also performed biochemical analyzes to assess the levels of
proinlammatory (TNF-α) and anti-inlammatory (IL-1α
and IL-10) cytokines and BDNF in hippocampus and PFC
structures. Although the literature still identiies many gaps and uncertainties about the inlammatory activity
in the CNS,30 we started with the hypothesis that the
highest dose of alcohol would increase the presence of
proinlammatory cytokines and lower the levels of anti-inlammatory cytokines and BDNF, which would be an
indicator of neurogenic activity and neuroplasticity. Evidence suggests that alcohol use in adolescence is associated with a number of problems, including lower performance on tasks associated with executive
functions, changes in brain structures, inlammatory
Discussion
The present study investigated the relationship between alcohol use in adolescence and aggressive
and anxiety-like behaviors and inlammatory activity
in the CNS in adulthood. The results indicated that the administration of alcohol by gavage during adolescence lead any behaviroal change regarding risk exposure and anxiety-like behaviors . There was a clear dissociation between the behaviors studied, such as aggression and anxiety-like behaviors, and the neurochemistry markers assessed in this study. Of note, alcohol consumption is age-dependent, such that adults are more sensitive than
adolescent rats.24
One possible reason for the initial hypothesis not to have been supported by our results is that alcohol was administered at a time in which possibly the drug is not as harmful to the brain areas related to anxiety and risk behavior. Customarely, the age of adolescence in rats is
deined as the period between PNDs 28 and 42. However,
our gavage protocol was held between PNDs 30 and 46. In addition, the intervals between doses were one to two days, which may have characterized a low frequency of alcohol intake. The amount of ethanol administered
varies for each protocol. Crews & Nixon6 even proposed
a model of binge drinking using 9 g/kg/day ethanol,
although they admit that 5 g/kg/day signiicantly
cause poisoning. However, in the present experiment, the choice of 3 g/kg for reproduction of binge drinking seemed more appropriate due to the ethical care about the safety of animals, taking the possible hepatotoxicity and other side effects of alcohol into account. It is important to consider, however, that dose used in our
study may not have been suficient to cause prolonged
and profound CNS effects.
Another explanation for the lack of statistical
signiicance in the indings is that ethanol administration
by gavage instead of intraperitoneal injections15 may have
generated lower bioavailability25 and might therefore
have been insuficient to generate physiological changes
related to anxious behavior and risk exposure in brain
structures such as PFC.26
One of the major problems in developing a model of drinking behavior in rodents, according to McBride et
al.,27 is that most rodents do not readily and voluntarily
consume ethanol without experimental manipulation. The researchers add that, because of the relatively narrow window of development that characterizes adolescence
in animals, it is very dificult to establish the underlying
behavior of adolescent drinking and its consequences for long-term mechanisms. In the present study, much time has passed between ethanol administration by gavage
involving aquaporin, brain edema, and phospholipase A2 activation. Neurotox Res. 2012;21:70-8.
13. Maggs JL, Schulenberg JE. Initiation and course of alcohol consumption among adolescents and young adults. In: Galanter M, Lowman C, Boyd GM, Faden VB, Witt E, Lagressa D, editors. Recent developments in alcoholism.Volume 17. New York: Kluwer Academic Publishers; 2005. p. 29-47.
14. Perry CL, Williams CL, Komro KA, Veblen-Mortenson S, Forster JL, Bernstein-Lachter R, et al. Project Northland high school interventions: community action to reduce adolescent alcohol use. Health Educ Behav. 2000;27:29-49.
15. Pascual M, Blanco AM, Cauli O, Miñarro J, Guerri C. Intermittent
ethanol exposure induces inlammatory brain damage and
causes long-term behavioural alterations in adolescent rats. Eur J Neurosci. 2007;25:541-50.
16. Cruz AP, Frei F, Graeff FG. Ethopharmacological analysis of rat behavior on the elevated plus-maze. Pharmacol Biochem Behav. 1994;49:171-6.
17. Johnston AL, File SE. Sex differences in animal tests of anxiety. Physiol Behav. 1991;49:245-50.
18. Walf AA, Frye CA. The use of the elevated plus maze as an assay of anxiety-related behavior in rodents. Nat Protoc. 2007;2:322-8. 19. Toledo-Rodriguez M, Sandi C. Stress during adolescence increases
novelty seeking and risk-taking behavior in male and female rats. Front Behav Neurosci. 2011;5:17.
20. Robert G, Drapier D, Bentué-Ferrer D, Renault A, Reymann JM.
Acute and chronic anxiogenic-like response to luoxetine in rats in
the elevated plus-maze: modulation by stressful handling. Behav Brain Res. 2011;220:344-8.
21. Miczek KA. A new test for aggression in rats without aversive stimulation: Differential effects of d-amphetamine and cocaine. Psychopharmacology (Berl). 1979;60:253-9.
22. Bradford MM. A rapid and sensitive method for the quantitation of microgram quantities of protein utilizing the principle of protein-dye binding. Anal Biochem. 1976;72:248-54.
23. de Almeida RM, Benini Q, Betat JS, Hipólide DC, Miczek KA,
Svensson AI. Heightened aggression after chronic lunitrazepam
in male rats: potential links to cortical and caudate-putamen-binding sites. Psychopharmacology (Berl). 2008;197:309-18. 24. Spanagel R, Noori HR, Heilig M. Stress and alcohol interactions:
animal studies and clinical signiicance. Trends Neurosci.
2014;37:219-27.
25. Walker BM, Ehlers CL. Age-related differences in the blood alcohol levels of Wistar rats. Pharmacol Biochem Behav. 2009;91:560-5. 26. Casey BJ, Jones RM. Neurobiology of the adolescent brain and
behavior: implications for substance use disorders. J Am Acad Child Adolesc Psychiatry. 2010;49:1189-201.
27. McBride WJ, Bell RL, Rodd ZA, Strother WN, Murphy JM. Adolescent alcohol drinking and its long-range consequences. In: Galanter M, Lowman C, Boyd GM, Faden VB, Witt E, Lagressa D, editors. Recent developments in alcoholism.Volume 17. New York: Kluwer Academic Publishers; 2005; p. 123-42.
28. Kane CJ, Phelan KD, Douglas JC, Wagoner G, Johnson JW, Xu J, et al. Effects of ethanol on immune response in the brain:
region-speciic changes in aged mice. J Neuroinlammation. 2013;10:66. 29. Jerrells TR, Weinberg J. Inluence of ethanol consumption on
immune competence of adult animals exposed to ethanol in utero. Alcohol Clin Exp Res. 1998;22:391-400.
30. Davis MI. Ethanol-BDNF interactions: still more questions than answers. Pharmacol Ther. 2008;118:36-57.
31. Moonat S, Starkman BG, Sakharkar A, Pandey SC. Neuroscience of alcoholism: molecular and cellular mechanisms. Cell Mol Life Sci. 2010;67:73-88.
32. MacLennan AJ, Leea N, Walker DW. Chronic ethanol administration decreases brain-derived neurotrophic factor gene expression in the rat hippocampus. Neurosci Lett. 1995;197:105-8.
33. Cook RT. Alcohol abuse, alcoholism, and damage to the immune system—a review. Alcohol Clin Exp Res. 1998;22:1927-42. 34. Witt ED. Research on alcohol and adolescent brain development:
opportunities and future directions. Alcohol. 2010;44:119-24.
Correspondence:
Rosa Maria Martins de Almeida
Instituto de Psicologia - Universidade Federal do Rio Grande do Sul
Rua Ramiro Barcelos, 2600, Santa Cecília 90035-003 - Porto Alegre, RS - Brazil E-mail: [email protected] processes, and behavioral disorders that are
perpetuated in adulthood, such as high levels of
anxiety and aggressiveness.33 Many mechanisms
involved in this process are not well understood and the question remains whether the recovery of brain integrity and cognitive function is easier at an young age, given the greater brain plasticity or, on the contrary, neurotoxicity affects neuromaturational
course, making recovery less likely.34
The experiment presented here gathered several variables that could interact in the process of ethanol-induced brain damage, thus making important contributions to the study of this area. As noted, however,
the protocols were not able to identify signiicant
differences in behavioral changes, but we were able
to discuss some likely reasons for these indings. With
respect to biochemical activity, the most noteworthy result
was the signiicant decrease of BDNF in the hippocampus
of animals receiving the intermediate dose of ethanol, but this difference was not found for the highest dosage.
This study is expected to contribute to new research related to the topic of alcohol use in adolescence, especially binge drinking, to better understand the behavioral and biochemical changes resulting from this habit. Further studies should be conducted with other
experimental protocols and the analysis of inlammatory
markers and other brain structures.
References
1. Dahl RE. Adolescent brain development: a period of vulnerabilities and opportunities. Keynote address. Ann N Y Acad Sci. 2004;1021:1-22.
2. Crews F, He J, Hodge C. Adolescent cortical development: a critical period of vulnerability for addiction. Pharmacol Biochem Behav. 2007;86:189-99.
3. Spear LP. Adolescent brain development and animal models. Ann N Y Acad Sci. 2004;1021:23-6.
4. Crews FT, Mdzinarishvili A, Kim D, He J, Nixon K. Neurogenesis in adolescent brain is potently inhibited by ethanol. Neuroscience. 2006;137:437-45.
5. Spear LP, Varlinskaya EI. Adolescence. In: Galanter M, Lowman C, Boyd GM, Faden VB, Witt E, Lagressa D, editors. Recent developments in alcoholism.Volume 17. New York: Kluwer Academic Publishers; 2005. p. 143-59.
6. Crews FT, Nixon K. Mechanisms of neurodegeneration and regeneration in alcoholism. Alcohol Alcohol. 2009;44:115-27. 7. Brown SA, Tapert SF. Adolescence and the trajectory of alcohol use:
basic to clinical studies. Ann N Y Acad Sci. 2004;1021:234-44. 8. You Z, Luo C, Zhang W, Chen Y, He J, Zhao Q, et al. Pro- and
anti-inlammatory cytokines expression in rat’s brain and spleen
exposed to chronic mild stress: involvement in depression. Behav Brain Res. 2011;225:135-41.
9. Rettori V, Fernandez-Solari J, Prestiilippo JP, Mohn C, De
Laurentiis A, Bornstein SR, et al. Endocannabinoids in TNF-alpha and ethanol actions. Neuroimmunomodulation. 2007;14:188-92. 10. Moore KW, O’Garra A, de Waal Malefyt R, Vieira P, Mosmann TR.
Interleukin-10. Annu Rev Immunol. 1993;11:165-90.
11. Vitkovic L, Konsman JP, Bockaert J, Dantzer R, Homburger V, Jacque C. Cytokine signals propagate through the brain. Mol Psychiatry. 2000;5:604-15.
12. Collins MA, Neafsey EJ. Neuroinlammatory pathways in binge