Flávio SarnoI
Carlos Augusto MonteiroII
I Programa de Pós-Graduação. Faculdade de
Saúde Pública (FSP). Universidade de São Paulo (USP). São Paulo, SP, Brasil
II Departamento de Nutrição. FSP-USP. São
Paulo, SP, Brasil
Correspondence:
Carlos Augusto Monteiro Departamento de Nutrição Faculdade de Saúde Pública da USP Av. Dr. Arnaldo 715
01246-907 São Paulo, SP, Brasil E-mail: carlosam@usp.br Received: 8/22/2006 Reviewed: 5/2/2007 Accepted: 5/28//2007
Relative importance of
body mass index and waist
circumference for hypertension
in adults
ABSTRACT
OBJECTIVE: To assess the relative importance of Body Mass Index (BMI)
and waist circumference for the determination of hypertension in adults.
METHODS: Cross sectional analysis of a sample of employees (N=1,584),
aged 18 to 64 years, from a private general hospital in the city of São Paulo, Brazil. Data collection included the application of a structured questionnaire and blood pressure, weight, high, and waist circumference measurements. Hypertension was defi ned as blood pressure levels ≥ 140/90 mmHg or reported use of anti-hypertensive medication. The relative importance of BMI and waist circumference was evaluated by calculating the attributable fraction of hypertension corresponding to each anthropometric indicator, employing both the usual cut-off points as well as cut-off points based on the observed distribution of the indicator in the population. In addition, an indicator combining simultaneously BMI and abdominal circumference values was also developed.
RESULTS: Prevalence of hypertension was 18.9% (26.9% in men and 12.5%
in women). In men, the fraction of hypertension attributable to BMI exceeded the fraction attributable to waist circumference based on the usual cut-off points for the indicators (56% vs. 48%, respectively) and also considering the quartiles of the observed distribution for these indicators (73% vs. 69%, respectively). In women, the fraction of hypertension attributable to waist circumference was slightly higher than the fraction attributable to BMI based on the usual cut off points for both indicators (44% vs. 41%), but the reverse was true when quartiles of the observed distribution were used (41% vs. 57%, respectively). In women only, the fraction of hypertension attributable to the indicator combining BMI and waist circumference (64%) was higher that observed using each indicator alone.
CONCLUSIONS: Both BMI and abdominal circumference were positively
and independently associated with the occurrence of arterial hypertension, the infl uence of BMI being higher among men.
KEY WORDS: Hypertension. Body mass index. Abdominal circumference. Obesity. Attributable fraction.
INTRODUCTION
Several studies provide evidence for an association between arterial hyperten-sion and anthropometric indicators that refl ect excess adipose tissue. Major indicators in this context are abdominal circumference7,22 – which would provide
refl ect the proportion of adipose tissue in the total body mass, regardless of localization.2,4,11
Studies attempting to compare the associations with BMI and abdominal circumference have arrived at confl icting conclusions. While certain studies show better associations for BMI, others fi nd that abdominal circumference is the better indicator, with results that often vary according to sex.1,6,8,20,21,25
The objective of the present study was to evaluate, in a population of Brazilian adults, the relative importance of BMI and abdominal circumference in the occurrence of arterial hypertension.
METHODS
The study population comprised a sample from the operational, administrative, and health care staff of a private general hospital in the municipality of São Paulo, Brazil. In November 2001, a campaign was conducted to diagnose the level of cardiovascular risk among the hospital staff. At the time, the total number of staff members was 3,623 (1,403 men and 2,220 women). All workers were invited to participate by means of posted signs and through the hospital’s internal computer network. Of these, 1,584 workers agreed to take part in the campaign, of which 707 were men and 877 were women. Our study population was composed of these subjects. Studied and non-studied staff members did not differ signifi cantly in terms of sex, age, and schooling.
Data collection was carried out during the fi ve days of the campaign – which lasted from Monday to Friday, from 7 a.m. to 9 p.m. – by teams composed of nursing students, who were trained and supervised. Informa-tion was obtained through a structured quesInforma-tionnaire, which included data on age, sex, skin color, schooling, physical activity, drinking, work shift, and smoking. Standardized techniques were used to obtain anthro-pometric10 and blood pressure19 measurements. Weight
was measured with subjects wearing light clothing and no shoes, using previously calibrated microelectronic scales (Tanita) with 100 g precision. Height was mea-sured using a stadiometer (Seca) mounted on the wall, with 0.1 cm precision. Arterial pressure was measured once with the subject standing, after a resting period of approximately fi ve minutes, using a previously calibra-ted, certifi ed, BP 3BTO-A instrument (Microlife) with 1 mmHg resolution.13 Abdominal circumference was
measured at the midpoint between the last rib and the iliac crest, using an inextensible measuring tape.
We considered as hypertensive all subjects with systolic arterial pressure ≥140 mmHg and/or systolic arterial pressure ≥90 mmHg, as well as all those under antihypertensive medication.
The classifi cation of subjects according to anthropome-tric indicators initially considered the standard cutoff points for BMI and abdominal circumference, which defi ne values considered as normal, moderately high, and high. In the case of BMI, regardless of sex, these ranges correspond to <25, 25-29.9, and ≥30 kg/m2,
respectively.24 In the case of abdominal circumference,
these same classes correspond to, respectively, <94, 94-101.9, and ≥102 cm for men, and <80, 80-87.9, and ≥88 cm for women.12 As a next step, we alternatively
classifi ed BMI and abdominal circumference based on quartiles of distribution in the studied population, separated by sex.
In order to produce a classification that took into account both indicators simultaneously, BMI and abdominal circumference values were transformed into z-scores in order to create a new indicator. This indicator was defi ned as the sum of the z-scores for each indicator, and was classifi ed into quartiles, as previously done for BMI and abdominal circumference.
The study of the importance of BMI, abdominal circu-mference, and the combined indicator in determining arterial hypertension included initially an evaluation of bivariate associations between anthropometric indicator classes and presence of arterial hypertension. For this we used test based on the chi-squared distribution. We then evaluated the association of potential con-founders in the association between anthropometric indicators and arterial hypertension. These included age, schooling, skin color, frequency of physical exer-cise, smoking, frequency of consumption of alcoholic beverages, and work shift. All potential confounders whose association with arterial hypertension showed p-values below 0.2 in the chi-squared test were intro-duced, one-by-one, into logistic regression models for arterial hypertension as a function of, alternatively, BMI, abdominal circumference, and the combined indicator. Adjusted odds ratios for arterial hypertension were given by fi nal regression models that included all confounders determining variations of at least 10% in the odds ratios associated with the anthropometric indicators. We also checked for the potential occurrence of signifi cant interactions between each anthropome-tric indicator and the variables included in the fi nal regression models.
are the adjusted, odds ratios for arterial hypertension in each risk category for that indicator.9
Given the systematic differences found between sexes regarding the association between anthropometric indicators and arterial hypertension, all analyses were performed separately for both sexes. All analyses were carried out using SPSS version 10.0 software.
All staff members included in the study signed a term of free and informed consent. The study protocol was appro-ved by the Departamento de Medicina do Trabalho and the Instituto de Ensino e Pesquisa do Hospital Israelita Albert Einstein, as well as by the Research Ethics Com-mittee of the Faculdade de Saúde Pública da USP.
RESULTS
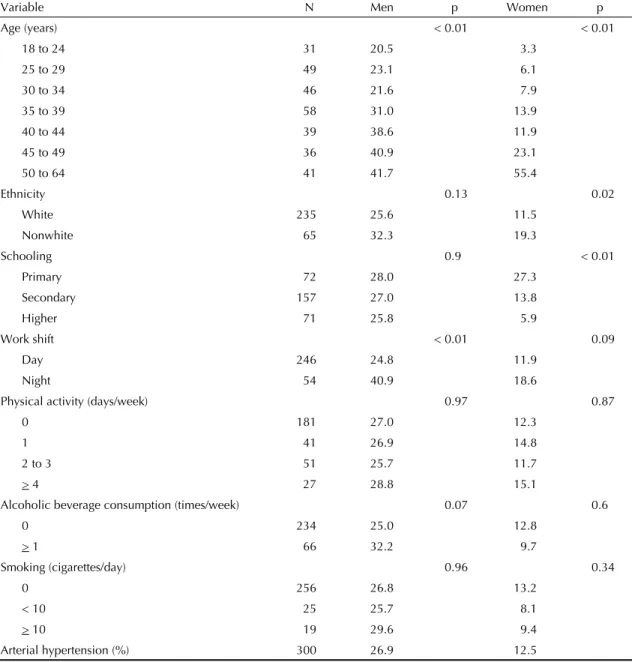
Prevalence of arterial hypertension was 26.9% among males, 12.5% among females, and 18.9% in the general population. Among men, there was a signifi cant increa-se in prevalence associated with age and with working the night shift. Among women, prevalence of hyperten-sion varied signifi cantly with age (direct relationship), schooling (inverse relationship), and ethnicity (higher prevalence among nonwhites) (Table 1).
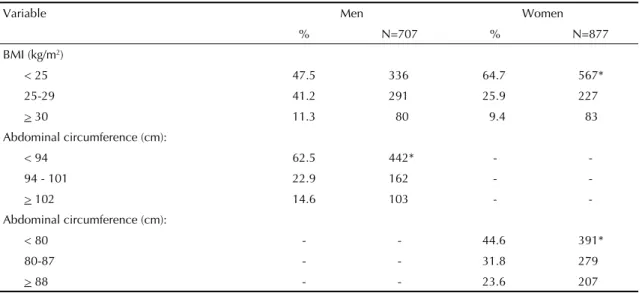
A little over one-half of men and a little over one-third of women had BMIs above the upper limit of the normal range (≥25 kg/m2). Abdominal circumference values
above the upper limit (94 cm for men and 80cm for
Table 1. Prevalence (%) of arterial hypertension according to variables among men and women. São Paulo, Brazil, 2001.
Variable N Men p Women p
Age (years) < 0.01 < 0.01
18 to 24 31 20.5 3.3
25 to 29 49 23.1 6.1
30 to 34 46 21.6 7.9
35 to 39 58 31.0 13.9
40 to 44 39 38.6 11.9
45 to 49 36 40.9 23.1
50 to 64 41 41.7 55.4
Ethnicity 0.13 0.02
White 235 25.6 11.5
Nonwhite 65 32.3 19.3
Schooling 0.9 < 0.01
Primary 72 28.0 27.3
Secondary 157 27.0 13.8
Higher 71 25.8 5.9
Work shift < 0.01 0.09
Day 246 24.8 11.9
Night 54 40.9 18.6
Physical activity (days/week) 0.97 0.87
0 181 27.0 12.3
1 41 26.9 14.8
2 to 3 51 25.7 11.7
> 4 27 28.8 15.1
Alcoholic beverage consumption (times/week) 0.07 0.6
0 234 25.0 12.8
> 1 66 32.2 9.7
Smoking (cigarettes/day) 0.96 0.34
0 256 26.8 13.2
< 10 25 25.7 8.1
> 10 19 29.6 9.4
Arterial hypertension (%) 300 26.9 12.5
Table 2. Distribution (%) of body mass index and abdominal circumference among men and women. Sao Paulo, Brazil, 2001.
Variable Men Women
% N=707 % N=877
BMI (kg/m2)
< 25 47.5 336 64.7 567*
25-29 41.2 291 25.9 227
> 30 11.3 80 9.4 83
Abdominal circumference (cm):
< 94 62.5 442* -
-94 - 101 22.9 162 -
-> 102 14.6 103 -
-Abdominal circumference (cm):
< 80 - - 44.6 391*
80-87 - - 31.8 279
> 88 - - 23.6 207
*p<0.05: Chi-square test for the comparison of distribution between both sexes. BMI: Body Mass Index
Table 3. Prevalence (%) of arterial hypertension according to anthropometric indices among men and women. São Paulo, Brazil, 2001.
Variable Men Women
BMI (kg/m2)
< 25 15.8* 6.7*
22-29 30.9 15.9
> 30 58.8 43.4
BMI quartiles
1 10.2* 4.1*
2 21.5 7.8
3 27.1 10.5
4 48.6 27.7
Abdominal circumference (cm)
< 94 17.9*
-94-101 32.7
-> 102 56.3
-Abdominal circumference (cm)
< 80 - 5.4*
80-87 - 8.6
> 88 - 31.4
Abdominal circumference quartiles
1 11.2* 5.0*
2 20.9 5.3
3 26.2 10.0
4 48.9 28.8
Quartiles for the sum of z-scores of BMI and abdominal circumference
1 9.6* 4.6*
2 12.6 7.1
3 26.9 13.3
4 41.3 38.0
women) were found in a little over one-third of men and a little over one-half of women (Table 2).
For both sexes, there was a uniform and signifi cant increase (p<0.01 for linear trend) in prevalence of arterial hypertension with increases in BMI and ab-dominal circumference. This occurred both when we used the standard cutoffs for BMI and/or abdominal circumference and when we used a classifi cation based on quartiles for the analysis (Table 3).
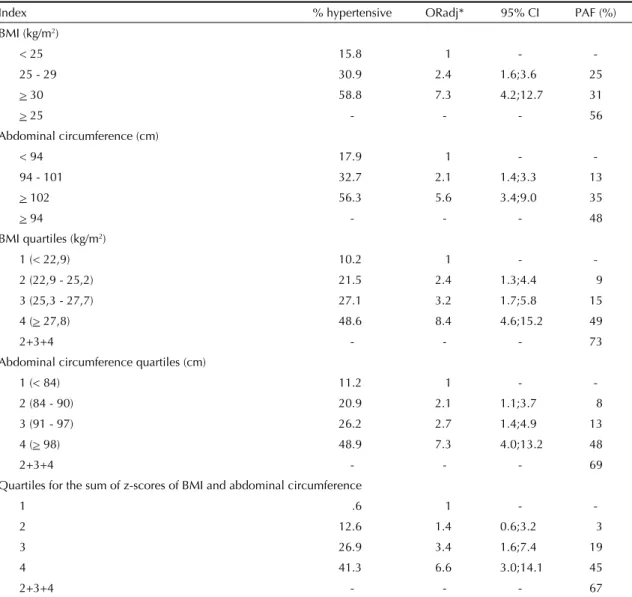
Table 4, restricted to males, shows the adjusted odds ratios for hypertension and the corresponding fractions of disease attributable to the anthropometric indicators. Age and schooling emerged as adjustment variables in all fi nal regression models. There were no signifi cant interactions between the anthropometric indicators and these variables. The fraction of arterial hypertension
attributable to BMI exceeded that attributable to ab-dominal circumference both when the standard cutoff points for the indicator (56% vs. 48%, respectively) and the quartiles of the observed distribution (73% vs. 69%, respectively) were employed. Classifi cation according to quartiles showed an increase in occurrence of arterial hypertension for intervals of BMI (between 22.9 and 25.2 kg/m2) and abdominal circumference
(between 84 and 91 cm) considered as normal based on the traditional cutoff points for these indicators. The attributable fraction for the indicator combining BMI and abdominal circumference among men was 67%, and therefore lower than the attributable fraction for each indicator alone.
Table 5 presents the adjusted odds ratios for hyper-tension and the corresponding fractions of disease attributable to the anthropometric indicators among
Table 4. Adjusted odds ratios for arterial hypertension and the corresponding population attributable fraction associated to different anthropometric indicators among men. São Paulo, Brazil, 2001.
Index % hypertensive ORadj* 95% CI PAF (%)
BMI (kg/m2)
< 25 15.8 1 -
-25 - 29 30.9 2.4 1.6;3.6 25
> 30 58.8 7.3 4.2;12.7 31
> 25 - - - 56
Abdominal circumference (cm)
< 94 17.9 1 -
-94 - 101 32.7 2.1 1.4;3.3 13
> 102 56.3 5.6 3.4;9.0 35
> 94 - - - 48
BMI quartiles (kg/m2)
1 (< 22,9) 10.2 1 -
-2 (-2-2,9 - -25,-2) 21.5 2.4 1.3;4.4 9
3 (25,3 - 27,7) 27.1 3.2 1.7;5.8 15
4 (> 27,8) 48.6 8.4 4.6;15.2 49
2+3+4 - - - 73
Abdominal circumference quartiles (cm)
1 (< 84) 11.2 1 -
-2 (84 - 90) 20.9 2.1 1.1;3.7 8
3 (91 - 97) 26.2 2.7 1.4;4.9 13
4 (> 98) 48.9 7.3 4.0;13.2 48
2+3+4 - - - 69
Quartiles for the sum of z-scores of BMI and abdominal circumference
1 .6 1 -
-2 12.6 1.4 0.6;3.2 3
3 26.9 3.4 1.6;7.4 19
4 41.3 6.6 3.0;14.1 45
2+3+4 - - - 67
females. Again, age and schooling were kept in the fi nal regression models as confounding variables, and again there was no signifi cant interaction between anthropo-metric indicators and these variables. The fraction of female arterial hypertension attributable to abdominal circumference was slightly higher than that attributable to BMI when standard cutoff points were used for both indicators (44% vs. 41%, respectively). However, when quartiles were employed, the explanatory power of BMI exceeded that of abdominal circumference (attributa-ble fractions of 57% and 41%, respectively). Again, classifi cation according to quartiles showed increased occurrence of arterial hypertension in intervals of BMI (between 21.7 and 23.6 kg/m2) considered as normal
according to the standard classifi cation. However, the same was not true for abdominal circumference. The explanatory power of the combined indicator for
wo-men (attributable fraction of 64%) was higher than that of BMI or abdominal circumference alone.
DISCUSSION
Our results indicate that both BMI and abdominal circumference have an important association with arterial hypertension in both sexes, even after control for relevant confounders. Depending on the classifi -cation employed, the fraction of arterial hypertension attributable to these indicators ranged from 48% to 73% among men and 41% to 64% among women. Among men, explanatory power for the occurrence of arterial hypertension, as measured by the population attributable fraction, was greater for BMI than for ab-dominal circumference, regardless of the classifi cation used. Among women, the greater power of BMI over Table 4. Adjusted odds ratios for arterial hypertension and the corresponding population attributable fraction associated to different anthropometric indicators among men. São Paulo, Brazil, 2001.
Index % hypertensive ORadj* 95% CI PAF (%)
BMI (kg/m2)
< 25 15.8 1 -
-25 - 29 30.9 2.4 1.6;3.6 25
> 30 58.8 7.3 4.2;12.7 31
> 25 - - - 56
Abdominal circumference (cm)
< 94 17.9 1 -
-94 - 101 32.7 2.1 1.4;3.3 13
> 102 56.3 5.6 3.4;9.0 35
> 94 - - - 48
BMI quartiles (kg/m2)
1 (< 22,9) 10.2 1 -
-2 (-2-2,9 - -25,-2) 21.5 2.4 1.3;4.4 9
3 (25,3 - 27,7) 27.1 3.2 1.7;5.8 15
4 (> 27,8) 48.6 8.4 4.6;15.2 49
2+3+4 - - - 73
Abdominal circumference quartiles (cm)
1 (< 84) 11.2 1 -
-2 (84 - 90) 20.9 2.1 1.1;3.7 8
3 (91 - 97) 26.2 2.7 1.4;4.9 13
4 (> 98) 48.9 7.3 4.0;13.2 48
2+3+4 - - - 69
Quartiles for the sum of z-scores of BMI and abdominal circumference
1 .6 1 -
-2 12.6 1.4 0.6;3.2 3
3 26.9 3.4 1.6;7.4 19
4 41.3 6.6 3.0;14.1 45
2+3+4 - - - 67
abdominal circumference was only apparent when the classifi cation based on quartiles of the observed distribution in that population was used. The expla-natory power of the indicator combining BMI and abdominal circumference was greater than that of each indicator alone only among women. The classifi cation of indicators based on the distribution observed in the population rather than on the usual cutoff points in-creased the explanatory power of BMI among women and of both BMI and abdominal circumference among men. These results indicate the occurrence of arterial hypertension at levels of BMI and abdominal circu-mference lower than those established by traditional classifi cations.
Certain limitations should be taken into consideration when interpreting the results of the present study. The fi rst concerns the particularities of the study sample – the staff of a private hospital in the city of São Paulo – which limits the extrapolation of results to other settings. The second limitation is that diagnosis of ar-terial hypertension was based on a single measurement, when ideally it would be based on two measurements obtained at different times.5 Finally, the cross-sectional
design of the study does not ensure the temporal prece-dence of anthropometric measures over the occurrence of arterial hypertension.
On the other hand, strengths of the present study include a wide demographic and socioeconomic diversity wi-thin the sample, the obtainment of anthropometric and blood pressure measures by direct measurement rather than by self-report, control for relevant confounders in the estimates of association between anthropo-metric indicators and hypertension, and the analytic procedures employed, which ensure comparability of evaluation and in terms of explanatory power of anthropometric indexes in the determination of arterial hypertension.
Studies comparing the relative importance of BMI and abdominal circumference among adults frequen-tly employ regression analyses or analyses based on ROC curves. Thus, a comparison of these results with those of the present study are not direct or immediate. While certain studies show stronger associations for BMI, others fi nd that abdominal circumference is the better indicator, with results that often vary according to sex.1,6,8,20,21,25 However, most of these studies employ
a priori classifi cations for these two indices, which do not necessarily maximize the explanatory power of the indicators in an equal manner. In some of these studies, it was shown that the simultaneous considera-tion of both BMI and abdominal circumference could increase explanatory power above that of individual indices alone, both among women only,1,8 as found in
the present study, or for both sexes.23,26
The choice of using the attributable fraction as a means to measure the explanatory power of each index was based mainly on the ease of interpretation provided by this method. The attributable fraction indicates the proportion of occurrence of the disease that would be eliminated if individuals remained unexposed to the risk condition under study (“high values” of BMI, abdominal circumference, or the combined index). In addition, sensitivity and specifi city calculations and ROC curves require dichotomous variables, which is not the case for BMI and abdominal circumference. Finally, the attributable fraction allows for confounder control in the association between studied variable and outcome.
We found only six studies in the literature using the population attributable fraction to investigate the importance of abdominal circumference and/or BMI in determining arterial hypertension. Five of these evaluate only abdominal circumference, identifying attributable fractions for arterial hypertension ranging from 5.8% to 30% among men and 11.1% to 66.5% among women.14-18 One of these studies calculated the
attributable fraction of hypertension associated with circumference with and without controlling for BMI, and identifi ed a substantial reduction in the explanatory power of circumference after controlling for BMI in both sexes.16 The only study comparing the attributable
fractions of arterial hypertension associated to BMI and abdominal circumference found similar explanatory po-wer for both indicators (population attributable fraction of about 40% for both sexes).3 There is no record in the
literature of studies calculating the attributable fraction of arterial hypertension in relation to an indicator com-bining BMI and abdominal circumference.
1. Ardern CI, Katzmarzyk PT, Janssen I, Ross R. Discrimination of health risk by combined body mass index and waist circumference. Obes Res. 2003;11 (1):135-42.
2. Arroyo P, Fernandez V, Avila-Rosas H. Overweight and Hypertension: data from the 1992-1993 Mexican survey. Hypertension. 1997;30(3 Pt 2): 646-9.
3. Bei-Fan Z, Cooperative Meta-Analysis Group of Working Group on Obesity in China. Predictive values of body mass index and waist circumference for risk factors of certain related diseases in Chinese adults: study on optimal cut-off points of body mass index and waist circumference in Chinese adults. Asia Pac J Clin Nutr. 2002;11(Supl 8):685-93.
4. Brown CD, Higgins M, Donato KA, Rohde FC, Garrison R, Obarzanek E, et al. Body mass index and the prevalence of hypertension and dyslipidemia. Obes Res. 2000;8(9):605-19.
5. Chobanian AV, Bakris GJ, Black HR, Cushman WC, Lee A, Green LA, et al. The Seventh Report of the Joint National Committee on Prevention, Detection, Evaluation, and Treatment of High Blood Pressure: the JNC 7 report. JAMA. 2003;289(19):2560-72.
6. Cox BD, Whichelow MJ, Ashwell M, Prevost AT, Lejeune SR. Association of anthropometric indices with elevated blood pressure in British adults. Int J Obes
Relat Metab Disord.1997;21(8):674-80.
7. Grievink L, Alberts JF, O’Niel J, Gerstenbluth I. Waist circumference as a measurement of obesity in the Netherlands Antilles; associations with hypertension and diabetes mellitus. Eur J Clin Nutr. 2004;58(8):1159-65.
8. Janssen I, Katzmarzyk PT, Ross R. Waist circumference and not body mass index explains obesity-related health risk. Am J Clin Nutr. 2004;79(3):379-84.
9. Kleinbaum DG, Kupper LL, Morgenstern H. Epidemiologic Research: principles and quantitative methods. New York: Lifetime Learning Publications; 1982. p. 160-164.
10. Lohman TG, Roche AF, Martorell R. Anthropometric standardization reference manual.Champaign: Human Kinetics Books; 1988.
11. Must A, Spadano J, Coakley EH, Field AE, Colditz G, Dietz WH. The disease burden associated with overweight and obesity. JAMA. 1999;282(16):1523-9.
12. National Institutes of Health. Clinical Guidelines on the Identifi cation, Evaluation, and Treatment of Overweight and Obesity in Adults--The Evidence Report. National Institutes of Health. Obes Res. 1998;6 (Supl 2):51-209.
13. O’Brien E, Waeber B, Parati G, Staessen J, Myers MG. Blood pressure devices: recomendations of the European Society of Hypertension. BMJ.
2001;322(7285): 531-6.
14. Okosun IS, Cooper RS, Rotimi CN, Osotimehin B, Forrester T. Association of waist circumference with risk of hypertension and type 2 diabetes in Nigerians, Jamaicans, and African Americans. Diabetes Care.
1998;21(11):1836-42.
15. Okosun IS, Prewitt TE, Cooper RS. Abdominal obesity in the United States: prevalence and attributable risk of hypertension. J Hum Hypertens.1999;13(7): 425-30.
16. Okosun IS, Forrester TE, Rotimi CN, Osotimehin BO, Muna WF, Cooper RS. Abdominal adiposity in six populations of West African descent: prevalence and population attributable fraction of hypertension. Obes Res. 1999;7(5):453-62.
17. Okosun IS, Choi S, Dent MM, Jobin T, Dever GE. Abdominal obesity defi ned as a larger than expected waist girth is associated with racial/ethnic differences in risk of hypertension. J Hum Hypertens. 2001;15 (5):307-12.
18. Okosun IS, Boltri JM, Anochie LK, Chandra KM. Racial/ ethnic differences in prehypertension in American adults: population and relative attributable risks of abdominal obesity. J Hum Hypertens. 2004;18(12):849-55.
19. Pickering TG, Hall JE, Appel LJ, Falkner BE, Graves J, Hill MN, et al. Recommendations for blood pressure measurement in humans and experimental animals: part 1: blood pressure measurement in humans: a statement for professionals from the Subcommittee of Professional and Public Education of the American Heart Association Council on High Blood Pressure Research. Circulation. 2005;111(5):697-716.
20. Sakurai M, Miura K, Takamura T, Ota T, Ishizaki M, Morikawa Y, et al. Gender differences in the association between anthropometric indices of obesity and blood pressure in Japanese. Hypertens Res. 2006;29(2):75-80.
21. Sanchez-Castillo CP, Velazquez-Monroy O, Berber A, Lara-Esqueda A, Tapia-Conyer R, James WP. Encuesta Nacional de Salud (ENSA) 2000 Working Group. Anthropometric cutoff points for predicting chronic diseases in the Mexican National Health Survey 2000.
Obes Res. 2003;11(3): 442-51.
22. Snijder MB, Zimmet PZ, Visser M, Dekker JM, Seidell JC, Shaw JE. Independent and opposite associations of waist and hip circumferences with diabetes, hypertension and dyslipidemia: the AusDiab Study. Int J
Obes Relat Metab Disord. 2004;28(3):402-9.
23. Wildman RP, Gu D, Reynolds K, Duan X, Wu X, He J. Are waist circumference and body mass index independently associated with cardiovascular disease risk in Chinese adults? Am J Clin Nutr. 2005;82(6):1195-202.
24. World Health Organization. Obesity: preventing and managing the global epidemic. Report of a WHO consultation. World Health Organ Tech Rep Ser.
2000;894:i-xii,1-253.
25. Zhu S, Wang Z, Heshka S, Heo M, Faith MS, Heymsfi eld SB. Waist circumference and obesity-associated risk factors among whites in the third National Health and Nutrition Examination Survey: clinical action thresholds. Am J Clin Nutr. 2002;76 (4): 743-9.
26. Zhu S, Heshka S, Wang Z, Shen W, Allison DB, Ross R, Heymsfi eld SB. Combination of BMI and Waist Circumference for Identifying Cardiovascular Risk Factors in Whites. Obes Res. 2004;12 (4):633-45. REFERENCES