Runners in their forties dominate ultra-marathons
from 50 to 3,100 miles
Matthias Alexander Zingg,IChristoph Alexander Ru¨st,I Thomas Rosemann,IRomuald Lepers,IIBeat KnechtleIII
IUniversity of Zurich, Institute of General Practice and for Health Services Research, Zurich, Switzerland.IIUniversity of Burgundy, Faculty of Sport
Sciences, INSERM U1093, Dijon, France.IIIGesundheitszentrum St. Gallen, St. Gallen, Switzerland.
OBJECTIVES:This study investigated performance trends and the age of peak running speed in ultra-marathons from 50 to 3,100 miles.
METHODS:The running speed and age of the fastest competitors in 50-, 100-, 200-, 1,000- and 3,100-mile events held worldwide from 1971 to 2012 were analyzed using single- and multi-level regression analyses.
RESULTS:The number of events and competitors increased exponentially in 50- and 100-mile events. For the annual fastest runners, women improved in 50-mile events, but not men. In 100-mile events, both women and men improved their performance. In 1,000-mile events, men became slower. For the annual top ten runners, women improved in 50- and 100-mile events, whereas the performance of men remained unchanged in 50- and 3,100-mile events but improved in 100-mile events. The age of the annual fastest runners was approximately 35 years for both women and men in 50-mile events and approximately 35 years for women in 100-mile events. For men, the age of the annual fastest runners in 100-mile events was higher at 38 years. For the annual fastest runners of 1,000-mile events, the women were approximately 43 years of age, whereas for men, the age increased to 48 years of age. For the annual fastest runners of 3,100-mile events, the age in women decreased to 35 years and was approximately 39 years in men.
CONCLUSION:The running speed of the fastest competitors increased for both women and men in 100-mile events but only for women in 50-mile events. The age of peak running speed increased in men with increasing race distance to approximately 45 years in 1,000-mile events, whereas it decreased to approximately 39 years in 3,100-mile events. In women, the upper age of peak running speed increased to approximately 51 years in 3,100-mile events.
KEYWORDS: Ultra-Marathon; Age of Peak Performance; Running Speed.
Zingg MA, Ru¨st CA, Rosemann T, Lepers R, Knechtle B. Runners in their forties dominate ultra-marathons from 50 to 3,100 miles. Clinics. 2014;69(3):203-211.
Received for publication onJuly 11, 2013;First review completed onSeptember 18, 2013;Accepted for publication onSeptember 18, 2013 E-mail: [email protected]
Tel.:+41 (0) 71 226 82 82
& INTRODUCTION
Ultra-marathon running is increasing in popularity (1-3), as demonstrated by the increased number of masters runners (i.e., runners older than 35 years) (4), increased participation (1,3), and improved running speeds (5,6).
In running, age has been reported as an important performance-limiting variable (5,7). The age of peak running performance seemed to increase with the increase in either race distance or duration of an endurance race (1,8,9). In sprint running, Schulz and Curnow (9) reported
the age of peak running speed for 100-m sprints at 22.8¡2.3
years and for 200-m sprints at 23.5¡2.1 years in both
women and men. In middle-distance running, the age of peak running speed was 23.7¡2.7 years for 800-m sprints and 24.8¡2.9 years for 1,500 m sprints (9) for men. In
long-distance running (i.e., 5 km and longer) (10), peak running speeds are accomplished by older runners (9). For example, in 10-km races, the fastest runners had an age of peak running speed of approximately 23.3 years (11). Hunter et al. (12) reported the age of peak running speed in elite marathoners at 28.9¡3.8 years for men and 29.8¡4.2 years
for women.
For longer distances than the marathon, the age of peak running speed had not been systematically investigated but rather has been investigated only for single races, such as for a 78-km mountain marathon (1), a 100-km ultra-marathon (5), and 100-mile ultra-ultra-marathons (2,3). In a 78-km mountain ultra-marathon, the age of peak running speed was 33.9¡4.2 years for men and 34.4¡2.5 years for Copyrightß2014CLINICS– This is an Open Access article distributed under
the terms of the Creative Commons Attribution Non-Commercial License (http:// creativecommons.org/licenses/by-nc/3.0/) which permits unrestricted non-commercial use, distribution, and reproduction in any medium, provided the original work is properly cited.
No potential conflict of interest was reported.
women (1). For ultra-marathon distances, such as 100 km (5) and 100 miles (3,13,14), the age of peak performance was between 30 and 49 years, depending on the sex of the runner and the length of the race (3,5,13,14). In ultra-marathons covering distances of more than 200 km, the age of peak running speed was even higher (15,16). Knoth et al. (15) reported an age of peak running speed of 37¡8 years for
men in the 250-km multi-stage ‘Marathon des Sables’. In the 217-km single-stage ultra-marathon ‘Badwater’, the age of peak running speed was 41.9¡4.0 years for women and 41.3¡2.5 years for men (16). In 24-hour ultra-marathons, the
age of peak running speed was 43.4¡2.7 years for women
and 42.1¡2.4 years for men (17). These results suggest that
the age of peak running speed may increase with increasing distance.
Another recently discussed topic is the change of the age of peak running speed over time. For elite marathoners, Hunter et al. (12) found no change in the age of peak running speed of elite competitors competing between 1984 and 2009. In ultra-marathoners, in contrast, the results depended upon the race distance and the sex of the competitors. For example, Eichenberger et al. (1) found an increase in the age of peak running speed from 1998 to 2011 for both sexes in the 78-km ‘Swiss Alpine Marathon’ for the top ten men from 34¡5 years to 38¡5 years and for women
from 32¡5 years to 39¡6 years. Hoffman et al. (18) reported a similar trend in the 161-km ‘Western States 100 Endurance Run’ from 1977 to 2008. The average age of winners increased for men and women at rates of 2.5 and 1.2 years of age per decade, from approximately 32 to 38 years in men and 35 to 37 years in women. In contrast, in the 217-km ‘Badwater’ ultra-marathon, Zingg et al. (16) found a decrease in the age of peak running speed in men from 42.4¡4.2 years to 39.8¡5.7 years. In women, however, the
age of peak running speed remained unchanged at 42.3¡3.8 years (16). In the 247-km ‘Spartathlon’ ultra-marathon, the age of peak running speed remained unchanged for both sexes at 39.7¡2.4 years in men and at 44.6¡3.2 years in
women (16). In 24-hour ultra-marathons held between 1998 and 2011, women’s age of peak running speed decreased from 48 years in 1998 to 35 years in 2011 (17), whereas it remained unchanged at 42.5¡5.2 years in men.
Most of these studies concerning ultra-marathons inves-tigated only one specific race (1-3). Short- and middle-distance races from 100 m to 1,500 m were generally held under standardized circumstances regarding course profile or elevation gain and were often held in sports stadiums. In contrast, ultra-marathons were generally held on streets (19), nature trails (3), a combination of both (1), or in natural environments such as a desert (15). For example, world records achieved in flat city marathon running were not officially recognized by the International Association of Athletics Federations (IAAF) until 2004 (10). Before that time, the fastest marathon times were referred to as the ‘world best time’. Not only the distance but also gain of elevation or the direction of the racecourse was listed as an essential factor to be a potential world record-holding race (10). However, marathon routes still vary greatly in elevation, course, and surface, making exact comparisons impossible (20).
These recent findings suggested that the age of peak running speed seems to increase with increasing race length. Furthermore, the age of the fastest runners seemed to increase over time and with increasing race length.
However, a systemic analysis for different lengths of ultra-marathons is lacking. Therefore, the aims of the present study were to investigate (i) performance trends and (ii) the age of peak running speed in ultra-marathons from 50 to 3,100 miles held between 1971 and 2012. Based upon existing findings, we hypothesized that (i) peak running speed would increase over time in ultra-marathons and (ii) the age of peak running speed would increase over time and would plateau at a maximum age of approximately 45 years.
& MATERIALS AND METHODS
All procedures used in the study met the ethical standards of the Swiss Academy of Medical Sciences (21) and were approved by the Institutional Review Board of Kanton St. Gallen, Switzerland (decision letter of June 1, 2010), with a waiver of the requirement for informed consent of the participants given that the study involved the analysis of publicly available data.
Data sampling
All competitors who ever finished a 50-mile (80.5 km), 100-mile (161 km), 200-mile (322 km), 1,000-mile (1,610 km), or 3,100-mile (4,991 km) ultra-marathon held worldwide between 1971 and 2012 were analyzed regarding the association between age and performance. The data set for this study was obtained from the race website of the ‘Deutsche Marathon Vereinigung’ (22).
Data analysis
To determine changes in peak running speed and in the age of peak running speed, the race times of the annual top and the annual top ten men and women were analyzed. To increase comparability between different distances, all race times were converted to running speed using the equation [running speed] = [race distance]/[race time] in mph (miles per hour). The results in miles per hour were then converted to km/h. If less than the needed amount of competitors was available in a certain year for a certain distance, the respective year and distance was excluded from analysis. The running speed-ratio between the winner and the 10th place were determined if possible (i.e., at least ten finishers in the respective year and distance) using the equation [running speed-ratio of 10thplace] = 100/[running speed of winner]6[running speed of 10thplace] and expressed as a
percentage of the winner’s time.
Statistical analysis
competitor finished more than once in the annual top or top ten for the analysis of the annual top and top ten competitors regarding the analysis of overall performance and age of peak performance. Furthermore, regression analyses of running speed were corrected for age of competitors to prevent misinterpretation of ‘age-effect’ as ‘time-effect’. Statistical analyses were performed using IBM SPSS Statistics (Version 21, IBM SPSS, Chicago, IL, USA) and GraphPad Prism (Version 6.01, GraphPad Software, La Jolla, CA, USA). Significance was accepted atp,0.05 (two-sided for t-tests). Data in the text are given as the mean ¡
standard deviation (SD).
& RESULTS
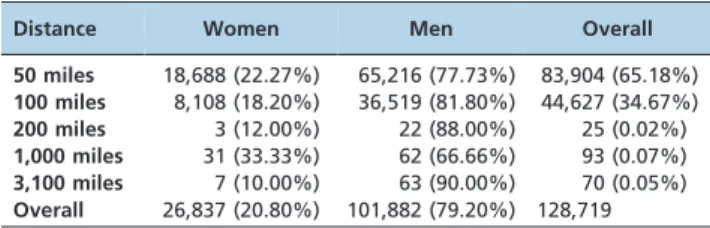
The two most commonly held ultra-marathon distances for races held in miles were the 50- and the 100-mile races. Both distances showed an exponential increase in the number of events over the years. In total, 128,719 ultra-runners, of which 26,837 (20.8%) were women and 101,882 men (79.2%), finished a 50-, 100-, 200-, 1,000-, or 3,100-mile race (Table 1) between 1971 and 2012.
The number of finishes increased over time, and men still outnumbered women in 2012. In 50- and 100-mile races, the number of finishes increased exponentially in both sexes. Approximately one-fifth of the overall finishers were women (Table 1). With the exception of 1,000-mile races, the number of female finishers decreased with the length of the event from over one-fifth in 50-mile events to one-tenth in 3,100-mile events. In the 50- and 100-mile races, thousands of competitors finished, whereas the 200-, 1,000-, and 3,100-mile races each only had a few dozen finishers over time period studied (Table 1). The number of finishers in the 200-, 1,000- and 3,100-mile races was low, with a total of 25 overall finishers for the 200-, 92 for the 1,000-, and 70 for the 3,100-mile races.
Change in running speed over time of the annual fastest runners
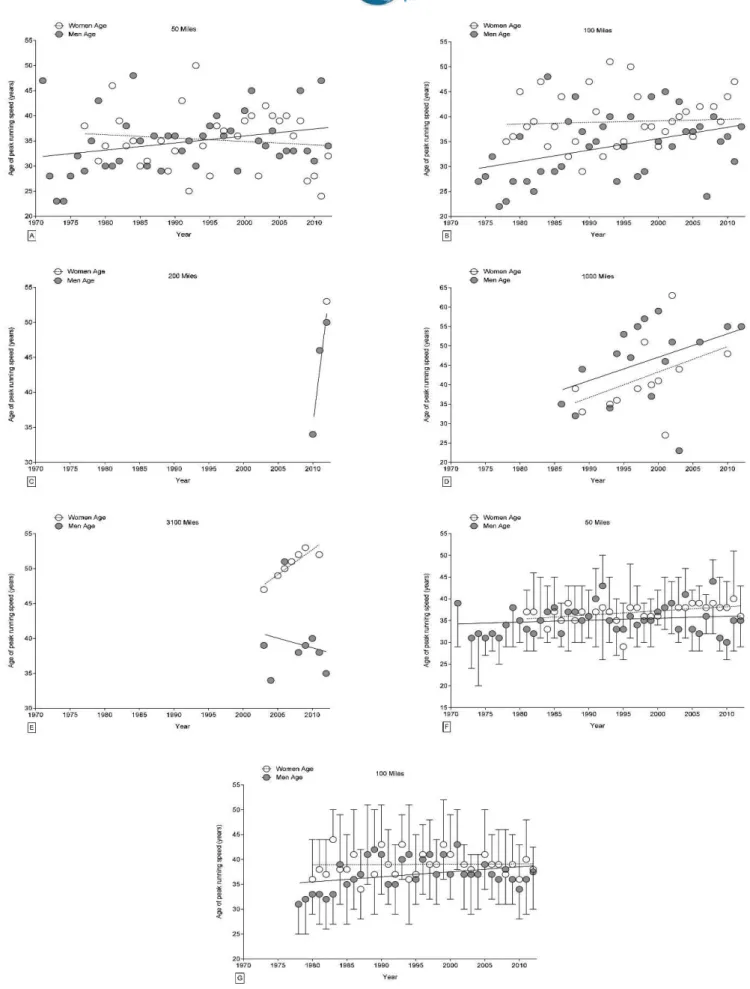
Figure 1 presents the change in running speed in 50-mile (Panel A), 100-mile (Panel B), 200-mile (Panel C), 1,000-mile (Panel C), and 3,100-mile (Panel D) races for the annual fastest women and men. Panel F and Panel G present the annual ten fastest women and men in the 50- and 100-mile events, respectively. In 50-mile races (Figure 1A), peak running speed significantly increased for the annual fastest runners for women from 12.2 km/h (1976) to 14.3 km/h (2012) but not for men, who had a mean running speed of 14.4¡1.0 km/h; this was also the case when corrected for
competitors with repeated finishes (Table 2). In 100-mile
races (Figure 1B), the annual fastest women increased peak running speed from 5.44 km/h (1978) to 10.71 km/h (2012), and the annual fastest men from 6.79 km/h (1974) to 13.82 km/h (2012), also when corrected for competitors with repeated finishes (Table 2). In 200-mile events (Figure 1C), the running speed of the annual fastest men was unchanged at 3.5¡1.0 km/h over time. In 1,000-mile races (Figure 1D), the running speed of the annual fastest men decreased significantly from 5.65 km/h (1986) to 4.19 km/h (2012), even when corrected for competitors with repeated finishes (Table 1). For the annual fastest women, running speed remained unchanged at 2.8¡0.2 km/h. In 3,100-mile events (Figure 1E), running
speed remained unchanged at 2.2¡0.1 km/h for the annual fastest women and at 2.9¡0.1 km/h for the annual fastest
men; this was also the case when corrected for competitors with repeated finishes (Table 1).
For the annual ten fastest finishers in 50-mile events (Figure 1F), peak running speed increased significantly from 9.59¡0.83 km/h (1981) to 13.51¡0.63 km/h (2012) for
women but not for men, who had an unchanged running speed of 13.6¡0.8 km/h; this was also the case when corrected for competitors with repeated finishes (Table 1). In 100-mile events (Figure 1G), the annual ten fastest women increased peak running speed significantly from 6.51¡0.68 km/h (1980) to 9.96¡0.34 km/h (2012) and the annual ten fastest men from 7.58¡0.52 km/h (1979) to
12.71¡0.53 km/h (2012); this was also the case when
corrected for competitors with repeated finishes (Table 1). For 200-mile and 1,000-mile events, insufficient data were available for statistical analyses. In 3,100-mile events, the mean peak running speed was unchanged at 4.3¡0.1 km/h for men, whereas not enough data were available for women.
Density in performance
Figure 2 shows the difference in time between the 1stand the 10thplace for both women and men in 50-mile (Panel A) and 100-mile (Panel B) races. For the other race distances, not enough data were available for statistical analysis. In 50-mile events, the difference decreased in women from 125.7% (1981) to 112.7% (2012) and in men from 118.9% (1971) to 110.1% (2012) (Figure 2A). Over time, the time difference between the 1st and the 10th place decreased by 13% in women and by 8.8% in men. In 100-mile events, the difference decreased in women from 129.7% (1981) to 112.3% (2012) and in men from 120.3% (1971) to 113.7 (2012) (Figure 2B). Over time, the time difference between the 1stand the 10thplace decreased by 17.6% in women and
by 6.6% in men.
Change in the age of the annual fastest runners
Figure 3 presents the change in the age of the annual fastest female and male finishers in 50-mile (Panel A), 100-mile (Panel B), 200-100-mile (Panel C), 1,000-100-mile (Panel D), and 3,100-mile races (Panel E). Panel F and Panel G present the annual ten fastest women and men in 50- and 100-mile events, respectively. In 50-mile events (Figure 3A), the age of the annual fastest competitors remained unchanged at 35.0¡5.8 years for women and at 35.0¡6.0 years for men; this was also the case when the analyses were controlled for multiple finishes (Table 3). In 100-mile events (Figure 3B), the age of the annual fastest men increased from 27 years (1974) to 37 years (2012) but remained unchanged at
Table 1 -Overall finishers up to 2012, sorted by sex and distance. Finishers per distance indicating the number of both male and female finishers, the percentage of finishers of events in brackets, and the overall finishers from 50 to 3,100 miles.
Distance Women Men Overall
50 miles 18,688 (22.27%) 65,216 (77.73%) 83,904 (65.18%) 100 miles 8,108 (18.20%) 36,519 (81.80%) 44,627 (34.67%)
200 miles 3 (12.00%) 22 (88.00%) 25 (0.02%)
1,000 miles 31 (33.33%) 62 (66.66%) 93 (0.07%)
3,100 miles 7 (10.00%) 63 (90.00%) 70 (0.05%)
39.0¡5.9 years for the annual fastest women; this was also
the case when the analyses were controlled for multiple finishes (Table 3). In 200-mile events, the age of peak
running speed remained unchanged at 43.0¡8.3 years for
the annual fastest men (Figure 3C); this was also the case when the analyses were controlled for multiple finishes
(Table 3). In 1,000-mile events (Figure 3D), the age of the annual fastest men increased from 28 years (1984) to 55 years (2012) but remained unchanged at 42.0¡9.1 years for
the annual fastest women; this was also the case when controlled for multiple finishes (Table 3). In 3,100-mile events (Figure 3E), the age of the annual fastest men remained unchanged at 39.0¡5.1 years but increased in
the annual fastest women from 47 years (2003) to 52 years (2011); this was also the case when controlled for multiple finishes (Table 3).
For the annual ten fastest finishers in 50-mile events (Figure 3F), the age of peak running speed increased from 31¡7 years (1973) to 44¡5 years (2008) in men; this was
also the case when corrected for competitors with repeated
finishes (Table 3). For the annual ten fastest women, the age of peak running speed increased from 37¡5 years (1981) to
40¡11 years (2011); this was also the case when corrected
for competitors with repeated finishes (Table 3). In 100-mile events (Figure 3G), the age of peak running speed of the annual ten fastest men increased from 31¡6 years (1978) to
53¡15 years (2012); this was also the case when corrected
for competitors with repeated finishes (Table 3). For the annual ten fastest women, the age of peak running speed remained unchanged between 1980 and 2012 at 39.0¡2.4
years; this was also the case when corrected for competitors with repeated finishes (Table 3).
& DISCUSSION
The aims of the present study were to investigate performance trends and the age of peak running speed in ultra-marathons from 50 to 3,100 miles. The main findings were that (i) the running speed of the annual fastest competitors increased for both sexes in 100-mile events but only for women in 50-mile events, (ii) the age of peak running speed in men increased with increasing race distance to approximately 45 years, and (iii) the upper limit of the age of peak running speed reached approximately 51 years for women in 3,100-mile events.
Fast growing popularity of ultra-marathon running
The number of finishers increased in both 50- and 100-mile ultra-marathons. Distances above 100 100-miles seemed to experience an increase in popularity as well but on a considerably lower level. Zingg et al. (216) reported an increase in participation for both sexes for the ‘Badwater’ (231 km) and the ‘Spartathlon’ (247 km) from 2000 to 2012. These findings might simply be explained by the fact that very few events over 200, 1,000, and 3,100 miles exist.
In the 1970s and 1980s, ultra-marathoners were rare exceptions (2,3). Four decades later, thousands of ultra-marathoners joined ultra-endurance running events held over different distances each year (1,2,15). The number of competitions, especially at distances of 50 and 100 miles, increased. Although marathon running still gets the major publicity (23), it seemed as though ultra-marathon running has become a mass phenomenon in recent years as well (1-3). The question of why so many people would make the effort to accomplish such a grueling task has not yet been answered. Looking for a new goal in life could be an important part of the answer (24), as motivation seemed very important for ultra-marathon running (25,26). Krouse et al. (24) found general health orientation and psychologi-cal coping as the two strongest motivational factors for female ultra-marathoners.
Changes in peak running speed over time
For both the annual fastest and the annual ten fastest runners, peak running speed increased for both sexes in 100-mile races, whereas it only increased for women in 50-mile races. The results for 100-50-mile runners were in line with the findings of Ru¨st et al. (13), who investigated perfor-mance trends in 100-mile runners. These authors found that the annual running speed improved by 13.7% for women and by 14.5% for men from 1998 to 2011 in the annual ten fastest 100-mile runners.
The main reason for the increase in peak running speed might be found in the increased number of finishers over
Table 2 -Multi-level regression analyses for change in running speed over time (Model 1) with correction for multiple finishes (Model 2) and with correction for multiple finishes and age of competitors with multiple finishes (Model 3) for the annual fastest and annual ten fastest women and men.
Distance Model b SE (b) Stand.b T p-value
Annual fastest men
50 miles 1 0.004 0.008 0.071 0.449 0.656
2 0.004 0.008 0.071 0.449 0.656 3 0.002 0.009 0.046 0.279 0.782
100 miles 1 0.064 0.013 0.620 4.746 ,0.001
2 0.064 0.013 0.620 4.746 ,0.001 3 0.052 0.015 0.506 3.573 0.001
200 miles 1 0.665 0.701 0.688 0.948 0.517
2 0.665 0.701 0.688 0.948 0.517 3 0.053 0.103 0.460 0.518 0.696
1,000 miles 1 -0.069 0.028 -0.525 -2.467 0.025
2 -0.069 0.028 -0.525 -2.467 0.025 3 -0.060 0.033 -0.458 -1.797 0.093
3,100 miles 1 0.019 0.017 0.424 1.147 0.295
2 0.019 0.017 0.424 1.147 0.295 3 0.024 0.014 0.532 1.749 0.141 Annual fastest women
50 miles 1 0.038 0.010 0.552 3.801 0.001
2 0.038 0.010 0.552 3.801 0.001 3 0.038 0.010 0.554 3.734 0.001
100 miles 1 0.047 0.011 0.612 4.448 ,0.001
2 0.047 0.011 0.612 4.448 ,0.001 3 0.047 0.011 0.608 4.363 ,0.001
1,000 miles 1 -0.008 0.011 -0.225 -0.764 0.461
2 -0.008 0.011 -0.225 -0.764 0.461 3 -0.007 0.012 -0.182 -0.537 0.603
3,100 miles 1 0.018 0.019 0.388 0.942 0.390
2 0.018 0.019 0.388 0.942 0.390 3 0.077 0.041 1.678 1.906 0.129 Annual ten fastest men
50 miles 1 0.003 0.002 0.071 1.443 0.150
2 0.003 0.002 0.071 1.443 0.150 3 0.003 0.002 0.069 1.397 0.163
100 miles 1 0.044 0.003 0.575 13.102 ,0.001
2 0.044 0.003 0.575 13.102 ,0.001 3 0.041 0.003 0.538 12.107 ,0.001
3,100 miles 1 -0.030 0.030 -0.188 -1.014 0.319
2 -0.030 0.030 -0.188 -1.014 0.319 3 -0.028 0.029 -0.171 -0.964 0.343 Annual ten fastest women
50 miles 1 0.045 0.003 0.613 13.829 ,0.001
2 0.045 0.003 0.613 13.829 ,0.001 3 0.046 0.003 0.616 13.794 ,0.001
100 miles 1 0.046 0.003 0.619 14.258 ,0.001
the last four decades (2,3). However, Hoffman (18) reported that an increasing participation in 100-mile ultra-marathons in North America has not been associated with improve-ments in performance from 1977 to 2008. Another poten-tially important incentive might be prize money. However, whereas major marathons pay thousands of dollars in prize money to winners of major marathons (27), even the most prestigious ultra-marathon, such as the ‘Western States Endurance Run’ (28) or the ‘Leadville Trail 100’ (29), pay little to nothing to winners. Therefore, it must be assumed that increasing peak running speed is associated with personal motivation (25,26) rather than economic reasons.
Age of peak running speed increased with race distance
The age of peak running speed increased from 50-mile events up to 3,100-mile events, more pronouncedly in women than in men. The age of peak running speed in 50-mile events was found to be approximately 35 years for men and approximately 37 years for women. The upper age of peak running speed was approximately 45 years for men in 1,000-mile races and approximately 51 years for women in 3,100-mile races. The age of peak running speed increased with increasing length of an event but only to a distance of 1,000 miles for men and 3,100 miles for women. Knechtle et al. (5) reported similar results for ultra-marathoners over 100 km. These authors showed that female ultra-marath-oners had a later decline in peak running speed at approximately 54 years of age than men at approximately 49 years. For men, the upper age of the peak running speed found here was approximately 45 years for men, which is comparable to the highest age of peak running speed of approximately 43 years reported so far (17) in 24-hour races.
Physiological considerations
Physiological characteristics (7,30-32), such as maximum oxygen uptake (VO2max) or cardiac output, decrease with increasing age (33). Therefore, the question must be raised why older runners accomplished top running speeds in longer distances. For example, maximum cardiac output was found to decrease only slightly up to the age of 65 years but thereafter at a faster rate (7,31). VO2max showed similar
effects on maximal running speed (30,32). VO2max could be
maintained up to the age of approximately 60 years and then decreased dramatically thereafter (7). Katzel et al. (34) showed that training volume had an important impact on the degree of VO2max loss. Highly trained individuals had
about half the loss in aerobic capacity per decade as untrained individuals. The single best predictor of endur-ance running speed was VO2max corresponding to the
lactate threshold in long-distance and marathon runners (35). The muscle mass of a runner is another important aspect to consider (36). The muscles of younger runners are composed of larger fast twitch fibers that exist in a higher quantity than in older runners (36); this factor could have a greater influence on running results than any other in events up to the distance of a marathon. Therefore, it seems logical that older runners tend to prefer to compete in ultra-endurance events.
Apart from physiological factors, anthropometric char-acteristics and training factors seemed to be important for running performance (5,37). Trappe et al. (37) investigated the effect of high-intensity training on muscle mass: the skeletal muscle of middle-aged fit (i.e., approximately 40 years of age and working out on a regular base) runners had greater aerobic potential and could remain at higher levels with continued training than unfit individuals. Reaburn and Dascombe (7) hypothesized that maintaining both high-intensity and high-volume training could minimalize the age-related decrease in running speed. Trappe et al. (37) stated that continued running at a high level could attenuate but not prevent a decline in aerobic capacity. Another aspect contributing to successful ultra-marathon running seemed to be training. Knechtle et al. (8) reported that both training volume and personal best time might be more important for a successful outcome in a 100-km race than anthropometric attributes.
The explanation for why older runners (i.e., masters runners older than 35 years of age) seemed to accomplish peak running speed cannot be simply explained by physiological, anthropological, or training parameters but seems to have a motivational and psychological influence as well (26). Motivation to run ultra-marathons has been discussed in the past (25,38), providing explanations for why older runners tend to participate in competitions that do not attract public attention and therefore require mostly
Figure 2 -The running speed ratio between the winner and the 10thplace expressed as the percentage of the winner’s time for 50 miles
intrinsic motivation. Ruiz-Juan and Zarauz (39) reported that the most important motivation for masters runners is the satisfaction they find in improving themselves upon training rather than beating rivals at competitions. This could explain the fact that elite masters runners do not necessarily require a competition to maintain high-volume training.
Recent studies have suggested a relationship between the age of peak endurance performance and increasing dis-tance. In ultra-swimming (40), cycling (41), and long-distance triathlons (42,43), the age of peak endurance performance seemed to increase with the length of the race. Abou Shoak et al. (44) investigated participation and performance trends in ultra-cycling and reviewed the age of peak speed for different sports and distances. They listed the age of peak speed in swimming competitions 50 m to 12 h in length and in triathlons from the Olympic distance (i.e., 1.5 km swimming, 40 km cycling, 10 km running) to the Deca Iron ultra-triathlon (i.e., ten Ironman triathlons in a row covering the total distance of 38 km swimming, 1,800 km cycling, and 420 km running). As in running, the age of peak speed grew with the length of the race. Physiological (45) and training (46) characteristics played an important role. Gent and Norton (45) investigated the impact of age on anaerobic and aerobic power in cyclists. They reported that age had a minor influence on aerobic power compared with aerobic ultra-endurance events in running. The same effect could be shown in ultra-triathlons, as personal best times were associated with total race time rather than anthropometry or training volume (5).
The age of peak running speed increased over time
With the exception of male 1,000-mile ultra-marathoners, all races seemed to have leveled or increased the age of peak running speed over the years. For 50-mile races, the age of peak running speed showed no change over time for either sexes of the annual top ten running times. The age of the fastest annual fastest runner increased for women but not for men. In 100-mile events, both the age of the fastest and the annual top ten male runners increased, whereas women’s age of peak running speed was constant. Furthermore, the age of peak running speed of the fastest annual male runners over 1,000 miles and of the annual fastest female runners over 3,100 miles increased. In neither sex was a decrease of age of peak performance observed. Obviously, there seemed to be a trend of increasing age of peak running speed in ultra-marathon running above 50 miles.
The reason for the apparent increase in the age of peak speed in recent years was discussed in studies investigating ultra-swimmers (1) and ultra-marathoners (13). Ru¨st et al. (13) mentioned the possibility that older runners prefer to compete in ultra-marathons because of a lack of maximal strength and a deficit in other physiological factors compared with young competitors at their ‘prime age’. This evasion of shorter distance races would further explain why the vast majority of the participants in ultra-marathons consists of older runners (1,15,47). Because the number of finishers is increasing, (2) selection of the fittest masters runners could be conceivable.
Strength, weakness, limitations, and implications for future research
A weakness of the present study is that some events over 50 to 3,100 miles were not recorded, and therefore, the results of some events were not included in this data set. The study is limited because variables such as physiological parameters (48), anthropometric characteristics (49), train-ing data (50), previous experience (5,48), nutrition (51,52), fluid intake (53), environmental conditions (54), and motivational factors (26) were not considered. These variables may have had an influence on race outcome. Future studies need to investigate what motivates older runners to complete ultra-marathons of 200 miles and more in length.
& CONCLUSION
The number of finishers constantly grew from 1971 to 2012 over all running distances from 50 to 3,100 miles. Annual peak running speed increased only for women in 50-mile events. In 100-mile events, both sexes increased their peak running speed, to 10.71 km/h in women and 13.82 km/h in men in 2012. The age of peak running speed increased constantly with increasing length of the race. The upper age of peak running speed reached approximately 45 years in 1,000-mile events for men and approximately 51 years in 3,100-mile events for women. Considering the low numbers of finishers in events above 200 miles, further studies need to investigate more races above this distance to identify a more exact upper age of peak running speed. In addition, the motivation of the runners competing in ultra-marathons requires further evaluation.
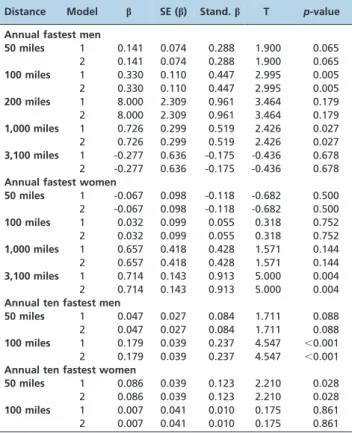
Table 3 -Multi-level regression analyses for change in age over time (Model 1) with correction for multiple finishes (Model 2) for the annual fastest and annual ten fastest women and men.
Distance Model b SE (b) Stand.b T p-value
Annual fastest men
50 miles 1 0.141 0.074 0.288 1.900 0.065
2 0.141 0.074 0.288 1.900 0.065
100 miles 1 0.330 0.110 0.447 2.995 0.005
2 0.330 0.110 0.447 2.995 0.005
200 miles 1 8.000 2.309 0.961 3.464 0.179
2 8.000 2.309 0.961 3.464 0.179
1,000 miles 1 0.726 0.299 0.519 2.426 0.027
2 0.726 0.299 0.519 2.426 0.027
3,100 miles 1 -0.277 0.636 -0.175 -0.436 0.678
2 -0.277 0.636 -0.175 -0.436 0.678 Annual fastest women
50 miles 1 -0.067 0.098 -0.118 -0.682 0.500
2 -0.067 0.098 -0.118 -0.682 0.500
100 miles 1 0.032 0.099 0.055 0.318 0.752
2 0.032 0.099 0.055 0.318 0.752
1,000 miles 1 0.657 0.418 0.428 1.571 0.144
2 0.657 0.418 0.428 1.571 0.144
3,100 miles 1 0.714 0.143 0.913 5.000 0.004
2 0.714 0.143 0.913 5.000 0.004 Annual ten fastest men
50 miles 1 0.047 0.027 0.084 1.711 0.088
2 0.047 0.027 0.084 1.711 0.088
100 miles 1 0.179 0.039 0.237 4.547 ,0.001
2 0.179 0.039 0.237 4.547 ,0.001 Annual ten fastest women
50 miles 1 0.086 0.039 0.123 2.210 0.028
2 0.086 0.039 0.123 2.210 0.028
100 miles 1 0.007 0.041 0.010 0.175 0.861
& AUTHOR CONTRIBUTIONS
Zingg MA drafted the manuscript. Ru¨st CA performed the statistical analyses. Rosemann T revised the manuscript critically for important intellectual content. Lepers R assisted with the statistical analyses and helped draft the manuscript. Knechtle B designed the study, collected the data, and helped draft the manuscript.
& REFERENCES
1. Eichenberger E, Knechtle B, Ru¨st CA, Rosemann T, Lepers R. Age and sex interactions in mountain ultramarathon running - the Swiss Alpine Marathon. Open Access J Sports Med. 2012;3:73-80.
2. Hoffman MD. Performance trends in 161-km ultramarathons. Int J Sports Med. 2010;31(1):31-7.
3. Hoffman MD, Wegelin JA. The Western States 100-Mile Endurance Run: participation and performance trends. Med Sci Sports Exerc. 2009;41(12): 2191-8, http://dx.doi.org/10.1249/MSS.0b013e3181a8d553.
4. World master athletics (WMA): http://www.world-masters-athletics. org/.
5. Knechtle B, Knechtle P, Rosemann T, Lepers R. Predictor variables for a 100-km race time in male ultra-marathoners. Percept Mot Skills. 2010;111(3):681-93, http://dx.doi.org/10.2466/05.25.PMS.111.6.681-693. 6. Lepers R, Cattagni T. Do older athletes reach limits in their performance
during marathon running? Age (Dordr) 2012;34(3):773-81.
7. Reaburn P, Dascombe BJ. Endurance performance in masters athletes. Europe Rev Ag Physic Act. 2008;5:31-42, http://dx.doi.org/10.1007/ s11556-008-0029-2.
8. Knechtle B, Knechtle P, Rosemann T, Lepers R. Personal best marathon time and longest training run, not anthropometry, predict performance in recreational 24-hour ultrarunners. J Strength Cond Res. 2011;25(8):2212-8, http://dx.doi.org/10.1519/JSC.0b013e3181f6b0c7. 9. Schulz R, Curnow C. Peak performance and age among superathletes:
track and field, swimming, baseball, tennis, and golf. J Gerontol. 1988;43(5):113-20, http://dx.doi.org/10.1093/geronj/43.5.P113. 10. The International Association of Athletics Federations (IAAF): http://
www.iaaf.org/.
11. Berthelot G, Len S, Hellard P, Tafflet M, Guillaume M, Vollmer JC, et al. Exponential growth combined with exponential decline explains lifetime performance evolution in individual and human species. Age (Dordr). 2012;34(4):1001-9, http://dx.doi.org/10.1007/s11357-011-9274-9. 12. Hunter SK, Stevens AA, Magennis K, Skelton KW, Fauth M. Is there a sex
difference in the age of elite marathon runners? Med Sci Sports Exerc. 2011;43(4):656-64, http://dx.doi.org/10.1249/MSS.0b013e3181fb4e00. 13. Ru¨st CA, Knechtle B, Rosemann T, Lepers R. Analysis of performance
and age of the fastest 100-miles ultra-marathoners worldwide. Clinics. 2013;68(5):605-11, http://dx.doi.org/10.6061/clinics/2013(05)05. 14. Hoffman MD, Fogard K. Demographic characteristics of 161-km
ultramarathon runners. Res Sports Med. 2012;20(1):59-69.
15. Knoth C, Knechtle B, Ru¨st CA, Lepers R. Participation and performance trends in multistage ultramarathons - the ‘Marathon des Sables’ 2003-2012. Extrem Physiol Med. 2012;(1):13, http://dx.doi.org/10.1186/2046-7648-1-13.
16. Zingg M, Ru¨st CA, Knechtle B, Rosemann T, Lepers R. Analysis of participation and performance in athletes by age group in ultra-marathons of more than 200 km in length. Int J Gen Med. 2013; 9(6):209-20.
17. Zingg M, Ru¨st CA, Rosemann T, Lepers R, Knechtle B. Master runners dominate the 24-hour ultra-marathons worldwide - a retrospective data analysis from 1998 to 2011. Extreme Physiology & Medicine, 2013;2(1):21, http://dx.doi.org/10.1186/2046-7648-2-21.
18. Hoffman MD, Ong JC, Wang G. Historical analysis of participation in 161 km ultramarathons in North America. Int J Hist Sport. 2010; 27(11):1877-91.
19. Knechtle B. Ultramarathon runners: nature or nurture? Int J Sports Physiol Perfom. 2012;7(4):310-2.
20. Marathon Guide: http://www.marathonguide.com/.
21. Swiss Academy of Medical Sciences: www.samw.ch/en/Ethics/Guidelines/ Currently-valid-guidelines.html.
22. Deutsche Ultramarathon Vereinigung (DUV): Results of ultra-marath-oners from 50-, 100-, 200-, 1,000 and 3,100-miles. Retrieved January 2013 from http://www.ultra-marathon.org/.
23. Burfoot A. The history of the marathon: 1976-present. Sports Med. 2007;37(4-5):284-7, http://dx.doi.org/10.2165/00007256-200737040-00003. 24. Krouse RZ, Ransdell LB, Lucas SM, Pritchard ME. Motivation, goal orientation, coaching, and training habits of women ultrarunners. J Strength Cond Res. 2011;25(10):2835-42, http://dx.doi.org/10.1519/ JSC.0b013e318204caa0.
25. Hodge K, Allen JB, Smellie L. Motivation in masters sport: Achievement and social goals. Psychol Sport Exerc. 2008;9:157-76, http://dx.doi.org/ 10.1016/j.psychsport.2007.03.002.
26. Shaw KL, Ostrow A. Motivation and psychological skills in the senior athlete. Eur Rev Aging Phys Act. 2005;2:22-34.
27. World Marathon Major: http://worldmarathonmajors.com/US/. 28. Western States Endurance Run: http://www.wser.org/. 29. Leadville Trail 100 Run: www.leadvilleraceseries.com/.
30. Hawkins SA, Marcell TJ, Victoria Jaque S, Wiswell RA. A longitudinal assessment of change in VO2max and maximal heart rate in master
athletes. Med Sci Sports Exerc. 2001;33(10):1744-50, http://dx.doi.org/ 10.1097/00005768-200110000-00020.
31. Joyner MJ, Coyle EF. Endurance exercise performance: the physiology of champions. J Physiol. 2008;586(1):35-44.
32. Quinn TJ, Manley MJ, Aziz J, Padham JL, MacKenzie AM. Aging and factors related to running economy. J Strength Cond Res. 2011;25(11):2971-9, http://dx.doi.org/10.1519/JSC.0b013e318212dd0e. 33. Carlsson M, Andersson R, Bloch KM, Steding-Ehrenborg K, Mose´n H,
Stahlberg F, et al. Cardiac output and cardiac index measured with cardiovascular magnetic resonance in healthy subjects, elite athletes and patients with congestive heart failure. J Cardiovasc Magn Reson. 2012;14:51, http://dx.doi.org/10.1186/1532-429X-14-51.
34. Katzel LI, Sorkin JD, Fleg JL. A comparison of longitudinal changes in aerobic fitness in older endurance athletes and sedentary men. J Am Geriatr Soc. 2001;49(12):1657-64, http://dx.doi.org/10.1111/j.1532-5415. 2001.49276.x.
35. Takeshima N, Tanaka K. Prediction of endurance running performance for middle-aged and older runners. Br J Sports Med. 1995;29(1):20-3. 36. Lexell J. Human aging, muscle mass, and fiber type composition.
J Gerontol A Biol Sci Med Sci. 1995;50:11-6.
37. Trappe S. Marathon runners: how do they age? Sports Med. 2007;37 (4-5):302-5, http://dx.doi.org/10.2165/00007256-200737040-00008. 38. Tantrum M, Hodge K. Motives for participating in masters swimming.
NZ J Health Phys Ed Rec. 1993;26:3-7.
39. Ruiz-Juan F, Zarauz A. Predictor variables of motivation on Spanish master athletes. J Hum Sport Exerc. 2012;7(3):617-28, http://dx.doi.org/ 10.4100/jhse.2012.73.02.
40. Eichenberger E, Knechtle B, Knechtle P, Ru¨st CA, Rosemann T, Lepers R. No gender difference in peak performance in ultra-endurance swimming performance - Analysis of the ‘Zurich 12-h Swim’ from 1996 to 2010. Chin J Physiol. 2012;55:346-51.
41. Zingg M, Knechtle B, Ru¨st CA, Rosemann T and Lepers R. Age and gender difference in nondrafting ultraendurance cycling performance -the ‘Swiss Cycling Marathon’. Extreme Physiol & Med. 2013;2(1):18, http://dx.doi.org/10.1186/2046-7648-2-18.
42. Knechtle B, Knechtle P, Rosemann T, Senn O. Personal best time, not anthropometry or training volume, is associated with total race time in a Triple Iron triathlon. J Strength Cond Res. 2011;25(4):1142-50, http://dx. doi.org/10.1519/JSC.0b013e3181d09f0f.
43. Gallmann D, Knechtle B, Ru¨st CA, Rosemann T, Lepers R. Elite triathletes in ‘Ironman Hawaii’ get older but faster. Age (Dordr). 2013 Apr 17. [Epub ahead of print]
44. Abou Shoak M, Knechtle B, Knechtle P, Ru¨st CA, Rosemann T, Lepers R. Participation and performance trends in ultra-cycling. Open Access J Sports Med. 2013;4(22):9-18.
45. Gent DN, Norton K. Aging has greater impact on anaerobic versus aerobic power in trained masters athletes. J Sports Sci. 2013;31(1):97-103, http://dx.doi.org/10.1080/02640414.2012.721561.
46. Knechtle B, Ru¨st CA, Knechtle P, Rosemann T. Does muscle mass affect running performance in male long-distance master runners? Asian J Sports Med. 2012;3(4):247-56.
47. Knechtle B, Ru¨st CA, Knechtle P, Rosemann T, Lepers R. Age-related changes in ultra-triathlon performances. Extreme Physiology & Medicine. 2012;1:5, http://dx.doi.org/10.1186/2046-7648-1-5.
48. Billat VL, Demarle A, Slawinski J, Paiva M, Koralsztein JP. Physical and training characteristics of top-class marathon runners. Med Sci Sports Exerc. 2001;33(12):2089-97, http://dx.doi.org/10.1097/00005768-200112000-00018. 49. Knechtle B, Wirth A, Knechtle P, Rosemann T, Ru¨st CA, Besco´s R. A comparison of fat mass and skeletal muscle mass estimation in male ultra-endurance athletes using bioelectrical impedance analysis and different anthropometric methods. Nutr Hosp. 2011;26(6):1420-7. 50. Maughan RJ, Shirreffs SM. Nutrition for sports performance: Issues and
opportunities. Proc Nutr Soc. 2012;71(1):112-9, http://dx.doi.org/10. 1017/S0029665111003211.
51. Rodriguez NR, Di Marco NM, Langley S. American College of Sports Medicine position stand. Nutrition and athletic performance. Med Sci Sports Exerc. 2009;41(3):709-31.
52. Williams J, Tzortziou Brown V, Malliaras P, Perry M, Kipps C. Hydration strategies of runners in the London Marathon. Clin J Sport Med. 2012;22(2):152-6.
53. Ely MR, Cheuvront SN, Roberts WO, Montain SJ. Impact of weather on marathon-running performance. Med Sci Sports Exerc. 2007;39(3):487-93, http://dx.doi.org/10.1249/mss.0b013e31802d3aba.