AR
TICLE
1 Programa de Pós-Graduação em Saúde Coletiva, Universidade do Vale do Rio dos Sinos. Av. Unisinos 950, São João Batista. 93022-000 São Leopoldo RS Brasil. [email protected] 2 Centro de Estudos em Alimentação e Nutrição, Departamento de Nutrição, Universidade Federal do Rio Grande do Sul.
3 Programa de Pós-Graduação em História, Universidade Estadual do Centro-Oeste.
4 Departamento de Enfermagem, Universidade do Estado de Santa Catarina.
5 Departamento de Nutrição, Universidade Federal de Ciências da Saúde de Porto Alegre.
Alteration in eating habits among shift workers of a poultry
processing plant in southern Brazil
Abstract The relationship between shift work and the eatinghabits of workers was investigat-ed in a slaughterhouse in southern Brazil. It in-volved a cross-sectional study with 1,206 workers of both sexes between 18 and 50 years of age. A standardized questionnaire was used to gather de-mographic, socioeconomic, work shift and eating habit information. The shift of work was catego-rized into daytime and nighttime, based on the starting and ending times of the shift. The eating habits of workers were evaluated as follows: num-ber and type of meals eaten during the 24 hours of a normal day, the inappropriateness of the hour-sof these meals and the dietaryrisk score. This was built on the risk score of the weekly consumption of 13 food items. After adjusting for potential confounders, non-Caucasian and younger male workers were more likely to manifest eating risk habits. Nighttimeshift workers consumed ahigher number of meals/day with greater inappropri-ateness of meal times than daytimeshift workers. The night shift can negatively influence the eating habits of workers of that shift.
Key words Shift work, Night work, Eating habits, Occupational health
Elisângela da Silva de Freitas 1
Raquel Canuto 2
Ruth Liane Henn 1
Beatriz Anselmo Olinto 3
Jamile Block Araldi Macagnan 4
Marcos Pascoal Pattussi 1
Fernanda Michelin Busnello 5
F
r
e
itas ES
Introduction
A new organizational paradigm for production in the twentieth century has been formed in the West since the early 1970s.Industrial production, which had until then been organized for mass production in accordance with the Taylor model of Scientific Management, was supplanted by a more flexible model of production, known as the
Toyotism model1. This flexibility in the
produc-tion process included concepts related to work versatility, decentralization and service outsourc-ing, as well as working hours, shifts and how the time a person has spent workingis distributed
over theirlifetime2.
In this context, at the beginning of the twen-tieth century, the workplace began to experience a process known as job insecurity, which was understood to involve instability and working conditions as well as the objective and subjective effects that these had on the lives of individuals
and groups2. Within the framework established
over recent decades, the pace of these new eco-nomic processes have required industries to function beyond normal daily working hours and so-called working days. Their employees are spread between shifts, that function 24 hours a
day3. Although each company has its own way of
organizing work timetables and routines, at the moment, shift work is defined as that which is performed out of normal working hours (which start at 8am or 9am; ending at 5pm or 6pm) or, even, as work that is performed continually for
24 hours by rotating work teams4.
The scientific literature suggests that shift work can influence the risk of developing chron-ic, non-communicable diseases (NCDs) includ-ing: obesity, cariovascular diseases, metabolic
syndromes and cancer5-10. The behavioral factors
involved in the development of these disorders include lack of sleep, smoking, the consumption of alchoholic stimulants and changes in the food
consumed by these workers11. Some
interna-tional studies show that shift work can affect the nutritional quality of a person’s diet, as well as the frequency with which they consume certain
foods (snacks, sweets, coffee)12-18. Concomitantly,
an increase in the number of meals consumed, in particular snacks, or even skipping any main meal, has been indicated as a risk factor for
dia-betes mellitus19.
Meanwhile, in Brazil, studies on eating
hab-its among shift workers are still scarce20,21.
Fur-thermore, the eating habits of workers can vary according to the type of activity they perform,
so that further studies are required to investigate different scenarios so as to better understand this relationship. Thus, the aim of this study is to in-vestigate the influence that shift work has on the eating habits of workers at a slaughterhouse in southern Brazil.
Methods
A cross-sectional study was conducted using a sample of 1,206 workers, aged between 18 and 50 years old, of both sexes, from a refrigerated slaughterhouse in southern Brazil, This company was selected for reasons of convenience, and the interviews were conducted between January and May 2010 in the workers’ own homes. This paper is part of the study “The relationship between shift work and excess weight and metabolic syn-drome among workers at a poultry slaughter-house in southern Brazil.”
The size of the sample was calculated for the broader study (outcome of obesity and shift work exposure) based on the following assumptions: 95% confidence level; 80% statistical power, non-exposure ratio: exposure of 1:2 with a 1.30 risk ratio.The sample size was increased by 10% to compensate for possible losses or rejections, with 1,125 employees being required. Those considered to be vulnerable were nighttime shift workers; daytime shift workers were considered to be non-vulnerable. Pregnant women and em-ployees who had not been to work for more than ten days during the research period were exclud-ed from the survey.
char-aúd
e C
ole
tiv
a,
20(8):2401-2410,
2015
acteristics, a standard pre-codified and pre-tested questionnaire was used.
The demographic and socio-economic vari-ables investigated were as follows: age, registered for each full year and divided into quintiles; skin color, as described by the interviewee and clas-sified as Caucasian and non-Caucasian; marital status, as informed by the interviewee and cat-egorized as being with a partner and without a partner; education, relevant to full years of study and classified as: first to fourth grade, fifth to eighth grade, incomplete secondary education, completed secondary or higher education; per capita family income, based on information pro-vided about the income of each family member during the previous month and classified into quartiles.
Work shifts were classified as daytime and nighttime, in that vulnerable workers were con-sidered to be those who spent more than 90% of their working time in night/early morning shifts (nighttime shift workers), in other words, those who begin their working day at 5pm. Non-vul-nerable workers were those working daytime shifts who began their working day at 6am. The company’s working hours are fixed, totaling 44 working hours per week with one day off, either on Saturday or Sunday.
Eating habits were classified as follows: the number and types of meals consumed during one typical working day; a rating system was es-tablished for dietary risk factors based on a per-son’s normal weekly food consumption.
Information was collected about the meals and snacks consumed by the workers during a normal day (breakfast, morning snack, lunch, afternoon snack and nighttime snack), together with meal times. Based on this information, a classification was made of the number of meals consumed per day and the inappropriateness of meal times. In order to establish inappropriate meal times, cul-tural and physiological factors were taken into account. Thus, the following classification was used: an inappropriate breakfast was consumed outside the hours of 6am - 8:30am; an inappro-priate morning snack was consumed outside the hours of 9am - 11am; an inappropriate lunch was outside the hours of11am – 2pm; an inappropri-ate afternoon snack was consumed outside the hours of 3pm to 6pm; an inappropriate supper was consumed outside the hours of 6pm – 9pm; an inappropriate evening snack was consumed outside the hours of 8pm – 12pm.
The dietary risk score was established based on the risk factor classification for a normal
weekly consumption of thirteen different food items. This classification of a risk factor diet was based on the recommendations issued by the
Di-etary Guidelines for the Brazilian Population22.
Ratings were given according to the nature of each food item, taking into account the way that information relating to its consumption was col-lected. In the case of food items measured using a quantitative rating system, these were divided into terciles, while all the others were measured according to their recommended intake.
Information about the consumption of beans, rice, cassava, sweets, soft drinks, cookies/ crackers and sugar was calculated according to “days of the week” (varying between 0 and 7) and “times per day” (varying from 1 to 4). Thus, each food item was transformed into the “number of times it was consumed per week,” the number of days being multiplied by the number of times consumed. Then the number of times/week was divided into terciles.
In the case of the consumption of fruit and greens/vegetables, this was recorded based on-weekly consumption (every day; 5 or 6 days a week; 3 to 4 days a week; 1 or 2 days a week; never/almost never) and the number of portions consumed during one normal day (1 portion; 2 portions; 3 portions and 4 portions or more). Thus, these two items of information were trans-formed into the number of portions of fruit and greens/vegetables consumed per week, as follows: first, the frequency categories were transformed into continual variables (every day = 7; 5 to 6 days = 5.5; 3 to 4 days = 3.5; 1 to 2 days = 1.5; never/almost never – 0) and then multiplied by the number of portions. Then the number of portions/week was divided into terciles.
For food items considered as factors of healthy eating habits, a lower score (1) was given to consumers with the highest intake (T3), a me-dium score (2) for consumers with a moderate intake (T2) and a higher score (3) for consum-ers with the lowest intake (T1). For food items considered to be a risk factor, a higher score (3) was given to consumers who had the highest in-take (T3), a medium score (2) for those with a moderate intake (T2) and a lower score (1) for consumers with the lowest intake (T1).
F
r
e
itas ES
who adhered to the recommended intake. Items with response options and their respective scores were as follows:consumption of red meat – fat re-moved (1); with fat (3), do not eat red meat (1); eat chicken – with skin removed (1), with skin (3), do not eat chicken (1); type of fat used in food preparation – lard (3), soya oil (1), sunflow-er oil (1), maize/corn oil (1), cottonseed oil (1), rapeseed oil (1), margarine (3), olive oil (1), don’t know (3);consumption of fried food/processed meat – every day (3), 5 to 6 days/week (3), 3 to 4 days/week (3), 1 or 2 times/week (2), hardly ever/ never (1).
Thus, the total score was obtained by add-ing the number of points given to each one of the thirteen food items.The lowest score was 13 points, representing the lowest score for dietary risk; and the maximum score was 39 points, in-dicating the highest score for dietary risk. The total number of points was divided into a tercile, a “dietary risk” rating being given to those work-ers who belong to tercile 3 (>=29 points) and the standard category rating refers to individuals with terciles 1 and 2.
Data input was conducted using the Epi Info 6.0 Program in duplicate, and the Stata version 11 program was used for the statistical data anal-ysis.Variables were described by means of abso-lute and relative frequencies in the association test between socio-demographic variables, and a chi-squared test for heterogeneity was applied to shift workers.
The estimated for crudeand adjusted preva-lenceratios and respective confidence intervals of 95% were calculated by means of the Poisson re-gression method with robust variance – the Wald linear trendtest was used to determine linear trends of association, in all other cases the Wald test was used for heterogeneity. Variables with a
significance level of p ≤ 0.20 in the crude
anal-ysis were considered as a potential confounding factor and taken to the multivariable model. A multi-variable test was conducted following the hierarchical concept model, where variables are grouped on the basis of distal and proximal asso-ciation with the food consumption
rating.Vari-ables with a significance level of p ≤ 0.20 were
maintained in the subsequent level of analysis. Thus, the demographic variables (sex, age, skin color and marital status) were mutually adjusted (lst level); socio-economic variables (education and income) and work shifts were adjusted for demographics and mutually (2nd level). Associ-ated factors were considered to be those that had a significance level less than or equal to 5%.
This project was submitted to and approved by the Research Ethics Committee of the Uni-versity of Vale do Rio dos Sinos, Rio Grande do Sul, Brazil, in accordance with recommendations
contained in Resolution 196/9623.
Results
The final sampleconsisted of workers with an av-erage age of 30.5 (DP: ± 8.7). Table 1 shows the demographic, socio-economic characteristics and the work shift sample included in this study. Most of the sample consisted of women (65%), those with partners (67%) and who had com-pleted secondary education (48%). With respect to shift workers, 66% of these workers performed their activities at night (information not present-ed in the Table). Table 1 also shows that there was no significant association between socio-demo-graphic variables and nighttime work.
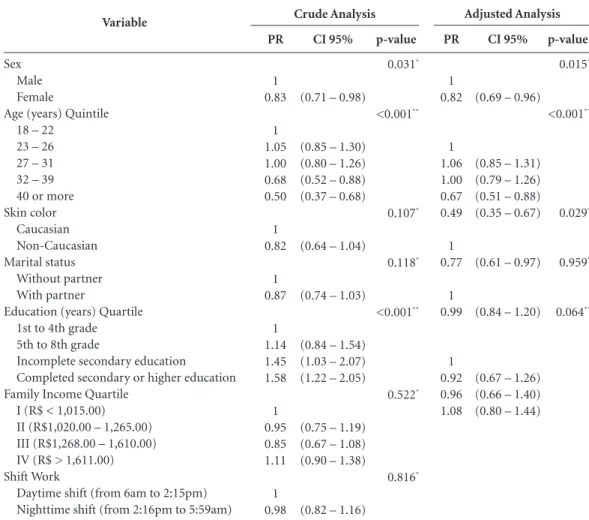
Table 2 shows the crude and adjusted anal-yses of the demographic, socio-economic and shift work characteristics with their consump-tion risk factor ratings. It may be observed that, after adjusting the multivariable model, women had an 18% lower probability than men of a risk factor in their food consumption. The non-Cau-casian workers had a 33% lower probability of presenting an outcome. Age presented an inverse relationship with food risk factors, in that indi-viduals aged 40 and over had a nearly 50% low-er probability when compared to younglow-er men (aged 18 - 22). Education lost its statistical sig-nificance oncethe multivariable model had been adjusted.
Graph 1 shows the number and types of meals consumed during the day according to work shifts. It may be observed that a higher percent-age of nighttime workers consumed three or four meals a day, compared to daytime workers. When analyzing the type of meal consumed, it was seen that nighttime workers show a greater incidence of afternoon snack and lunch consumption. On the other hand, daytime workers showed a higher prevalence of breakfast and nighttime snack con-sumption.
aúd
e C
ole
tiv
a,
20(8):2401-2410,
2015
p-value*
0.184
0.229
0.131
0.410
0.673
0.092
Variable
Sex Male Female
Age (years) Quintile 18 – 22
23 – 26 27 – 31 32 – 39 40 or more Skin color
Caucasian Non-Caucasian Marital status
Without partner With partner
Education (years) Quartile 1st to 4th grade 5th to 8th grade
Incomplete secondary education Completed secondary or higher education Family Income Quartile
I (R$ < 1,015.00) II (R$1,020.00 – 1,265.00) III (R$1,268.00 – 1,610.00) IV (R$ > 1,611.00)
(n) %
(420) 35 (786) 65
(251) 20.8 (258) 21.4 (218) 18.1 (246) 20.4 (233) 19.3
(1008) 84 (195) 16
(397) 33 (809) 67
(212)17.6 (311) 25.8 (104) 8.6 (578) 48
(295) 24.7 (299) 25.1 (303) 25.4 (295) 24.7
Table 1. Sample distribution and prevalence (CI 95%) of nighttime shift work according to demographic,
socio-economic characteristics among workers in a refrigerated slaughterhouse in the South of Brazil (n = 1,206).
%
68.81 65.01
67.33 71.70 65.60 62.60 63.94
65.67 70.25
64.73 67.12
62.73 67.20 67.31 67.12
64.40 63.88 65.67 72.54
(CI 95%)
(64.36 – 73.25) (61.67 – 68.35)
(61.49 – 73.17) (66.10 – 77.20) (59.24 – 71.95) (56.51 – 68.70) (57.73 – 70.15)
(62.73 – 68.61) (63.79 – 76.73)
(60.00 – 69.45) (63.88 – 70.36)
(56.17 – 69.30) (61.95 – 72.45) (58.14 – 76.48) (58.14 – 76.47)
(58.91 – 70.00) (58.40 – 69.35) (60.30 – 71.05) (67.41 – 77.66)
* Chi-squared Test for heterogeneity.
Nighttime shift
Discussion
This study investigated the relationship between shift work and the eating habits of workers at a slaughterhouse in southern Brazil. An association was found between shift work and the types of meals, frequencyand times these were consumed. In addition, non-Caucasian, younger workers of the male sex showed a greater probability of pre-senting food consumption risk factors.
Nighttime workers habitually consume a higher number of meals per day than daytime workers. These findings may be due to the fact that these workers spent more time awake than daytime workers, and consume more snacks be-tween main meals. Nighttime workers also show less prevalence of eating breakfast every day, probably because most of them are asleep when this meal is normally eaten.
Furthermore, when an investigation was made into the times when meals are consumed, it was seen that these were inappropriate, from a physiological and well as cultural point of view:only half the nighttime workers stated that they habitually ate breakfast and, among those who did so, in almost 100% cases, they did so at an inappropriate time.
In addition, the company offers its workers at least one full meal a day, but this meal is also of-fered at an inappropriate time. For workers who begin their working day in the early morning, a meal is provided at 9:30am, and at 3pm for those who begin working in the late morning, while a meal is provided at midnight for those who begin work in the afternoon.
F
r
e
itas ES
these workers. A cross-sectional study, which in-volved 29,206 male American health profession-als, showed that skipping breakfast was associated with an increased risk of type 2 diabetes in males, even after making an adjusted for BMI. The same study found a direct link between eating snacks between meals and the risk of developing type 2
diabetes, though this was based on their BMI19.
In addition, it is known that the circadian rhythm in human beings is regulated by central markers (the central nervous system) and pe-ripheral markers (liver, muscular andadipose and pancreatic cells), and that these markersimpose a 24-hour rhythmic pattern of behavior both in the form of metabolic processes (gluconeogen-esis, cholesterol synth(gluconeogen-esis, insulin secretion), as well as behavioral patterns (sleeping and eating
habits)24. That is to say, the time chosen to have
meals is not only determined socially, but is also a process that is genetically regulated to ensure that the food eaten favors a person’s metabolism. Thus, it is understood that shift workers suffer from disrupted circadian rhythms, and as a re-sult it is impossible for them to consume meals within a “physiologically programmed” time-table. The possible effects of this disruption are metabolic disturbances and even changes to their
appetite25.
The findings related to the standards of meal consumption found in this study, corroborate other findings in the available literature. Studies show that shift work affects the number of meals and times these are consumed rather than the
overall content of a worker’s diet14,25-27. A French
Variable
Sex Male Female
Age (years) Quintile 18 – 22
23 – 26 27 – 31 32 – 39 40 or more Skin color
Caucasian Non-Caucasian Marital status
Without partner With partner
Education (years) Quartile 1st to 4th grade 5th to 8th grade
Incomplete secondary education Completed secondary or higher education Family Income Quartile
I (R$ < 1,015.00) II (R$1,020.00 – 1,265.00) III (R$1,268.00 – 1,610.00) IV (R$ > 1,611.00) Shift Work
Daytime shift (from 6am to 2:15pm) Nighttime shift (from 2:16pm to 5:59am)
PR
1 0.83
1 1.05 1.00 0.68 0.50
1 0.82
1 0.87
1 1.14 1.45 1.58
1 0.95 0.85 1.11
1 0.98
Table 2. Crude and adjusted analyses for eating risk according to demographic, socio-economic and labor
characteristics of shift workers in a refrigerated slaughterhouse in the south of Brazil (n = 1,206).
CI 95%
(0.71 – 0.98)
(0.85 – 1.30) (0.80 – 1.26) (0.52 – 0.88) (0.37 – 0.68)
(0.64 – 1.04)
(0.74 – 1.03)
(0.84 – 1.54) (1.03 – 2.07) (1.22 – 2.05)
(0.75 – 1.19) (0.67 – 1.08) (0.90 – 1.38)
(0.82 – 1.16)
p-value
0.031*
<0.001**
0.107*
0.118*
<0.001**
0.522*
0.816*
a Values (missing information); * Wald Test for heterogeneity; ** Wald Test for linear trend.
In the adjusted analysis, demographic variables (gender, age, skin color and marital status) were adjusted between each other; socio-economic variables (education and income) and shift work were adjusted for demographic variables and between each other.
Crude Analysis
PR
1 0.82
1 1.06 1.00 0.67 0.49
1 0.77
1 0.99
1 0.92 0.96 1.08
CI 95%
(0.69 – 0.96)
(0.85 – 1.31) (0.79 – 1.26) (0.51 – 0.88) (0.35 – 0.67)
(0.61 – 0.97)
(0.84 – 1.20)
(0.67 – 1.26) (0.66 – 1.40) (0.80 – 1.44)
p-value
0.015*
<0.001**
0.029*
0.959*
aúd
e C
ole
tiv
a,
20(8):2401-2410,
2015
study that investigated the number and types of meals consumed by shift workers, found that
nighttime workers averaged five or more meals a day, which was higher than the average con-sumed by daytime workers. However, nighttime shift workers ate breakfast and lunch less often than daytime workers who, in contrast, ate more
snacks in between meals12. Studies conducted by
Sudo and Ohtsuka18 also found that shift
work-ers showed a low level of adherence to breakfast, with over half of them stated they did not eat this meal.
Reasons given for alterations in the frequen-cy and times shift workers consume their meals
remain controversial. While Waterhouse et al.28
showed that such changes were influenced more by habits and the time workers had available, rather than by alterations to their appetites, in
an experimental study, Crispim et al.29 indicated
that nighttime shift workers had bigger appetites than day workers.
In this study, women showed less probabili-ty of presenting eating risk factors than men – it was also noted that the older a person is, the more this is likely to occur.
A study conducted among Norwegian shift workers confirmed the tendency among women to consume a better quality diet, including fruit
and vegetables on a daily basis30. In Japan, Kaneko
et al.25, using a scoring system, showed that
wom-en adopted a more healthy diet.Another study showed that men consumed low levels of healthy
Graph 1. Prevalence of the number and type of meals consumed throughout the day in accordance with the shift
in workers in a refrigerated slaughterhouse in the south of Brazil (n = 1,206).
Caption: ** p < 0,01; *** p < 0,001. > 3
Meals/day
Breakfast Morning snack
Lunch Afternoon snack
Supper Evening snack 0,281
0,36
0,626 0,506
0,167 0,054
0,847 0,863
0,701
0,904 0,891
0,049 0,053
0,184
Daytime shift Nighttime shift **
**
***
***
Graph 2. Inadequate prevalence in meal times **
consumed throughout the day in accordance with the shift in workers in a refrigerated slaughterhouse in the south of Brazil (n = 1,206).
Caption: * p < 0,001; ** p=<0,05. *** considered inadequate when consumed other than at the following times: Breakfast from 6am to 8:30am; lunch from 11am to 2pm; supper from 6pm to 9pm.
Breakfast Lunch Supper
0,058 0,967
0,5630,591
0,742
0,402
Daytime shift Nighttime shift
F
r
e
itas ES
foods, such as fruit and vegetables. However, after a multi-variable analysis, the proportion of work-ers who eat less than one portion of these foods per day was shown to be greater among younger
workers, irrespective of their gender31. As well as
this study, it should be mentioned that Olinto et
al.32 had already found evidence, in a
cross-sec-tional study conducted amongyoung adults in southern Brazil,that women and non-Caucasians show a tendency to adopt healthier eating habits.
With respect to age, our finding showed that there is an inverse relationship with eating risk factors.This trend has been noted in
sever-al population studies33-35, although some were
conducted with specific groups, such as samples
that included only women36. In Europe, Estaquio
et al.35 found greater adherence to healthy eating
among older individuals. Similar results have been found in Brazil, which indicate that being older is directly associated with consuming more
fruit, legumes and vegetables33-35. In contrast,
Morikawa et al.17 showed that younger workers,
aged between 20 and 29, had a total energy
con-sumptionthat was lower than older workers (≥ 30
years of age).
We have also noted studies in the literature that suggest that individuals with a higher level of education tend to have healthier eating habits, consuming more fruit and vegetables and fewer
industrialized foods30,36-38. However, in our own
study it was not possible to observe a relationship between education and food risk factors.
Finally, the fact that at least one main meal is eaten on company premises during working hours may be one of the reasons why it has been difficult to show any differences in the eating habit risk factors among nighttime and daytime shift workers. Thus, at least one daily meal is con-sumed under similar conditions in the case of all
employees. Raulio et al.39 stated, in their study,
that the location where meals are consumed within a working environment can contribute towards the well-being and nutritional education of employees and can have significant effects on the health of workers.
Furthermore, it is worth mentioning that, in additionto the fact that there is a scarcity in Brazil of studies that investigate how shift work influences eating habits, this is the first study of its kind in the world that involves slaughterhouse
workers. Brazil is one of the four main pork and poultry producing and exporting countries in the world. This sector therefore generates jobs within the country, with an estimated five hun-dred thousand at poultry and pig slaughterhous-es. At the same time, the media and the govern-ment have been denouncing the fact that workers in this sector suffer serious physical and mental illnesses, caused mainly by a combination of having to perform endless repetitive movements and working in a very low-temperature
enviorn-ment40. These two factors can result in a greater
demand for energy, which underlines the impor-tance of studies related to the food consump-tion of these workers. In addiconsump-tion, shift work represents an occupational risk factor, which is generally neglected by studies involving this
sec-tor of society41, which affect the health and lives
of these workers in ways that are still almost un-known in Brazil.
However, our finding should be interpreted in the light of some of its limitations.We know that there may be errors contained in records based on information gathered in the past, or on biased recollections. It should also be said that it was not the aim of this study to evalu-ate the consumption of nutrients, but rather to construct a scoring system based on several food products that form an important part of the di-etary habits of these workers. In this sense, these scores have been used to characterize their eat-ing habits, since they form a summary-measure of frequently consumed items of food.This score made it possible to group individuals into similar sections and to classify them according to
estab-lished guidelines for diet risk factors42,43.
aúd
e C
ole
tiv
a,
20(8):2401-2410,
2015
References
Revel D. Da cidadiania à civilidade. O sofrimento do trabalho. Rev Brasileira de Sociologia da Emoção 2002; 1(2):201-220.
Oliveira L, Carvalho H. A precarização do emprego na Europa. DADOS - Revista de Ciências Sociais 2008; 51(3):541-567.
Fisher FM. As demandas da sociedade atual. In: Fisher FM, Moreno C, Rotenberg L, organizadores. Trabalho
em turnos e noturno na sociedade 24 horas. São Paulo:
Atheneu; 2004. p. 3-17.
Morshead DM. Stress and shiftwork. Occup Health Saf
2002; 71(4):36-38.
Thomas C, Power C. Shift work and risk factors for car-diovascular disease: a study at age 45 years in the 1958 British birth cohort. Eur J Epidemiol 2010; 25(5):305-314.
Sahar S, Sassone-Corsi P. Metabolism and cancer: the circadian clock connection. Nat Rev Cancer 2009; 9(12):886-896.
Macagnan J, Pattussi MP, Canuto R, Henn RL, Fassa AG, Olinto MT. Impact of nightshift work on over-weight and abdominal obesity among workers of a poultry processing plant in southern Brazil. Chronobiol int 2012; 29(3):336-343.
Stevens RG. Light-at-night, circadian disruption and breast cancer: assessment of existing evidence. Int J Ep-idemiol 2009; 38(4):963-970.
Frost P, Kolstad HA, Bonde JP. Shift work and the risk of ischemic heart disease - a systematic review of the epidemiologic evidence. Scand J Work Environ Health
2009; 35(3):163-179.
Tenkanen L, Sjoblom T, Kalimo R, Alikoski T, Harma M. Shift work, occupation and coronary heart disease over 6 years of follow-up in the Helsinki Heart Study.
Scand J Work Environ Health 1997; 23(4):257-265.
Costa G, Haus E, Stevens R. Shift work and cancer - considerations on rationale, mechanisms, and epide-miology. Scand J Work Environ Health 2010; 36(2):163-179.
Esquirol Y, Bongard V, Mabile L, Jonnier B, Soulat JM, Perret B. Shift work and metabolic syndrome: respec-tive impacts of job strain, physical activity, and dietary rhythms. Chronobiol Int 2009; 26(3):544-559. Geliebter A, Gluck ME, Tanowitz M, Aronoff NJ, Zam-mit GK. Work-shift period and weight change. Nutri-tion 2000;16(1):27-29.
Lennernäs M, Hambraeus L, Akerstedt T. Shift related dietary intake in day and shift workers. Appetite 1995; 25(3):253-265.
Lowden A, Moreno C, Holmbäck U, Lennernäs M, Tucker P. Eating and shift work - effects on habits, metabolism and performance. Scand J Work Environ
Health 2010; 36(2):150-162.
Waterhouse J, Bailey L, Tomlinson F, Edwards B, Atkin-son G, Reilly T. Food intake in healthy young adults: effects of time pressure and social factors. Chronobiol Int 2005; 22(6):1069-1092.
Morikawa Y, Miura K, Sasaki S, Yoshita K, Yoneyama S, Sakurai M, Ishizaki M, Kido T, Naruse Y, Suwazono Y, Higashiyama M, Nakagawa H. Evaluation of the ef-fects of shift work on nutrient intake: a cross-sectional study. J Occup Health 2008; 50(3):270-278.
1.
2.
3.
4. 5.
6.
7.
8.
9.
10.
11.
12.
13.
14.
15.
16.
17. Collaborators
ES Freitas and R Canuto took part in the analyses and interpretation of data and preparation of this manuscript. RL Henn contributed towards the project and overall outline as well as provided a critical review of the manuscript. BA Olinto and FM Busnello participated in the critical revision and final approval of the text to be published. JBA Macagnan contributed towards the project and overall outline and in data collection. MP Pattussi contributed substantially to the overall project outline. MTA Olinto is the coordinator of the project and overall outline, also researching data or analyzing and interpreting the same, and in providing a critical review and final approval of the text to be published.
Acknowledgements
F
r
e
itas ES
Sudo N, Ohtsuka R. Nutrient intake among female shift workers in a computer factory in Japan. Int J Food
Sci Nutr 2001; 52(4):367-378.
Mekary RA, Giovannucci E, Willett WC, van Dam RM, Hu FB. Eating patterns and type 2 diabetes risk in men: breakfast omission, eating frequency, and snacking. Am
J Clin Nutr 2012; 95(5):1182-1189.
Assis MA, Nahas MV, Bellisle F, Kupek E. Meals, snacks and food choices in Brazilian shift workers with high energy expenditure. J Hum Nutr Diet 2003; 16(4):283-289.
Balieiro LC , Rossato LT, Waterhouse J, Paim SL, Mota MC, Crispim CA. Nutritional status and eating habits of bus drivers during the day and night. Chronobiol Int
2014; 31(10):1123-1129.
Brasil. Ministério da Saúde (MS). Coordenação Geral da Política de Alimentação e Nutrição. Departamento de Atenção Básica. Secretaria de Assistência à Saúde.
Guia alimentar para a população brasileira: promovendo a alimentação saudável. Brasília: MS; 2006.
Brasil. Ministério da Saúde (MS). Conselho Nacional de Saúde. Resolução nº 196 de 10 de outubro de 1996. Diretrizes e Normas Regulamentadoras de Pesquisas Envolvendo Seres Humanos. Diário Oficial da União
1996; 16 out.
Bass J, Takahashi JS. Circadian integration of metab-olism and energetics. Science 2010; 330(6009):1349-1354.
Kaneko SY, Maeda T, Sasaki A, Sato A, Tanaka K, Ko-bayashi T, Tanaka M, Fukushima T. Changes in health habits of female shift workers. J Occup Health 2004; 46(3):192-198.
Gordon NP, Cleary PD, Parker CE, Czeisler CA. The prevalence and health impact of shiftwork. Am J Public
Health 1986; 76(10):1225-1228.
Assis MA, Kupek E, Nahas MV, Bellisle F. Food intake and circadian rhythms in shift workers with a high workload. Appetite 2003; 40(2):175-183.
Waterhouse J, Buckley P, Edwards B, Reilly T. Measure-ment of, and some reasons for, differences in eating habits between night and day workers. Chronobiol Int
2003; 20(6):1075-1092.
Crispim CA, Waterhouse J, Damaso AR, Zimberg IZ, Padilha HG, Oyama LM, Tufik S, de Mello MT. Hor-monal appetite control is altered by shift work: a pre-liminary study. Metabolism 2001; 60(12):1726-1735. Raberg Kjollesdal MK, Holmboe-Ottesen G, Wandel M. Associations between food patterns, socioeconomic position and working situation among adult, work-ing women and men in Oslo. Eur J Clin Nutr 2010; 64(10):1150-1157.
Barros MV, Nahas MV. Health risk behaviors, health status self-assessment and stress perception among industrial workers. Rev Saude Publica 2001; 35(6):554-563.
Olinto MT, Willett WC, Gigante DP, Victora CG. Socio-demographic and lifestyle characteristics in relation to dietary patterns among young Brazilian adults. Public
Health Nutr 2011; 14(1):150-159.
18.
19.
20.
21.
22.
23.
24.
25.
26.
27.
28.
29.
30.
31.
32.
Rombaldi AJ, Silva MC, Neutzling MB, Azevedo MR, Hallal PC. Fatores associados ao consumo de dietas ri-cas em gordura em adultos de uma cidade no sul do Brasil. Cien Saude Colet 2014; 19(5):1513-1521. Figueiredo IC, Jaime PC, Monteiro CA. Factors asso-ciated with fruit and vegetable intake among adults of the city of Sao Paulo, Southeastern Brazil. Rev Saude Publica 2008; 42(5):777-785.
Estaquio C, Druesne-Pecollo N, Latino-Martel P, Dauchet L, Hercberg S, Bertrais S. Socioeconomic dif-ferences in fruit and vegetable consumption among middle-aged French adults: adherence to the 5 A Day recommendation. J Am Diet Assoc 2008; 108(12):2021-2030.
Alves AL, Olinto MT, Costa JS, Bairros FS, Balbinotti MA. Dietary patterns of adult women living in an ur-ban area of Southern Brazil. Rev Saude Publica 2006; 40(5):865-873.
Cheong SM, Kandiah M, Chinna K, Chan YM, Saad HA. Prevalence of obesity and factors associated with it in a worksite setting in Malaysia. J Community Health
2010; 35(6):698-705.
Martin AR, Nieto JM, Ruiz JP, Jimenez LE. Overweight and obesity: the role of education, employment and in-come in Spanish adults. Appetite 2008; 51(2):266-272. Raulio S, Roos E, Mukala K, Prattala R. Can working conditions explain differences in eating patterns during working hours? Public Health Nutr 2008; 11(3):258-270.
Heck FM. Uma geografia da degradação do trabalho: o adoecimento dos trabalhadores em frigoríficos. Rev
Percurso – NEMO 2013; 5(1):3-31.
Vasconcellos MC, Pignatti MG, Pignati WA. Emprego e acidentes de trabalho na indústria frigorífica em áreas de expansão do agronegócio, Mato Grosso, Brasil. Sau-de Soc. 2009; 18(4):662-672.
Franken DL, Olinto MT, Paniz VM, Henn RL, Junquei-ra LD, da SilveiJunquei-ra FG, Roman VR, Manenti ER, Dias da Costa JS. Behavioral changes after cardiovascular events: a cohort study. Int J Cardiol 2012; 161(2):115-117.
Azevedo ECC, Dias FMRS, Diniz AS, Cabral PC. Con-sumo alimentar de risco e proteção para as doenças crônicas não transmissíveis e sua associação com a gordura corporal: um estudo com funcionários da área de saúde de uma universidade pública de Recife (PE), Brasil. Cien Saude Colet 2014; 19(5):1613-1622.
Article submitted 09/06/2014 Approved 23/12/2014
Final version submitted 25/12/2014 33.
34.
35.
36.
37.
38.
39.
40.
41.
42.