M
ASTER
E
CONOMICS AND
M
ANAGEMENT OF
S
CIENCE
,
T
ECHNOLOGY AND
I
NNOVATION
M
ASTER
’
S
F
INAL
T
HESIS
D
ISSERTATION
“F
IRM
’
S INNOVATIVE CAPABILITIES INFLUENCE ON INNOVATION
PERFORMANCE
:
D
IFFERENCES BETWEEN FIRM
’
S AGE AND SIZE
”
F
ÁBIO
M
IGUEL
M
ONTEIRO
G
ONÇALVES
II
M
ASTER
E
CONOMICS AND
M
ANAGEMENT OF
S
CIENCE
,
T
ECHNOLOGY AND
I
NNOVATION
M
ASTER
’
S
F
INAL
T
HESIS
D
ISSERTATION
“F
IRM
’
S INNOVATIVE CAPABILITIES INFLUENCE ON INNOVATION
PERFORMANCE
:
D
IFFERENCES BETWEEN FIRM
’
S AGE AND SIZE
”
F
ÁBIO
M
IGUEL
M
ONTEIRO
G
ONÇALVES
O
RIENTATION:
M
ANUELD
UARTEM
ENDESM
ONTEIROL
ARANJAIV
The aim of this thesis is to study the association between firm’s innovative capabilities and innovation performance and whether they vary according to certain firm’s characteristics. However, one of the major setbacks relies on the choice of variables required to measure all the dimensions discussed in the literature and on how to ensure that these variables represent reliable and interpretable factors in order to obtain a complete assessment of firm’s innovative capabilities. Thus, this thesis follows the complementary model developed by Zawislak et al. 2012 but is only focused on dynamic capabilities (Alves et al 2017). The contribution of this thesis is the inclusion of many variables that enable the assessment of how firm’s innovative capabilities differ according to their age and size.
The theoretical model consisted of 17 variables distributed into 4 factors: Development of Technology, Strategy, Transactional and Management capability. To meet research objectives, a questionnaire was sent to firms in the Portuguese Manufacture Industry and 381 responses were collected. An Exploratory Factor Analysis led to three statically significant factors but the Management Capability is not significant on firms’ Innovative Capabilities (IC) and Innovation Performance (IP). The association between IC and IP was weak but positive and nonparametric tests revealed significant differences in distribution of the factors according to firm’s age and size.
V
Esta tese estuda a associação entre as “innovative capabilities” das empresas e a performance em inovação das mesmas, e se estas variam consoante a idade e dimensão da empresa. O problema é saber quais as variáveis que devem ser incluídas de modo a que se quantifique todas as dimensões discutidas na literatura, e como se deve organizar estas variáveis para que se avalie de forma completa as “firm’s innovative capabilities”. Este trabalho segue o modelo desenvolvido por Zawislak et al. 2012 focando-se apenas naquelas “capabilities” que são dinâmicas (Alves et al. 2017). É o principal contributo, pois permitiu a inclusão de muitas variáveis e permitiu perceber como estas variam em relação à idade e dimensão das empresas.
O modelo teórico consiste em 17 variáveis distribuídas por 4 factores: “capability” de Desenvolvimento Tecnológico, Estratégico, Transacional e de Gestão. Para ir de encontro aos objectivos de investigação, um questionário foi enviado para empresas da Indústria Transformadora Portuguesa e foram obtidas 381 respostas. A Análise Fatorial Exploratória originou resultados estatisticamente significativos para três factores, enquanto que a “Capability” de gestão não é significativo sobre as “innovative capabilities” (IC) e sobre a performance da inovação (IP) para as empresas da amostra. A associação entre IC e IP é fraca, mas positiva e, através dos testes não paramétricos, descobriu-se que existem diferenças na distribuição dos factores para as empresas tendo em conta as suas características.
Palavras-Chave: “Capabilities” inovadoras; Performance em Inovação; Idade da
VI AVE – Average Variance Extracted
CR – Compositive Reliability
DC – Development of technology Capability EFA – Exploratory Factor Analysis
EO – Entrepreneurial Orientation HR – Human Resources
IC – Innovative Capability IP – Innovation Performance KMO – Kaiser-Meyer-Olkin
KIBS – Knowledge Intensive Business Services KW – Kruskal-Wallis MC – Management Capability MW – Mann-Whittney RBV – Resource-Based View SC – Strategy Capability TC – Transactional Capability
VII
1. Introduction ... 1
2. Literature Review ... 2
2.1 Innovative Capabilities: perspectives and capabilities. ... 2
2.2 Complementary and Dynamic Innovative Capabilities ... 4
2.2.1 Development of technology Capability... 5
2.2.2 Strategic Capabilities ... 7
2.2.3 Transactional Capabilities ... 8
2.2.4 Management Capabilities ... 10
2.3 Firm’s Innovation Performance and Innovative Capability ... 12
2.4 Heterogeneity among firms ... 13
2.4.1 Firm’s Age ... 14
2.4.2 Firm’s Dimension ... 15
3. Methodology ... 16
3.1 Context and Sample ... 16
3.2 Instrument Design ... 18
3.3 Instrument Validation ... 19
3.4 Influence of Firm Age and Dimensions ... 21
4. Results ... 22
4.1 EFA: Innovative Capabilities and Innovation Performance... 22
VIII
7. Future Research ... 30 8. References ... 31 9. Appendix ... 37
IX
Table I DC variables ... 6
Table II SC variables ... 7
Table III TC variables ... 9
Table IV MC Variables ... 11
Table V. Number of surveyed firms ... 17
Table VI. Kaiser-Meyer-Olkin (KMO) ... 22
Table VII Item’s Communalities ... 23
Table VIII Factor loadings, Cronbach Alphas, AVE and CR ... 24
Table IX Factor Correlation Matrix ... 25
Table X Firm's age influence on IC and IP ... 25
Table XI Firm's size distribution diferences among all groups... 26
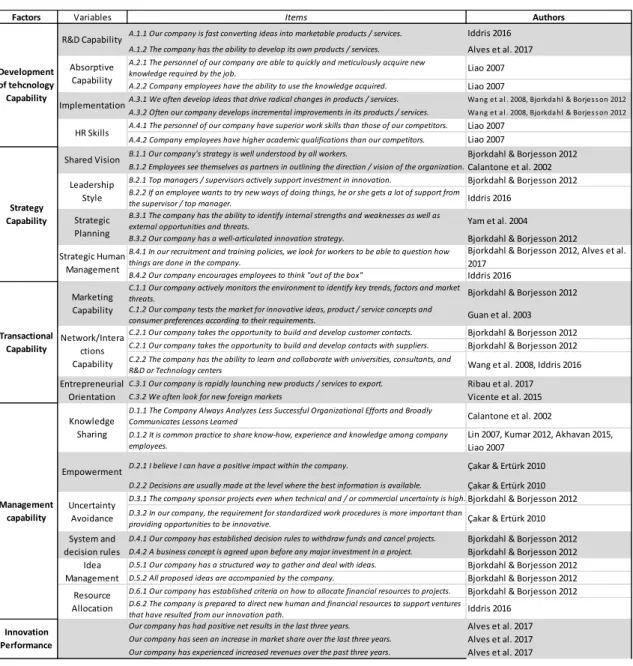
Table XII Items of the questionnaire ... 37
Table XIII Eigenvalues and Cumulative % of Variance... 38
Figure List
Figure 1 Complementary and Dynamic ICs ... 41
1. Introduction
Innovation involves uncertainty, and sometimes, wrong directions and unexpected problems which provide learning opportunities to firms leading to an improvement of their capabilities (Bjorkdahl & Borjesson 2012). It also involves how certain firm’s characteristics influence their responses to these changes in the form of the possession of different capabilities (e.g. Alves 2017) that can vary according to their age (e.g. Calantone et al. 2002, Coad et al. 2016) and size (Liao et al. 2007, Yam et al., 2011).
In order to face this uncertainty, firms’ innovative capabilities (IC) are important in providing and sustaining their competitive advantage (Guan & Ma, 2003). Thus, it is crucial that firms keep evolving and continue to develop their capabilities according to new market demands (Zawislak et al. 2012). However, ICs are complex and difficult to establish, since their development depends on firm’s lower-level routines and capabilities (Coad et al. 2016).
The existing literature on capability is very broad and does not provide much information on what firms need to develop in order to increase innovation performance (IP), i.e. how to assess how good or bad they are at innovation (Bjorkdahl & Borjesson 2012). It is important to measure IC through a multidimensional construct, which is more reliable than using one generic concept, since it enables the capture of complementarities among ICs key dimensions (Vicente et al. 2015).
The aim of this thesis is to obtain a theoretical model that accommodates these multidimensional constructs with the variables tested in the literature. It enables the identification and modelling of ICs that drive firms’ innovation performance (IP) by presenting the building blocks, assumptions, and validity of the firm’s capability-based model (Alves et al. 2017).
The specific aims are to include tested variables in the IC model, to assess if there is an association between IC and IP and to determine how firm’s size and age affect the IC
2
and IP of the surveyed firms. To meet these objectives the Portuguese Manufacturing Industry was sampled allowing to answer the following questions:
1. What are the underlying ICs of the Portuguese Manufacturing Industry?
2. Do firms with higher ICs have a stronger IP?
3. Are there any differences between companies’ ICs and IP regarding their ages and size?
The model used was based on Alves et al. (2017) using a complementary and dynamic perspective of ICs. An Exploratory Factor Analysis (EFA) was performed since there was no information on statistical significance of the variables studied. Then non-parametric tests were done to assess the differences between the surveyed firm’s IC and IP regarding age and size.
Section 2 discusses the literature about ICs showing which dimensions must be considered and how they vary across companies with different IPs, ages and sizes. Section 3 discusses the methodological procedures used and results are addressed in section 4. Section 5 presents the results and the main conclusions. Finally, section 6 and 7 discusses the limitations and future research.
2. Literature Review
2.1 Innovative Capabilities: perspectives and capabilities.
Capabilities are complex patterns of routines, skills and accumulated knowledge that over time come to be embedded as organisational routines and practices (Teece et al., 1997).
In the Resource-Based View (RBV) routines are the building blocks of capabilities and knowledge, individual skills, equipment or systems and some specific technical inputs are the building blocks of routines (Alves et al. 2011). This perspective describes a firm as an idiosyncratic (i.e. distinct from other) bundle of resources and capabilities that enable it to achieve competitive advantage and superior IP (Vicente et al. 2015). The
3
resources and capabilities of the firm are in a hierarchical order where the resources are the foundation of the firm and the basis for its capabilities (Alves et al. 2017).
According to this theory, a firm outperforms its competitors not because it has more or better resources, but because it has distinctive capabilities that allow it to make the best use of its resources (Vicente et al. 2015).
However, it has been acknowledged that companies cannot rely solely on existing capabilities and need continually to develop new ones – they need ‘dynamic capabilities’ (Borjesson & Elmquist 2011) – because ICs become irrelevant over time (Wetering et al. 2017).
The term “capabilities” emphasises the key role of strategy and management in appropriately adapting, integrating and reconfiguring organisational skills, resources and functional competences to match the requirements of a changing environment (Assink 2006). The dynamic capabilities are elements of ‘third-order’ emphasizing the behavioural orientation of the firm’s constant pursuit of the renewal, reconfiguration and re-creation of resources and capabilities to address the environmental change through a learning process (Alves et al. 2011).
In sum, IC should be defined in wide disperse scopes and levels in order to deal with the requirements of the firm’s strategy and accommodate special conditions and competition environment (Guan & Ma, 2003) – RBV. Meanwhile, through the selection of appropriate mechanisms to maximize the opportunities for learning, ICs can describe and explain how organisations change and develop (Bjorkdahl & Borjesson 2012) – Dynamic Capability View.
This study defines IC as the skills and knowledge needed to effectively absorb, master and improve existing technologies, and to create new ones (A) (e.g. Romijn & Albaladejo, 2002) by aligning the strategic orientation (B) with innovative behaviours and technological processes (e.g. Vicente et al. 2015). It involves internal capabilities to interpret market, to respond and interact appropriately with the external environment (e.g. Alves et al. 2017) and with technological knowledge (C). Additionally, it also
4
includes coordination of all internal and external stakeholders, resources and capabilities within the innovation process (D) (e.g. Zawislak et al. 2012). Each of these elements is necessary, to create a superior IC (Teece et al. 1997, Zawislak et al. 2012).
The firm must develop a set of complementary capabilities to deal with innovation (Zawislak et al. 2013). This is shown in Figure 1: Development Technology Capability - DC (A); Strategy Capability - SC (B); Transactional Capability – TC (C); and Management Capability - MC (D).
2.2 Complementary and Dynamic Innovative Capabilities
In practice, some of the studies reveal that potentially important variables for IC evaluation are omitted or excluded, affecting the explanatory power of the evaluation systems created (Castela et al. 2018). The following model aims at including most of the variables described in the literature organizing them according to Figure 1.
Briefly, the DC is defined as the knowledge and skills required for firms to choose, install, operate, maintain, adapt, improve and develop technologies (Albaladejo & Romijn, 2000). It requires efficient search routines and the ability to change, create, and recreate operations (Alves et al. 2017), which Teece (2007) defines as dynamic capability.
The SC is the capacity to adopt different types of strategies that adapt the firm to environmental changes (Guan & Ma, 2003). The SC also represents the firm’s ability to use resources in accordance with strategic routines, enabling the firm to achieve new resources
Own Conceptualization
5
configurations as markets emerge, collide, split, evolve, and die (Wetering et al. 2017). The TC involves finding the sources of complementary assets and necessary channels to bring technological development to the market. Thus, firms should have specific capabilities to trade their products (Alves et al. 2017). Firms must also continuously scan for information in the market and search for ways to reduce transactions costs, which constitute a dynamic capability (Alves et al. 2017).
At last, every firm has its limits, but to overcome them, technology must be enhanced, and managerial routines should also be enlarged through management novelty. It triggers a learning process meaning that it is a dynamic capability (Zawislak et al. 2012, 2013; Alves et al. 2017). By doing this, a firm is certainly innovating (Zawislak et al. 2012, 2013).
2.2.1 Development of technology Capability
The basic assumption is that DC is a result from the learning process that leads to the ‘development’ of new processes and products/services (Zawislak et al. 2013). This is responsible for leading the process of application of knowledge to solve specific problems of a specific market (Zawislak et al. 2014). Thus, DC is the ability to sense technological options and decipher novel market solutions by scanning, creating, learning, and interpreting different signals (Alves et al. 2017).
The level of the companies’ IC is positively associated with ongoing in-house technological efforts (Romijn & Albaladejo, 2002). This means that a high IC employs a learning-by-doing effect (Cavusgil et al. 2003). This know-how is further exacerbated by the large tacit of knowledge production (Cavusgil et al. 2003). Thus, the importance of technological improvement is required to increase the DC of the innovative company (Abereijo et al. 2007), by improving R&D Capability (A.1).
One way to develop this capability is to enhance the firm’s absorptive capacity (A.2) (Assink 2006) since this seems to be a result of the ability with which firms absorb and internalize new knowledge to produce technological change (Zawislak et al. 2012). A firm’s absorptive capacity tends to develop cumulatively, it is path dependent and builds
6
on existing knowledge (Lin 2007, Liao et al. 2007). Liao et al. (2007) showed that absorptive capacity has a significant positive effect on IC.
Table I DC variables
Wetering et al. (2017) argues that there is an alignment between firm’s IC and absorptive capacity dimensions for radical and incremental capabilities. On one hand, an incremental capability is defined as an organization’s ability to generate innovations that refine and reinforce existing products and services (Wetering et al. 2017). On the other hand, radical capability is the ability of an organization to generate innovations that substantially transform existing products, services, and technologies (Wetering et al. 2017). To include these variables in the model, Bjorkdahl & Borjesson (2012) refer to
implementation (A.3).
All these dimensions of DC arise from what the entrepreneur(s) and workforce bring with a certain stock of knowledge and skills into the firm, which they obtained through earlier experiences (Abereijo et al. 2007). Employees’ ability (A.4) reflects this point (Liao et al., 2007).
With the right human resources (HR), firms can acquire the widest variety of skills and the maximum likelihood in attaining new competences to explore innovations (Ayub et al. 2017). That is, the knowledge, abilities and skills necessarily required for innovation rest with and are implemented by individuals (Ayub et al. 2017). Meaning that the relationship between HC and IC is positive (Ayub et al. 2017).
Source: Own Conceptualization
Variable Definition
R&D Capability Ability to embrace many novel technologies and approaches when developing new technological assets (Guan & Ma, 2003)
Absortive Capacity
Refers to the ability to recognize the value of new information, to assimilate it, and apply it to comercial ends (Liao et al. 2007) Implementation
Firm’s ability to develop a new idea into a concept or a new offer. This element includes whether the firm develops incremental or radical changes in products, services, processes and ideas that lead new business (Bjorkdahl & Borjesson, 2012).
Employees’ ability
Prior knowledge base of employees. For example, it is HC educational background and acquired job-related skills (Liao et al. 2007)
7 2.2.2 Strategic Capabilities
O’Connor et al. (2008) argues that developing ICs ‘require that the major innovation system objectives are tightly and reciprocally coupled to the firm’s strategic intent’ (O’Connor et al. 2008). Strategy capability (B) denotes the firm’s ability to formulate, implement, and monitor its innovation strategy (Vicente et al. 2015).
Table II SC variables
Often great ideas fail to be translated into action because of diverse interests in the organization (Calantone et al. 2002). A clear direction for learning helps individuals to know what to learn and it is likely to form an organizational strength or even a core competence (Calantone et al. 2002). Top management must provide a clear strategic direction for the organization to ensure that its members do not apply their own interpretations regarding what is needed to be done (Borjesson & Elmquist 2011) –
shared vision (B.1). This is crucial for firm’s IC (Calantone et al. 2002).
A supportive top management allows organisational individuals to do experimentation and encourage the exchange of new ideas and knowledge (Ayub et al. 2017). Top management support comes with transformational leadership (B.2), which is a strategic variable (Ayub et al. 2017). For innovative behaviour in the organisations, leaders' traits and leadership style are critical to influencing the individual creative
Source: Own Conceptualization
Variable Definition
Shared Vision
Organization-wide focus on learning that coordinates various departments and enhances the quality of learning (Calantone et al. 2002).
Transformational Leardership
Serves the purpose of promoting organisation innovation and learning and it stimulates followers dominantly to create innovation and knowledge (Ayub et al. 2017).
Strategic Planning
Ability to identify internal strengths and weaknesses and external opportunities and threats, formulate plans according to corporate vision and missions, and adjusts the plans for implementation (Yam et al. 2004).
HR strategic management
Strategic approach to decision making and planning associated with employment and the strategy, policies and practices of recruitment, training, development, performance management, compensation and relationships between employees (Ayub et al. 2017).
8
capability (Ayub et al. 2017). O’connor et al. (2008) includes leadership as one of the elements of firm’s ICs.
These two variables ease the formulation and implementation of firm’s strategic
planning (B.3) by making it clearer and learning oriented. By combining formal and
flexible approaches, firms overcome organizational inertia and break old routines that often hinder innovation (Vicente et al. 2015). It relates with IC and managers can assure that strategic capability enables the firm to recognize and respond to environmental changes (Vicente et al. 2015).
However, it requires a certain type of individuals that possess the capability to detect the difference between existing facts and what they intend to achieve (Ayub et al. 2017).The goal is to challenge status quo through competent HR, raise questions and alter the existing norms and practices through novel solutions (Ayub et al. 2017). These individuals try to convert such creative friction to an innovative impetus that allows them to achieve the intended vision (Ayub et al. 2017). Hence, in order to achieve optimum results HR management should be conducted strategically (Ayub et al. 2017).
Strategic HR management (B.4) might be a good predictor for IC of the firm (Aryanto et
al. 2015).
2.2.3 Transactional Capabilities
Transactional capability (C) is represented by a set of abilities, knowledge and
routines that the firm develops aiming at reducing its marketing cost, trading (e.g. exporting), partnerships, logistics and distribution - transaction costs (Zawislak et al., 2012).
This may enable gathering of information regarding technologies and markets, and for obtaining various other inputs to complement the internal learning process (Abereijo et al. 2007). Specifically, the Marketing capability (C.1) is a key factor to analyse market signals and alignment of the firm’s offerings with the customer needs and expectations (Zawislak et al. 2014). This plays a key role in IC and introduces product/service
9
innovations in the best place, at the right moment, and at a suitable price (Ferreira et al. 2018).
Table III TC variables
Obtaining knowledge from the outside is an efficient way of improving IC since one of the characteristics of tacit knowledge is that it is not equally available for all competitors (Cavusgil et al. 2003). This happens when firms interact with customers, suppliers and Knowledge-Intensive business services (KIBS) (e.g. consultancy firms, research institutes, and universities), that provide services that add a high level of intellectual value to the firm (Yam et al. 2011).
This stimulates those network-enabled capabilities (C.2) that develop knowledge partially through firm interaction with external stakeholders (Zaheer & Bell, 2005). This represents the acquisition of knowledge external to the firm and the integration of such knowledge with the firm’s own since TC links the firm to its external environment (Zawislak et al. 2014).
Moreover, through the openness and predisposition to enter new foreign markets and, in order to trade abroad, innovative firms can transform resources and redesign processes and structures to enter new international markets (Ribau et al. 2017). These firms can generate a self-reinforcing cycle through proactive motivations that underpin export performance through proper market exploitation of ICs (Ribau et al. 2017),
Source: Own Conceptualization
Variable Definition
Marketing Capability
Capacity to publicize and sell products based on understanding consumers’ current and future needs, customers’ access approaches, and competitors’ knowledge (Ferreira et al. 2018)
Network-enable capabilityies
Ability to build and develop alliances and relationships with external actors such as customers, suppliers, competitors, universities and others Knowledge intensive institutions (KIBS), and the ability to absorb external knowledge and to open up the firm to new stimuli and experiences (Bjorkdahl & Borjesson, 2012).
Entrepreneurial Orientation
Assists entrepreneurs/managers in identifying and exploiting opportunities in international markets (Ribau et al .2017). It also involves a proactive approach to identifying overseas markets, and is linked to managers’ global vision and competitive posture (Ribau et al .2017).
10
reduce transaction costs abroad and ease global competition for the innovative firm (Alves et al. 2017).
This is included in the variable Entrepreneurial Orientation (EO) (C.3). EO is a multifaceted capability which has been related to the appropriation of ICs (Ribau et al. 2017) since there is an interdependence relationship between the total improvement of IC and export growth (Guan & Ma 2003, Ribau et al. 2017).
2.2.4 Management Capabilities
The ability of knowing how to increase a firm’s managerial functions and mechanisms in terms of improving managerial efficiency becomes an IC (Liao et al., 2007).
Management’s capabilities (D) require a wide range of skills, which should be flexibly
applied in problem-solving to cope with various and often unpredictable circumstances (Zawislak et al. 2012). The firm must guarantee that the appropriate procedures will be applied and, therefore, should have the specific ability to coordinate assets and activities; management capability (MC) is responsible for this task (Alves et al. 2017).
In general, MC is the ability to implement new managerial regulations, systems, methods, social and cognitive developments, through the task of coordination (Teece 2007). To fulfil these scopes this thesis includes Knowledge Sharing (Lin 2007), Empowerment, Uncertainty Avoidance (Çakar & Ertürk 2010), Idea Management, System and Decision and Rules (Bjorkdahl & Borjesson 2012) and Resource Allocation (Yam et al. 2011).
Knowledge sharing (D.1) processes consist of both employee willingness to actively
communicate with colleagues (i.e. knowledge donating) and actively consult colleagues to learn from them (i.e. knowledge collecting) (Lin 2007). The outcome of these processes depends on the degree of knowledge effectively shared (Lin 2007). Consequently, knowledge sharing is significantly associated with IC (Lin 2007).
Furthermore, empowerment (D.2) is focused on management practices designed to “empower” employees. Empowerment should make people feel: (i) they possess a certain degree of autonomy and power in decision-making; (ii) less constrained by
rule-11
bound aspects; and (iii) they are self-effective. These combined features enable people to be innovative (Çakar & Ertürk 2010). Thus, empowerment is considered an antecedent of IC (Çakar & Ertürk 2010).
Table IV MC Variables
Low uncertainty avoidance (D.3) societies tend to take easier risks, are relatively tolerant to different behaviour and opinions and are highly influenced by technology,all these traits encourage innovation (Çakar & Ertürk 2010).
High uncertainty avoidance cultures will not take avoidable risks and only adopt innovations if their effectiveness and value have already been proven (Çakar & Ertürk 2010). One significant characteristic of innovative firms is the willingness to take risks (Yang 2012). By taking advantage of such risk-taking propensity, with effective tools, a firm can position itself well in enhancing IC (Yang 2012).
Consequently, these MC dimensions shape firm’s system and decision rules (D.4) towards innovation, influencing managerial cognition to understand the resources that the company lacks and needs to develop. Specifically,it is the need for management
Source: Own Conceptualization
Variable Definition
Knowledge Sharing
Captures, organizes, reuses, and transfers experience-based knowledge that resides within the organization and making that knowledge
available to others in the business (Lin 2007) Empowerment
Energizing process that expands feelings of trust and control in one as well as in one’s organization, which leads to outcomes such as enhanced self-efficacy and performance (Çakar & Ertruk, 2010)
Uncertainty Avoindance
Concerns the degree to which organization members want to avoid ambiguity and uncertainty in favor of clear goals and operating guidelines (Çakar & Ertruk 2010).
Systems and decisions rules
Criteria used for decision-making, or the mindsets of the decision makers whether the firm has a business concept prior to a major investment in a project, if there are established rules for withdrawing resources and cancelling projects (Bjorkdahl & Borjesson 2012). Idea
Management
Systems, structures, and routines in place to support the search for and generation of ideas, and their management within the organisation (Bjorkdahl & Borjesson2012).
Resource Allocation
refers to how well a firm managed its human and capital investments made to support innovation activities (Yam et al. 2011).
12
cognition regarding current status (Bjorkdahl & Borjesson 2012). These routines help accelerating the innovation process, positively influencing IC (Borjesson & Elmquist 2011).
Idea management (D.5) considers that ideas may flourish in the organisation but may
not be systematically evaluated and promoted; employees may find it difficult to know which person or function to communicate ideas to (Bjorkdahl & Borjesson 2012). To launch idea-generating activities is not enough to become more innovative; it is also necessary to consider the whole process of how the idea is evaluated, developed, integrated and implemented (Borjesson & Elmquist 2011).
Finally, resource allocation capability (D.6) includes capital capabilities that comprise the necessary conditions to guarantee that firms advance their technological capabilities (Yam et al. 2004), optimal capital allocation, intensity of capital input (Guan & Ma, 2003). Yam et al. (2004) found this to be a significant predictor of ICs.
2.3 Firm’s Innovation Performance and Innovative Capability
As positioned by the RBV of the firm, the capabilities by which firms acquire and deploy innovation resources are key to explain different IP in the same industry (Vicente et al. 2015). However, the importance of Dynamic Capabilities is unquestionable, since this empowerment for change makes firms better adapted to more aggressive external environments, through new combinations of existing resources or even new combinations of new resources, which is the only way to achieve sustainable competitive advantages increasing IP (Ferreira et al. 2018).
IP measurements should consider how these internal capabilities contribute to the firm’s IP (Alves et al. 2017) and how important is their complementary nature for a greater IP (Zawislak et al. 2012). IP corresponds to economic gains that arise from the introduction of new products, processes, equipment, organizational forms, and commercial market approaches that lead to extraordinary profits (Alves et al. 2017). This is measured by the increase of net income, market-share and sales.
13
Regarding the relationship between IC and IP, this study follows literature suggestions arguing that the first will positively and directly influence the latter (Calantone et al. 2002, Yam et al. 2011, Alves et al. 2017, Ferreira et al. 2018, etc.). In most circumstances, high-performance firms have stronger capabilities compared to low performance firms (Yam et al. 2004). Hence, the association between IC and IP is clearly positive based on literature suggestions.
2.4 Heterogeneity amongfirms
Firms hold heterogeneous resource portfolios and interior capabilities (Guan & Ma, 2003), which in turn will cause different rates of IP (Yam et al. 2011, Ferreira et al. 2018, etc.). Possessing different ICs would indicate different rates of IP. Thus, companies can be described based on their predominant capability (Zawislak et al. 2013, 2014):
• The Technological firm develops new technology, new products and new operational solutions through a strong R&D department (Zawislak et al. 2014). Therefore, products are differentiated and have their value perceived by the market as novelty (Zawislak et al. 2014);
• The Strategic company consciously and systematically applies an expressed intent with respect to innovation and the extent to which it is known and understood throughout the firm (Bjorkdahl & Borjesson 2012);
• The Transactional firm innovations come much more from the commercial department rather than from the technological area (Zawislak et al. 2014). This company develops products by monitoring market trends and usually searches for the consumer’s immediate satisfaction (Zawislak et al. 2014);
• The Managerial company is heavily based on organizational integration and coordination of resources rather than on a specific capability (Zawislak et al. 2014). In that sense, it is a professionally managed company being able to solve complex management problems (Zawislak et al. 2014).
14
However, in order to understand how such companies, emerge, the literature can be analysed in order to identify many reasons why these types of firms exist. This study focuses on how firm age and size influence ICs and IPs.
2.4.1 Firm’s Age
Older firms are more likely to employ knowledge learned and convert it into innovation activities, while younger firms need to establish an efficient mechanism for rapidly internalizing knowledge (Calantone et al. 2002). The challenge is for young firms, starting from scratch, to quickly set up not only everyday operating routines but also higher-level ICs (Coad et al. 2016). New firms, devoid of routines, must quickly design and implement routines and must rapidly accumulate valuable tacit knowledge (Coad et al. 2016).
Previous empirical evidence indicates that new firms typically need time to accommodate to the situation within which they operate and improve their internal capabilities (Coad et al. 2016). This suggest the rejection of the following null hypothesis:
(1) H0: Young firm’s ICs have the same distribution as older Firms (2) H1: Young firm’s ICs have different distributions from older firms
Additionally, there is evidence on the positive effect of firm age on the likelihood of superior and innovative outcomes (Calantone et al. 2002) due to organizational inertia which constrains the firm’s ability to change, potentially hindering learning effects (Coad et al. 2016). This indicates that the firm’s experience may generate obsolescence if the directions of search activities upon which mature firms have embarked are not well suited to the contemporaneous technological landscape (Coad et al. 2016).
Consequently, this suggests that innovation undertaken by young firms is riskier and the returns are unevenly distributed, while the innovation efforts of older firms are more predictable (Coad et al. 2016). Therefore, this would lead to the rejection of the following null hypothesis:
15
(3) H0: The distribution of younger firms in IP is the same as the distribution
for older firms
(4) H1: The distribution of younger firms in innovation performance differs
from the distribution for older firms
2.4.2 Firm’s Dimension
Firm’s size affects the endowment of important inputs for the innovation process since large companies tend to have more resources, which facilitates the enhancement of their IC and IP (Yam et al. 2011).
Firm’s size can directly affect the way firm’s ICs develop and change (e.g. Çakar & Ertürk 2010). Small firms can better understand, assimilate knowledge flows and have fluid communication between managers and lower level employees; thus, IC is more likely to increase directly via close employee–manager relationships (Çakar & Ertürk 2010). On the other hand, in larger companies’ IC is more likely to be facilitated and increased through formal procedures of employee participation and knowledge sharing (Çakar & Ertürk 2010).
One possible explanation is that the family-like environment in small firms implies that managers are concerned with and involved in the professional, as well as personal lives, of their subordinates (Çakar & Ertürk 2010). This is not possible in larger firm’s environment. Hence, these examples lead to the formulation of the following hypothesis which is expected to be rejected:
(5) H0: The distribution of ICs for SMEs is the same as the distribution for
Large companies
(6) H1: The distribution of ICs for SMEs is different from the distribution from
Large companies
Small firms have less human and financial resources, yet the benefits of innovation projects in small firms could not be identified easily (Yam et al. 2004). In larger firm’s innovation activities are more productive as a result of numerous complementary
16
activities, e.g. between R&D and other functional activities, such as marketing and manufacturing (Çakar & Ertürk 2010).
For instance, Oluwajoba (2007) suggests that large corporations and the research institutions are good breeding grounds for SME entrepreneurs who will be able to run and develop knowledge-based and innovation-driven companies. Thus, this would improve the ICs and IP in their own firms Oluwajoba (2007).
There is an urgency for small firms to acquire human resources, capital and technology so the results of their efforts in innovation would lead to better performances (Yam et al. 2004). Hence, this suggests the rejection of H7:
(7) H0: SMEs IP has the same distribution as the performance by the larger
firms
(8) H1: SMEs IP distribution differs from larger companies’ performance in
innovation
All the null hypotheses are expected to be rejected according to literature hints. Research procedures and calculations are explained below.
3. Methodology
3.1 Context and Sample
The target population is the Portuguese Transformation Industry. Firms’ contacts were obtained with Amadeus database and Google Forms was used to develop the survey. The sample was collected through a random sampling technique which maximizes the likelihood of selecting cases that represent the total population (Rowley 2014).
Companies were contacted by email because they were geographically dispersed. Then an incentive was offered in the form of a follow-up report with the results of the study (Vicente et al., 2015).
17 ▪ Firm Status, if the firm is active; ▪ Firm’s country, which is Portugal;
▪ Firms with known values of Net income, Sales and Number of employees in the last 3 years, excluding companies with no recent financial;
▪ All companies with e-mail addresses in Amadeus’ database; ▪ And firms with latest year of Accounts of 2018, 2017 and 2016.
The questionnaire reached 381 responses with an average response rate of 7%. It is close to 10% which is expected considering the circumstances of surveying the population for the first time (SurveyMonkey 2019). A sample of 385 cases is statistically significant for population of 10000 cases with a 95% confidence interval (SurveyMonkey, 2019).
Hence, this study is statistically significant because it collected 381 responses from a population of 5644 businesses. Moreover, a sample size around 400 is often regarded as optimal (Rowley 2014), which makes research more robust, offers opportunities for generating a wider range of insights (Rowley 2014) and constitutes a prerequisite for EFA (Hof 2012).
The population included firms from 8 sectors (Banco de Portugal, 2018):
• Low technology intensity (LT) - manufacture of food products and manufacture of paper and paper products (27%, Table V);
• Low-medium technology (LM-T) - manufacture of rubber and plastic products and manufacture of fabricated metal products, except machinery and equipment (60%, Table V);
Table V. Number of surveyed firms Sector Population Population
in % Number of responses Responses in % Response rate LT 1532 27% 102 27% 7% LM-T 3370 60% 200 52% 6% HM-T 583 10% 60 16% 10% HT 159 3% 19 5% 12% Total 5644 100% 381 100% -Avg % response - - - 7% Weighted Avg. - - 6%
18
• High-medium technology (HM-T) - manufacture of chemicals and chemical products and manufacture of electrical equipment (10%, Table V);
• High technology (HT) - manufacture of basic pharmaceutical products and pharmaceutical preparations and manufacture of computer, electronic and optical (3%, Table V).
According to OECD firm’s size is determined by the number of employees. As figure 2 shows: 42.1% of respondents worked for Micro companies which have less than 10 employees; 41,8% worked for small companies (with 10-49 workers); only 11,9% for medium-sized firms (between 50-249 employees); and 4.2% (with over 250 workers) worked in large firms. The average age of surveyed firms is 26 years of activity.
Firms decided which worker responded to the questionnarire. Consequently, 76,6% of respondents are managers, owners, directors and administrative, but only 4 respondents work as I&D directors.
However, due to limited resources this approach did not hinder representativeness of sampled firms. The objective is to capture the ability of respondents to describe their own firms’ reality regarding IC and IP.
3.2 Instrument Design
The first step consisted of identifying variables in the literature to build the questionnaire constructs, in order to ensure content validity (Iddris 2016). Afterwards, 3 ICs were selected from the complementary capability framework (Zawislak et al. 2012) and SC was selected from the dynamic capability’s perspective (Assink, 2006), since these two are connected (Alves et al. 2017).
Figure 2 Sampled firm's size
19
The instrument is an anonymous questionnaire written in Portuguese. The questionnaire is divided in 3 blocks (see Table XII, Appendix): first block consisted of four descriptive questions such as firm’s age, sector, number of employees and job position of the respondent; the second block is divided in 4 expected factors with 35 items in total; and fourth block consisted of 3 questions regarding IP (Alves et al. 2017).
The second block intends to assess each firms’ ICs and captures the existence of the routines and specificities by using an interval scale, from one to five, to measure the degree to which respondents agree with the statements (Alves et al. 2017). The third block evaluates the change and innovation measuring the growth rate of economic indicators over the previous three years (Alves et al. 2017). Sales, market share and net results were measured by a 5-point Likert scale from 1 (Strongly disagree) to 5 (Strongly agree).
Three pilot interviews were held with three representative respondents with management functions. The aim was to obtain feedback regarding the questionnaire organisation and wording that encouraged respondents to provide accurate, unbiased and complete information. It enabled the evaluation of characteristics like response time, ambiguity, phrasing, adequacy of the instructions to interviewers, consistency and clarification of the items.
This helped identifying the basic intelligibility format and uncover the weaknesses and problems of the questionnaire (Yam et al. 2004). It also helped to obtain a small perspective of potential respondents (Rowley 2014). Then, the questionnaire was sent to companies during three weeks with two reminders addressed to firms that did not responded. It was essential to come close to 400 responses.
3.3 Instrument Validation
All statistical procedures were done with IBM SPSS Statistics Software. Firstly, descriptive measures like mean, median, skewness and kurtosis were calculated for each item to assess their distribution. This showed non-normality as expected, since all items represent qualitive variables (Marôco 2014). Afterwards, Spearman correlation was
20
obtained in order to flag problems regarding multicollinearity and non-significant correlations. No correlations higher than 0.9 were found but items D.3.2 and D.4.1 possessed non-significant correlations originating their removal of the analysis (Samuels 2016).
All calculations were done with ranked values of the items because Spearman correlation corresponds to Pearson correlation ranks (Marôco 2014). This calculates the Pearson correlations on the variable order and not on the original variables enabling the EFA for qualitive variables (Marôco 2014).
This study considers various authors’ suggestions for threshold values and criterias that determine a good EFA model. They concerned the determinant of the correlation matrix, Kaiser-Meyer-Olkin (KMO), the eigenvalues, total Variance Explained, Communalities, the simple structure of factor loadings (Um et al. 2011, Yong & Pearce 2013, Rowlett 2014, Marôco 2014, Samuels 2016).
First step was to obtain a determinant greater than 0,00001 (Samuels 2016). A lower score might indicate that groups of three or more questions have high intercorrelations (Samuels 2016). Next, adequacy of the data to factor analysis was tested through KMO and Barlett test of sphericity (Yong & Pearce, 2013). At last, following IC theory guidelines and data characteristics the extraction and rotation methods were selected. On one hand, the extracted method is the Principal Axis Factor, which is based on the notion that all variables belong to the first group and when the factor is extracted, a residual matrix is calculated (Yong & Pearce, 2013). Principal Axis Factor is recommended when the data violate the assumption of multivariate normality (Yong & Pearce, 2013), which is the case in this study.
On the other hand, rotation is responsible for obtaining a simple structure which attempts to have each variable load on as few factors as possible but maximizes the number of high loadings on each variable (Yong & Pearce, 2013). This eases and enables the interpretation of factors. In order to assess how each IC factor correlates to firm’s IP, the rotation method used was Direct oblimin, which is an oblique method that allows
21
the factors to correlate (Yong & Pearce, 2013). Oblique rotation produces a pattern matrix that contains the factor or item loadings, a structure matrix with the item correlations to the factors (Yong & Pearce, 2013).
Finally, all constructs’ internal consistency was evaluated with the Cronbach alpha. The convergent validity was evaluated through the Composite Reliability (CR) and Average Variance Extracted (AVE). Discriminant validity was obtained with the square roots of AVE (Iddris 2016)
Cronbach’s alpha coefficient was used to verify the reliability of data, measuring the correlation between questionnaire responses by analysing the respondents’ answers, with an average correlation between items. The CR is an indicator of the shared variance among the observed variables used as an indicator of a latent construct (Iddris 2016) and, finally, the average variance extracted (AVE) is a measure of the amount of variance that is captured by a construct in relation to the amount of variance due to measurement error (Iddris 2016). Discriminant validity shows the extent to which each construct was truly distinct from the other construct (Iddris 2016).
3.4 Influence of Firm Age and Dimensions
By respecting all criterias presented, the final solution of EFA was obtained and it identified the items that corresponded to each underlying factor. They were used to test if there were any distribution differences across different groups of age and dimensions of the sampled firms.
These groups were obtained through a recoding into different variable for these descriptive items. For firm’s age, the group control is the old firms and the young firm’s group was obtained with the calculation of the average age of sampled firms (which is 26 years). All firms with less than 26 years of existence were included in this group.
For firm size was recoded into a new variable, labelled SMEs, where big firms are the control group and has the value 1 for micro companies; the value 2 for small companies; and 3 for medium companies.
22
Regarding age, Mann-Whittney (MW) test was performed. Kruskal-Wallis (KW) test was performed for the SMEs variable since it has more than 2 groups of independent variables (Marôco 2014). The samples were independent and respected all assumptions (Marôco 2014). Then to understand from where these differences arise from, consecutive MW tests were conducted between two sub-groups at a time (Green & Salkind, 2008).
KW test and MW tests are nonparametric tests for the comparison of distributions with ordinal variables to see from which groups these distributions vary between all the variables (Marôco 2014). The SPSS output obtained included the p-values and the Mean Ranks. The first measure indicates if the hypothesis test can be rejected (p<0,05) and the mean ranks help to understand which group has the highest distribution for the IC, IP, and helped to realize between which groups the difference is larger.
4. Results
4.1 EFA: Innovative Capabilities and Innovation Performance
The determinant of the matrix should be greater than 0.00001, and the number of items was reduced until this condition is satisfied (Samuels, 2016). From the initial 38 items, this condition was satisfied with a final solution having only 12 items, which corresponds to a determinant of 0,005.
Next, Kaiser-Meyer-Olkin measure of sampling adequacy (KMO) should not have values less than 0.5, which it would indicate weak correlations between the variables and result in an unsatisfactory factor analysis (Alves et al. 2017). When performing the EFA with the 12 items, the KMO is 0,792 (see Table VI) and is considered “middling” but it is very close to 0,80, which is considered a “meritorious” result (Marôco 2014). The Bartlett’s test helps to identify the absence of
KMO a nd Ba rtl ett's Tes t
Kaiser-Meyer-Olkin
Measure of Sampling 0,792
Bartlett's Test of Approx. Chi-Square2006,183
df 66
Sig. 0
Table VI. Kaiser-Meyer-Olkin (KMO)
23
correlations between the variables and it shows that it is significant indicating that the data is fit for factor analysis (Alves et al. 2017).
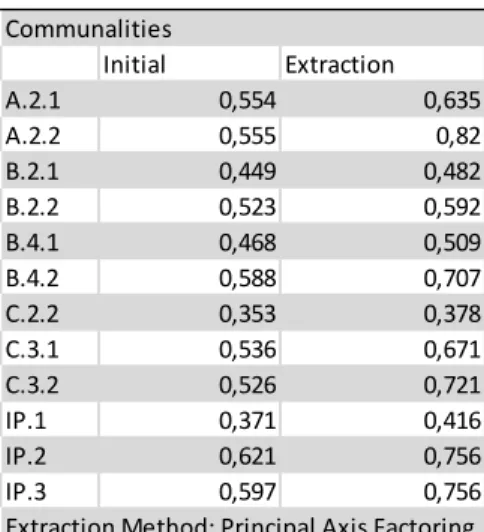
Factor analysis is a statistical method used to describe variations among observed variables in terms of fewer unobserved variables called factors (Um et al. 2011). It produces communalities and cumulative percentage of variance extracted. Firstly, the communality is the common factor or common variance (Yong & Pearce, 2013), i.e. measures the variance proportion of one variable to the others (Alves et al. 2017) and variables with low communalities, less than .30, are eliminated from the analysis (Yong & Pearce, 2013). All communalities at the Table VII resulted in significant factor loadings, increasing the total cumulative variance extracted and all communalities after extraction.
The cumulative of total variance explained (Table XIII) is the variability of the original variables in the final model including the eigenvalues and cumulative percentage of variance explained (Marôco 2014). The final instrument revealed a cumulative total variance explained for the four factors of 62,029%, which is slightly over what is an acceptable result of 60% (Alves et al. 2017).
All factors respected the Kaiser criteria and presented eigenvalues over 1 after rotation. The eigenvalue is a measure of how much of the variance of the observed variables a factor explains (Young 2013, Um et al. 2011), this means that any factor with an eigenvalue over 1 explains more variance than a single observed variable.
The rotated factor loadings were all over 0.4 which means that, for a sample size of at least 300, it is statistically meaningful since it is greater than the cut-off value of 0.32 (Yong & Pearce, 2013). A factor loading measures of how much
Communalities Initial Extraction A.2.1 0,554 0,635 A.2.2 0,555 0,82 B.2.1 0,449 0,482 B.2.2 0,523 0,592 B.4.1 0,468 0,509 B.4.2 0,588 0,707 C.2.2 0,353 0,378 C.3.1 0,536 0,671 C.3.2 0,526 0,721 IP.1 0,371 0,416 IP.2 0,621 0,756 IP.3 0,597 0,756
Extraction Method: Principal Axis Factoring. Source: SPSS Output
Table VII Item’s Communalities
24
a variable contributes to a factor; thus, high factor loading scores indicate that dimensions of factors are better accounted for by the variables (Yong & Pearce, 2013).
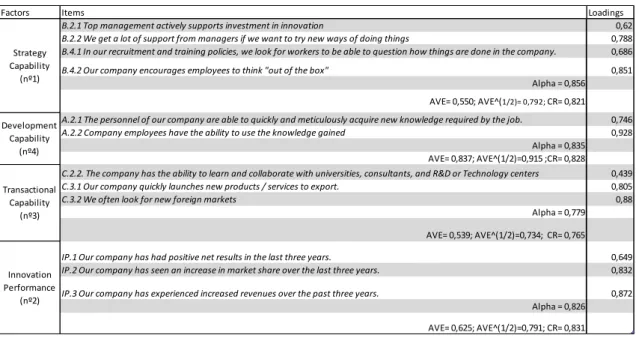
The retained factors have at least three items with loadings greater than 0.4. (Samuels, 2016) except for factor 4 (Table VIII). DC construct was not deleted from the analysis because It is possible to retain a factor with only two items if the items are highly correlated (i.e., r > .70) and relatively uncorrelated with the other variables (Worthington & Whittaker, 2006).
Finally, still at the Table VIII presents all threshold values for reliability, convergent and discriminant validity. These thresholds were the following: Cronbach’s α greater than 0.7 (Hof 2012); composite reliability (CR) values greater than 0.6 (Iddris 2016); at last, AVE was greater than 0.5 for all factors (Iddris 2016) and all the square roots of the AVEs were greater than their corresponding correlations values (Iddris 2016).
Correlations amongst factor are presented in Table IX. The highest correlation is between the SC and the DC, the association between TC and SC is moderate and it is the second highest. This suggests the importance of the strategy capability in guiding and supporting the other two capabilities ensuring the firm has the right resources (e.g. HR)
Factors Items Loadings
B.2.1 Top management actively supports investment in innovation 0,62
B.2.2 We get a lot of support from managers if we want to try new ways of doing things 0,788
B.4.1 In our recruitment and training policies, we look for workers to be able to question how things are done in the company. 0,686
B.4.2 Our company encourages employees to think "out of the box" 0,851 Alpha = 0,856
AVE= 0,550; AVE^(1/2)= 0,792; CR= 0,821
A.2.1 The personnel of our company are able to quickly and meticulously acquire new knowledge required by the job. 0,746
A.2.2 Company employees have the ability to use the knowledge gained 0,928 Alpha = 0,835 AVE= 0,837; AVE^(1/2)=0,915 ;CR= 0,828
C.2.2. The company has the ability to learn and collaborate with universities, consultants, and R&D or Technology centers 0,439
C.3.1 Our company quickly launches new products / services to export. 0,805
C.3.2 We often look for new foreign markets 0,88
Alpha = 0,779
AVE= 0,539; AVE^(1/2)=0,734; CR= 0,765
IP.1 Our company has had positive net results in the last three years. 0,649
IP.2 Our company has seen an increase in market share over the last three years. 0,832
IP.3 Our company has experienced increased revenues over the past three years. 0,872 Alpha = 0,826 AVE= 0,625; AVE^(1/2)=0,791; CR= 0,831 Strategy Capability (nº1) Development Capability (nº4) Transactional Capability (nº3) Innovation Performance (nº2) Source: SPSS Output
25
and a mentality to renew them as well. The factor correlations between TC and DC is weaker. Finally, the association between ICs and IP is the weakest, suggesting a poor but positive correlation between each other, but not low enough to be considered that IC and IP are independent.
4.2 Mann-Whittney and Kruskal Wallis test: Firm’s Age and dimension
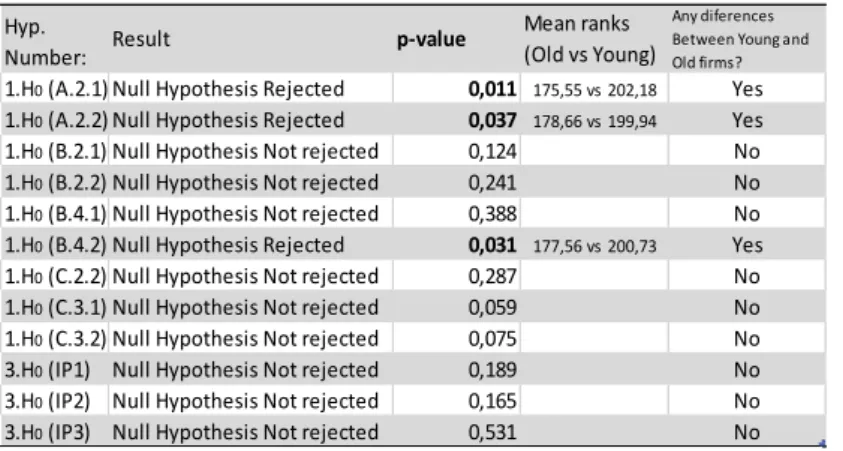
The p-values statistically significant, presented at Table X, are in bold and indicate that the major difference between young and old firms’ populations is in the DC. The mean rank for Young firms in this factor is greater than the Mean rank for Older firms. This is the only factor where this difference has been noted and thus the null hypothesis (1) was rejected only for DC. In the item B.4.2 there is a significant p-value.
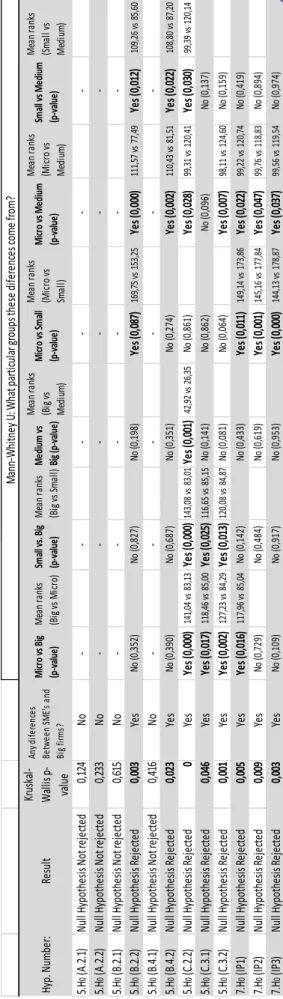
This indicates the important role of this specific item in adding to the difference of distributions alongside with the DC factor. No statistical differences exist in IP which means the null Hypothesis (3) rejected. However, DC factor distribution the same for all sizes, thus for this factor the null hypothesis (5) is not rejected. Table XI presents the differences in distribution between Large companies and SMEs when the KW test was performed. Both H5 and H7 are rejected for TC and IP factors, but for different groups. In regards each item these differences stretch and include two items from SC - B.2.1 and B.4.2.
Table IX Factor Correlation Matrix Factor Correlation Matrix
Factor SC IP TC DC
SC 1 0,226 0,437 0,566
IP 0,226 1 0,223 0,262
TC 0,437 0,223 1 0,32
DC 0,566 0,262 0,32 1 Extraction Method: Principal Axis Factoring.
Rotation Method: Oblimin with Kaiser Normalization.
Hyp.
Number: Result p-value
Mean ranks (Old vs Young)
Any diferences Between Young and Old firms?
1.H0 (A.2.1) Null Hypothesis Rejected 0,011 175,55 vs 202,18 Yes 1.H0 (A.2.2) Null Hypothesis Rejected 0,037 178,66 vs 199,94 Yes
1.H0 (B.2.1) Null Hypothesis Not rejected 0,124 No
1.H0 (B.2.2) Null Hypothesis Not rejected 0,241 No
1.H0 (B.4.1) Null Hypothesis Not rejected 0,388 No
1.H0 (B.4.2) Null Hypothesis Rejected 0,031 177,56 vs 200,73 Yes
1.H0 (C.2.2) Null Hypothesis Not rejected 0,287 No
1.H0 (C.3.1) Null Hypothesis Not rejected 0,059 No
1.H0 (C.3.2) Null Hypothesis Not rejected 0,075 No
3.H0 (IP1) Null Hypothesis Not rejected 0,189 No
3.H0 (IP2) Null Hypothesis Not rejected 0,165 No
3.H0 (IP3) Null Hypothesis Not rejected 0,531 No
Table X Firm's age influence on IC and IP
Source: SPSS Output Source: SPSS Output
26
There are differences, (still in Table XI) between micro companies and large companies mainly in the TC (same thing between small and big companies) where the Mean Ranks are greater for the larger firms. There is also a difference in firm’s economic indicator of IP, which corresponds to the net results of surveyed firms, with mean ranks favouring large firms when compared with micro firms.
Between micro and medium firms is where the difference of distribution appears in the greatest number of items. In one hand, the strategy items’ mean ranks are greater for micro companies and, on the other hand, the Transactional and IP items’ mean ranks are larger for Medium firms.
Comparing small with medium firms there is not any difference in the distribution of IP but the same is not true for items B.2.2, B.4.2, with small companies having greater mean ranks, and C.2.2, medium firms have the higher
mean ranks.
There are only distribution differences in C.2.2 between medium and large firms with the large firms having higher ranks. At last, between
Hy p. N umb er : Re su lt Kr us ka l-W al lis p -va lu e An y d ife re nc es Be tw ee n SM E' s an d Bi g fir m s? M icr o vs B ig (p-v al ue ) M ea n ra nk s (B ig v s M ic ro ) Sm al l v s. Bi g (p-v al ue ) M ea n ra nk s (B ig v s Sm al l) M edi um v s Bi g (p-v al ue ) M ea n ra nk s (B ig v s M ed iu m ) M icr o vs S m al l (p-v al ue ) M ea n ra nk s (M ic ro v s Sm al l) M icr o vs M edi um (p-v al ue ) M ea n ra nk s (M ic ro v s M ed iu m ) Sm al l v s M edi um (p-v al ue ) M ea n ra nk s (Sm al l v s M ed iu m ) 5. H 0 (A .2 .1 ) Nu ll Hy po th es is No t r ej ec te d 0, 12 4 No -5. H 0 (A .2 .2 ) Nu ll Hy po th es is No t r ej ec te d 0, 23 3 No -5. H 0 (B .2 .1 ) Nu ll Hy po th es is No t r ej ec te d 0, 61 5 No -5. H 0 (B .2 .2 ) Nu ll Hy po th es is Re je cte d 0, 00 3 Ye s No (0 ,3 52 ) No (0 ,8 27 ) No (0 ,1 98 ) Ye s ( 0, 08 7) 16 9,7 5 vs 1 53 ,2 5 Ye s ( 0, 00 0) 11 1,5 7 vs 7 7,4 9 Ye s ( 0, 01 2) 10 9,2 6 vs 8 5,6 0 5. H 0 (B .4 .1 ) Nu ll Hy po th es is No t r ej ec te d 0, 41 6 No -5. H 0 (B .4 .2 ) Nu ll Hy po th es is Re je cte d 0, 02 3 Ye s No (0 ,3 90 ) No (0 ,6 87 ) No (0 ,3 51 ) No (0 ,2 74 ) Ye s ( 0, 00 2) 11 0,4 3 vs 8 1,5 1 Ye s ( 0, 02 2) 10 8,8 0 vs 8 7,2 0 5. H 0 (C. 2. 2) Nu ll Hy po th es is Re je cte d 0 Ye s Ye s ( 0, 00 0) 14 1,0 4 vs 8 3,1 3Ye s ( 0, 00 0) 14 3,0 8 vs 8 3,0 1Ye s ( 0, 00 1) 42 ,9 2 vs 2 6,3 5 No (0 ,8 61 ) Ye s ( 0, 02 8) 99 ,3 1 vs 1 20 ,4 1 Ye s ( 0, 03 0) 99 ,3 9 vs 1 20 ,1 4 5. H 0 (C. 3. 1) Nu ll Hy po th es is Re je cte d 0, 04 6 Ye s Ye s ( 0, 01 7) 11 8,4 6 vs 8 5,0 0Ye s ( 0, 02 5) 11 6,6 5 vs 8 5,1 5 No (0 ,1 41 ) No (0 ,8 62 ) No (0 ,0 96 ) No (0 ,1 37 ) 5. H 0 (C. 3. 2) Nu ll Hy po th es is Re je cte d 0, 00 1 Ye s Ye s ( 0, 00 2) 12 7,2 3 vs 8 4,2 9Ye s ( 0, 01 3) 12 0,0 8 vs 8 4,8 7 No (0 ,0 81 ) No (0 ,0 64 ) Ye s ( 0, 00 7) 98 ,1 1 vs 1 24 ,6 0 No (0 ,1 59 ) 7. H 0 (I P1 ) Nu ll Hy po th es is Re je cte d 0, 00 5 Ye s Ye s ( 0, 01 6) 11 7,9 6 vs 8 5,0 4 No (0 ,1 42 ) No (0 ,4 33 ) Ye s ( 0, 01 1) 14 9,1 4 vs 1 73 ,8 6 Ye s ( 0, 02 2) 99 ,2 2 vs 1 20 ,7 4 No (0 ,4 19 ) 7. H 0 (I P2 ) Nu ll Hy po th es is Re je cte d 0, 00 9 Ye s No (0 ,7 29 ) No (0 ,4 84 ) No (0 ,6 19 ) Ye s ( 0, 00 1) 14 5,1 6 vs 1 77 ,8 4 Ye s ( 0, 04 7) 99 ,7 6 vs 1 18 ,8 3 No (0 ,8 94 ) 7. H 0 (I P3 ) Nu ll Hy po th es is Re je cte d 0, 00 3 Ye s No (0 ,1 09 ) No (0 ,9 17 ) No (0 ,9 53 ) Ye s ( 0, 00 0) 14 4,1 3 vs 1 78 ,8 7 Ye s ( 0, 03 7) 99 ,5 6 vs 1 19 ,5 4 No (0 ,9 74 ) M an n-W hi tn ey U : W ha t p ar tic ul ar g ro up s th es e di fe re nc es co me fr om? Ta b le XI F ir m 's si ze d ist ri b u ti o n d ifer en ces a m o n g a ll g ro u p s So ur ce : SPS S O utput
27
micro and small firms there are differences in distribution for IP and for item B.2.2. IP mean ranks are higher for small firms, however B.2.2’ mean rank is higher for micro firms’ mean ranks are higher regarding item B.2.2.
In sum, H5 is rejected between Micro/Big and Small/Large for TC, Medium/Big for C.2.2, Micro/Small for B.2.2, Micro and Medium for C.2.2, B.4.2 and B.2.2 (same between Small and Medium). H7 is rejected between Micro vs Small firms and Micro vs Medium for IP.
5. Discussion and Conclusions
The merit of the thesis is the ability of including a wide range of variables that many authors proved their importance for firm’s IC. To achieve this, the link between complementary and dynamic capabilities by Alves et al. (2017) is very important and, considering the results, the additional capability – SC – revealed to be decisive. That is, dynamic capabilities highlight the importance of SC (Assink 2006).
However, the results of the EFA showed that all the initial expected factors are significant except for the MC. This result confirms that the ability to implement new managerial regulations, systems, methods, social and cognitive developments, through the task of coordination, it is not always present in enterprise settings (Teece, 2007). This is a common result in dynamic capabilities’ literature (Alves et al. 2017) and the same happened for the surveyed firms.
All IC factors are positively correlated, meaning that the degree of interdependence between these capabilities is a source of competitive advantage due to synergies resulting from their joint implementation (Teece et al., 1997). In other words, DC, SC and TC are complementary because, in order to improve firm’s innovative capabilities, the firm must enhance all innovative capabilities instead of focusing only in one of these capabilities (Zawislak et al. 2012, 2013).
The DC has the least number of items loadings and presents itself as being a direct consequence of the ability to recognize the value of new information, to assimilate it,
28
and apply it to commercial ends, that is the absorptive capacity improves firm’s IC (Liao et al. 2007). On the contrary, the SC has the highest number of items loading and with the highest Cronbach alpha indicates that it is the main factor to explain ICs of the sampled firms. So, the SC is the predominant capability, hence the improvement of SC implies that TC and DC will be improved as well, confirming that they are complementary (Zawislak et al. 2014).
This means that a greater easiness of renewal in the way the firm works, makes easier to the firm to adapt and, consequently, a greater link with firm’s IC (O’Connor et al. 2008). Particularly, the transformational leadership improves IC and suggests that without the explicit and consistent support of top management, capabilities development will not progress (Borjesson & Elmquist 2011). And, the HR strategic management ensures that their current HC have the required capabilities and competencies of the optimal level and intensity in the form of knowledge, skills, and abilities to perform effectively in a rapidly changing environment (Ayub et al. 2017). Firms that focus on these two behaviours have greater ICs and IP due to the SC predominance.
The interaction with KIBS and the predisposition for exporting through EO are the significant variables that explain the TC. This implies that the utilization of KIBS assists firms in better utilizing external sources of innovation and knowledge (Yam et al. 2011), and it provides to the firm the ability to identify new opportunities abroad, which differentiates them from other firms in the way they compete (Ribau et al. 2017). This reveals the importance of TC for the improvement of ICs and IP (Alves et al. 2017).
However, the association between IC and IP is weak but positive. It might indicate that there are other ways to improve IP, e.g. resources. One possible explanation is that the consequences of the difficulties of Portuguese companies to incorporate into their strategy innovations developed by them or in partnership might be one of the reasons why the sampled firms have weak innovative routines and abilities that would enable them to successfully design and develop innovations and perform better at innovation (Godinho, 2016). So, the characteristics of the sampled firms must be considered like