FUNDAÇÃO GETULIO VARGAS
ESCOLA BRASILEIRA DE ADMINISTRAÇÃO PÚBLICA E DE EMPRESAS
Anna M. Krzemińska
The importance of firms’ strategic resources and capabilities
in crisis situations
Rio de Janeiro
Ficha catalográfica elaborada pela Biblioteca Mario Henrique Simonsen/FGV
Krzemińska, Anna M.
The importance of firms’ strategic resources and capabilities in crisis situations / Anna M. Krzemińska. – 2015.
41 f.
Dissertação (mestrado) - Escola Brasileira de Administração Pública e de Empresas, Centro de Formação Acadêmica e Pesquisa.
Orientador: Patrick Behr.
Coorientador: Ronaldo Couto Parente. Inclui bibliografia.
1. Empresas – Avaliação. 2. Vantagem competitiva. 3. Planejamento estratégico. 4. Crise financeira global, 2008-2009. I. Behr, Patrick Gottfried. II. Parente, Ronaldo Couto. III. Escola Brasileira de Administração Pública e de Empresas. Centro de Formação Acadêmica e Pesquisa. IV. Título.
Anna M. Krzemińska
The importance of firms’ strategic resources and capabilities
in crisis situations
A Master thesis presented to the faculty of Brazilian School of Public and Business Administration (FGV) in partial fulfillment of the requirements for the degree of Master of Science in Administration.
Advisor
: Prof. Patrick Behr
Co-Advisor
: Prof. Ronaldo Couto Parente
Rio de Janeiro
Abstract
The general idea of this research is to analyze overall firm performance before and after
the global financial crisis of 2008. The main question is: What kind of strategies did
companies adopt that led to positive business performance after the crisis? Are there
any particular competitive advantages that bring better performance in the case of an
economic downturn? This research focuses on competitive advantage gained by
resource-based view attributes of a product (quality, durability and prestige) and
dynamic capabilities (strategic flexibility in product development and technological
innovation ability). The economic crisis setting provides a proper background to
analyze the competitive advantage strategies in a dynamic, low-probability
environment to determine which are most worth adopting in the business world.
I employ an OLS regression analysis in order to measure the business performance of
136 Brazilian firms across four years – 2002, 2005, 2008 and 2012. The findings
indicate that even though all of the strategic resources and capabilities positively
influence firm performance in expansionary periods, only the superior product
characteristics are pertinent in surviving an economic downturn.
Contents
1. Introduction ... 1
2. Research Background ... 5
2.1. Global Financial Crisis ... 5
2.2. The impact of the crisis in Brazil ... 7
3. Literature Review and Hypotheses Development ... 10
3.1. Competitive advantage ... 10
3.2. Resource-based view and resource competitiveness ... 12
3.3. Resource-based view and dynamic capabilities ... 14
4. Research Method ... 19
4.1. Research context ... 19
4.2. Data collection and sample ... 20
4.3. Data measures ... 21
4.4. Data analysis ... 25
5. Results ... 29
6. Discussion and Implications ... 35
7. Conclusion ... 37
1. Introduction
Organizations have always faced external shocks that could threaten their viability and
prosperity. Even though economic crises do not happen frequently and are unique in
nature, they should not be omitted in academic research. Especially in the emergence of
a network economy (Achrol & Kotler, 1999), even a seemingly not dangerous downturn
can evolve and spread across the globalized world in a quick and detrimental manner,
unexpectedly influencing firms' well-being. Therefore, studying crises and possible
ways to resolve them at the organizational level can be valuable in terms of its scientific
theoretical contribution and application in the business world.
The crisis has been studied in different business perspectives. Chung et al. (2010)
explored the topic of subsidiary expansion orientation across – or within – countries
during the Asian economic crisis (1997-1998); Lee & Makhija (2009) examined
strategic flexibility gained by international direct and export-related investments
during the Asian crisis in Korea; and Grewal & Tansuhaj (2001) focused on market
orientation and strategic flexibility based on investment, diversity of environment and
macro environmental risk management, also in the Asian setting. Other researchers
such as Ngah-Kiing Lim et al. (2009) examined the influence of a product diversification
strategy on debt financing levels during the Asian crisis, proving companies that pursue
unrelated product diversification take on less debt financing in stable environments, but
more in dynamic environments. Moreover, Wan & Yiu (2009) investigated corporate
acquisitions in turbulent and stable periods, which resulted in the general conclusion
that acquisitions are positively correlated with firm performance during an
environmental jolt, which means that it is possible to capitalize on opportunities
that during economic instability, a firm’s financial flexibility is crucial for its
performance (Garcia-Sanchez et al., 2014).
Hence, it could be generally concluded that flexible and adaptive capabilities in terms of
investment or acquisitions, as well as across-countries orientation, help companies
survive unforeseen negative environmental change. Moreover, it has been confirmed
recently that a firm’s positive performance during an economic crisis mostly depends
on its own resources and capabilities and less on the roles of the industry or country,
which are significantly reduced in such adverse conditions, especially in emerging
markets (Bamiatzi et al., 2015). Thus, the external environment effect is less important
in relation to business performance than a self-determined internal power that can be
gained by a firm’s competitive advantages. This will be investigated further.
In theory (i.e., Barney, 1991; Hunt & Morgan, 1995; Day, 1994), valuable and
competitive resources, strategies and capabilities together are responsible for strong
performance of a company, but it is not clear if they are effective under an unexpected,
external shock, which significantly affects the internal stability of a firm. According to
some research (Kogut & Kulatilaka, 2001; Bowman & Hurry, 1993), the direct
assumption that specific resources and competences working effectively in stable
market conditions would also be automatically be successful in the unstable period of
time is misleading. It is crucial for this research to indicate how selected competitive
resources and capabilities will perform during stable and unstable economic periods,
where direct comparison is noted in the hypotheses presented. Moreover, it is beneficial
to uncover their strengths and weaknesses in an extreme economic hardship scenario,
as all kinds of companies could experience this at a given moment, especially in this era
The competitive advantage a company gains by its tangible resources has not been
examined empirically in the crisis context. The resource-based view (RBV) features,
such as uniqueness, persistence, quality and reputation of a product, tend to represent
high value for a firm in stable conditions (Barney, 1986; Peteraf, 1993), but they have
not been proven beneficial in case of an economic downturn. This study tries to fill this
research gap and answer whether this kind of competitive advantage helps an
organization survive a crisis. Moreover, there is room to address another aspect of the
resource-based view – dynamic capabilities, in terms of technological innovation. The
focus goes to organizational capability of change, which combines two crucial
competences each firm should consider to adopt. The first one is strategic flexibility in
terms of a product lineup development and technological adjustments concerning
customer and competitor behaviors. The second one is technological innovation
capability, which concerns readiness for new technology adaptations and innovation
drive. Both of these capabilities in the aforementioned aspects have not yet been
examined in the crisis situation.
Furthermore, there is a clear absence of business strategy research in the setting of the
most recent global financial crisis (one of the few examples is Bamiatzi et al., 2015), as
the majority of studies concentrate on the Asian crisis of the late-1990s (Grewal &
Tansuhaj, 2001; Lee & Makhija, 2009; Ngah-Kiing Lim et al., 2009; Wan & Yiu, 2009;
Chung et al., 2010). As Bamiatzi et al. (2015, p. 4) note: “There is no empirical work
within a strategic management literature that offers reasonable expectations of 2008 recession consequences on the firm effects-performance relationship.”
This crisis focus, in contrast to the Asian downturn, gives a current perspective on
globalized nature of any economic downturn that may occur. In addition, this research
concerns Latin America’s largest market and an emerging global economy;1 this helps
us better understand crisis response mechanisms among developing markets, where
fighting crises might be even tougher and more complex than in developed countries.
Additionally, the longitudinal nature of the dataset differentiates this study, as we have
a direct comparison of the same companies between economically stable and unstable
periods of time, within a 10-years time period. The 136 matched automotive firms give
us a legitimate source of comparable indicators since the resources and capabilities
were measured unchangeably (with the same questions and survey structure) across
the years and, in most cases, were evaluated by similarly positioned organizational
employees.
In sum, there are a few important reasons why this research should be conducted. First,
there is a shortage of research measuring the consequences of the global financial crisis
in the business spectrum, especially in the strategy field. Analyzing this severe and
extremely globalized crisis gives new insights on the overall impact this event had on
businesses. These findings could be more generalized than the results from studies of
the regional Asian crisis. Moreover, they contribute to emerging economy studies.
Furthermore, even if economic rent generation has always been of high interest to
management scholars, there are still several unaddressed issues. The literature has not
examined the competitive advantage gained by superior product characteristics. Also,
the benefits of strategic flexibility in product development and innovation capabilities
have not yet been examined in the economic munificence period. Finally, this paper
presents direct contrasts between the stability and crisis times among the same
companies, which is a rare practice, and it contributes to a deeper analysis of the
phenomenon.
2. Research Background
2.1. Global Financial Crisis
The Global Financial Crisis (GFC) began in late 2007 in the United States when the most
important and reliable financial institutions and enterprises collapsed and went
bankrupt (Scott, 2010). After a while, the “Great Recession” spread out globally, mostly
affecting developed countries in Europe, as well as emerging economies in Asia, South
America and Africa influenced by the stock market fluctuations (Velde, 2008).
The global financial crisis was caused by a combination of complex factors. First,
globalization of fiscal illiquidity issues contributed to the rapid evolution of the crisis.
The uncomplicated credit conditions during the period of 2002-2008 encouraged
high-risk lending and borrowing practices not only among ordinary people, but also among
banking sectors and governmental institutions globally (Taylor, 2009). People and
institutions were functioning above the realistic level of their affordability. Subprime
mortgages took control over the market and caused the American "housing bubble"
(Taylor, 2009, Reinhart & Rogoff, 2008). The problem occurred when unreliable and
credit-unworthy customers began having difficulty repaying their loans because of
increasing interest rates. When some of banks in the U.S. went bankrupt – including the
well-known Lehman Brothers – otherwise got acquired by or merged with other private
and public financial institutions (Scott, 2010), individuals and organizations lost a
the global economy, it did not take long to see the effects spread outside the U.S.
international trade imbalances and global market ineffectiveness started to arise,
mostly due to a strong globalization trend and a system of “communicating vessels”
(Calabro et al., 2011) that spread the economic slowdown rapidly and deviously
(Stiglitz, 2012). Another cause of the GFC was a widespread belief in neo-liberalism and
free markets (Rudd, 2009). The inherently self-corrected and self-regulated financial
markets were overestimated, and their “Smith’s invisible hand” regulation did not occur
(Stiglitz, 2012). Economic liberalism, which started to dominate within financial
markets and economic policies around the world during the twentieth century (mainly
after adaptation of the Bretton Woods system in 1944), has not been as reliable and
efficient as many claimed it would be. The monetary policies, with low interest rates,
high liquidity and limited regulations, were considered safe and able to prevent market
instability. However, they had the opposite effect (Rudd, 2009). Even Alan Greenspan,
an influential American economist and former Federal Reserve chairman, agreed that
the ideology he believed in was not working well and the “hands off” ideology was not
completely flawless (The Guardian, 2008). The failure of economic fundamentalism was
unexpected, and that was the main reason the financial crisis became such a massive
and tough issue. Moreover, the severity of existing and emerging problems was not
noticed quickly enough or solved promptly, which led to long-term consequences. As a
result, global financial markets have suffered tremendous dislocation and have lost
many assets. The total loss has been estimated as equivalent to the collective GDP of the
countries belonging to the G7, which is approximately US$32 trillion (Rudd, 2009). In
the United States and beyond, a large number of people lost their jobs, properties and
savings, which caused an increase in social inequality (Stiglitz, 2012). Even though
in stimulus packages for private and public institutions to improve this critical situation,
the process to full recovery took a long time. Some argue it is still in progress.
In summary, the main result of the global financial crisis was a large credit deficit and
general illiquidity, which directly led to turbulences in the business world. The sudden
increase in transaction costs led to a decline in firm resources (Lathman & Braun, 2008)
and, therefore, reduced organizational efficiency and productivity, lowered revenues
and, consequently, caused default and job cuts. In such adverse conditions, companies
struggled to maintain their profit margins and stay competitive. Hence, the recession of
2008-2009 provides an excellent case for further investigation of business performance
fluctuations in an economic downturn.
2.2. The impact of the crisis in Brazil
At the onset of the global financial crisis, Brazil had been experiencing high economic
growth, and it managed to sustain social reforms because of this. This, aligned with a
more participative foreign policy, gave the country more room in the geopolitical
scenery, which brought the popularity of then-president Lula da Silva to very high
levels. He was so confident of Brazil's strength that he made an infamous statement that
the "crisis would hit Brazil like a wavelet, as opposed to the tsunami it had been in other
countries" (Ferrari Filho, 2011; p. 2).
However, when the crisis hit Brazil, it caused a recession in late 2008 and 2009. Brazil's
GDP rate dropped by almost 6%, to level of -0.6% [Graph 1], the unemployment rate
increased by 2.2% and a stimulus package worth 1.5% of national GDP was triggered to
Graph 1. Comparison of GDP Growth – Annual (%)
Source: The World Bank data (2015)
When the global crisis hit Brazil, the country had high international reserves, with a
solid demand, and it was not suffering from a housing bubble in the market (some say
the bubble was being inflated at that point, but if so, it certainly was not as strongly as in
the U.S. before 2008). For these reasons, the Brazilian recession did not last long. Added
to these factors, Brazil still had an elevated momentum in consumption, and easy credit
aligned with tax incentives helped the country recover from the crisis very quickly,
reaching a GDP increase of 7.5% in 20102 (Carrasco & Williams, 2012).
Seeing the result, the government lowered the historically high interest rate to the
minimum of 7.25%3 in late 2012 and included a second round for its Growth
Acceleration Program (Programa de Aceleração do Crescimento). It also increased tax
incentives, especially in the manufacturing sector (with the automotive industry being
one of the main beneficiaries). All of these actions helped the Brazilian economy recover
quite rapidly (about one year after the GFC) and remain stable for several years.
However, one could argue that Brazil's expansionist fiscal policy, adopted to counteract
the effects of the GFC from 2008 onward, ultimately led to the economic recession
observed in 2014 and 2015. Nonetheless, the country experienced, on average, high
economic growth from 2004-2007 and kept leading the global emerging market
economies ranking, while it overlooked many of the necessary reforms required to keep
government finances under control. Brazil was taking advantage of high commodity
prices, China's expansion and increasing geopolitical influence, but the country
neglected to prepare for another economic downturn. Therefore, after 2008, it had to
adopt counter-cyclical measures – low interest rates, tax incentives, government
spending and credit concessions, among others. In other words, incentivizing demand,
but overlooking, for instance, investment in productivity. Such measures gave a false
impression that the country had recovered quickly from the crisis and that the growth
observed in the previous decade would resume. The measures adopted by the
government could work only temporarily, and they finally caused a decline in the
post-crisis economical prosperity. Brazil is currently in a severe recession, with high
unemployment (7.5% in July 2015 with a forecast of 10% next year), GDP decline
[Graph 2], skyrocketing inflation (fluctuating around a 9.5% level) and high exchange
rates (1 USD exceeding the level of 4 BRL, which almost doubled in the last two years).
Moreover, another issue is the growing deficit, now worth 8-9% of the total GDP. This
recently caused the international rating agency to downgrade Brazil's investment-grade
Graph 2. Brazil GDP, % of Change vs. a Year Earlier
Source: IMF and Central Bank of Brazil, retrieved from The Economist (2015)
3. Literature Review and Hypotheses Development 3.1. Competitive advantage
The competitive advantage concept (Porter, 1985; Rumelt, 1984) has been broadly
researched in strategic management. The role of competitive advantage positively
impacting sustained and superior performance has been confirmed by scholars (i.e.,
Barney, 1997; Grant, 1998). In the real world, companies try to identify, implement and
reinforce competitive advantages in their businesses (Porter, 1996) in order to
successfully grow their profits and recognition. Porter explains his rationale behind this
term: “Competitive advantage grows out of value a firm is able to create for its buyers that
exceeds the firm's cost of creating it” (Porter, 1985; p. 3). He categorizes it into two
general strategy types: cost leadership and differentiation. The company’s position in
the industry lies in between competitive advantage (cost leadership and differentiation)
Graph 3. Porter’s Generic Strategies
Source: M.E. Porter, “The Competitive Advantage: Creating and sustaining superior performance”, 1985; p. 12
Porter (1985) claims that the decision of the type and scope of a firm’s competitive
advantage is significantly important in order to become favorable of it and not remain
“stuck in the middle.” Another widely researched approach toward gaining competitive
advantage was created in the late 1960s and is now mostly known as the “SWOT”
analysis. Summarized by Barney (1991; p. 99), the approach toward sustained
competitive advantage should comprise of: “implementing strategies that exploit their
internal strengths, through responding to environmental opportunities, while neutralizing external threats and avoiding internal weaknesses.” Both of these approaches give a
general direction toward where the organization should aim in order to stand out
among competitors; however, they do not provide specific instructions on how to gain
the differentiating set of assets.
More specifically, even though sources of competitive advantage might vary, the
that generates economic value (Fiol, 1991) by enabling a firm to perform more
efficiently among competitors (Collis & Montgomery, 1995). In this research, both
organizational resources and competences will be taken into account as sources of
competitive advantage that differentiate a firm from other market players. Outstanding
resources and competences should lead to superior performance and, therefore, help a
firm overcome any economic turbulence it may face.
3.2. Resource-based view and resource competitiveness
Collis and Montgomery (1995) identify five crucial characteristics of valuable firm’s
resources creating potential competitive advantage: i) inimitability, considering how
difficult it is for competitors to copy the resource; ii) durability, meaning how quickly it
will depreciate; iii) appropriability, taking into consideration who captures the value created (customers, owners, distributors, suppliers, etc.); iv) substitutability,
recognizing uniqueness of the resource; and v) competitive superiority, which shows to
what degree the resources are better than the competitors.’ Collis and Montgomery
(1995) provide a detailed response toward the resource-based view, which was first
introduced by Penrose (1959) and continued by other scholars (Barney, 1986, 1991;
Peteraf, 1993; Teece, 1982; Wernerfelt, 1984). The resource-based view corresponds to
a firm’s competitive and heterogeneous market position being influenced by a bundle of
unique resources and capabilities (Barney, 1986, 1991; Peteraf, 1993). The sustainable
competitive advantage resources are supposed to be valuable, rare, inimitable and
non-substitutable (VRIN attributes) in order to be beneficial for a company and difficult for
Eventually the VRIN concept evolved into VRIO (Barney, 1997), where the
organizational aspect has replaced the non-substitution variant. Hence, according to the
theory, without skilled and capable people at an organization, resources would not be
translated into sustained competitive advantage (Katkalo et al., 2010).
The resource-based view has been studied in different scenarios, but the literature does
not include sustained competitive advantage being tested in an economic crisis. The
theory tells us a firm’s superior resources are strategically important in obtaining
sustainable competitive advantage and, therefore, lead to significantly better business
performance versus competitors. Despite considerable research in this area, it is yet to
be established whether the specific superior characteristics of a product are, indeed,
able to positively impact firm performance in general terms and, even more
importantly, whether they help a firm survive an economic downturn and overcome the
external threat on a surplus.
Drawing from the well-established theoretical pillar in strategy, the resource-based
view theory, I intend to analyze the relation between the firm’s superior product
characteristics and their impact on firm overall performance, taking into account
financial profitability, market share and sales growth rates throughout the years.
In order for a firm to gain competitive advantage in the market, its resources should be:
valuable, hard to imitate and idiosyncratic (Barney, 1991; Conner, 1991), which are
concentrated in the overall quality and prestige/reputation of a product. Moreover, I
look into a durability (product life cycle) part, which is adopted from Collis and
Montgomery’s study (1995) regarding crucial features of firm resources that are
Therefore, I expect the product characteristics of quality, durability and prestige to be
strong enough to enhance firm performance not only in stable economic conditions, but
also in the case of an anomalous event, namely the 2008 recession:
Hypothesis 1a. (H1a)
Generally, the greater a firm’s product quality, durability and prestige, the higher its level of business performance.
Hypothesis 1b. (H1b)
The greater a firm’s product quality, durability and prestige, the higher its level of
business performance after the crisis, which means these product characteristics will help a firm survive the economic downturn.
3.3. Resource-based view and dynamic capabilities
The resource-based view analyzes not only the type of resources, but also the kinds of
capabilities that are able to generate rent for the company (Amit & Schoemaker, 1993),
which leads us to another aspect of competitive advantage. In the more recent
literature, the focus goes to “dynamic capabilities,” a strategic approach to obtaining
sustained competitive advantage by continuously leveraging and developing a firm’s
assets, capabilities and core competencies (Harreld et al., 2007). In 1997, Teece and his
coauthors noticed a need to extend the resource-based view into a dynamic market
competences in firms' shifting and competitive environments. By doing this, dynamic
capabilities provide an organization with new, innovative forms of sustained
competitive advantage (Leonard-Barton, 1992). It should be mentioned that dynamic
capabilities performance strongly depends on management capabilities and a difficult to
achieve combination of “organizational, functional and technological” skills (Teece et al.,
1997: p. 510) and confirms the ‘VRIO’ theory (Barney, 1997). Moreover, most likely a
superior performance will be correlated with knowledge resources (Grant, 1996; Kogut
& Zander, 1992), which are essential in innovation. Eisenhardt and Martin (2000), by
debating about the evolution of dynamic capabilities, concluded that even if each firm
has its independent and unique path to follow, the evolution’s path is shaped by
commonly known learning mechanisms, like repeated practice, that accelerate the
process (Argote, 1999). Moreover, as mentioned, small losses (Sitkin, 1992) or crises
(Kim, 1998) may motivate a further, more rapid evolution of dynamic capabilities.
In summary, the resource-based view provides an insight that valuable and unique
resources are needed to gain a competitive advantage, but other things are important
as well. The main goal is to be able to transform these resources into firm-specific,
unique competences and capabilities (Prahalad & Hamel, 1990; Conner, 1991), which
lead to organizational heterogeneity and a well-established, sustainable position in the
market. The point is that the resource-based view cannot, in itself, foresee firm
performance in adverse conditions, such as economic crises. Therefore, besides
resources examination, dynamic capabilities should also be analyzed in terms of their
In this study, I would like to focus on one type of dynamic capability – organizational
capability of change, which is a combination of a company's strategic flexibility in
product development and technological innovation ability.
Strategic flexibility is defined as a firm’s ability to respond quickly to market dynamic
opportunities and threats (Sanchez, 1995) by reallocating its resources properly and
balancing both internal and external environments effectively (Volberda, 1996).
Strategic flexibility represents a fundamental approach to managing uncertainty
(Sanchez, 1993), and as a dynamic capability, it enables a firm to gain a competitive
advantage in a turbulent market setting (Teece et al., 1997). In the long run, it
strengthens the positive effects of technological capability associated with explorative
innovation (Zhou & Wu, 2010), which is more proof that a company can be more
competitive and successful by combining both capabilities. Foss (1998) indicates that in
the case of an economic downturn, a firm’s flexibility and readiness for unanticipated
change is more beneficial than a unidirectional and steady strategy.
In this research, strategic flexibility measures a firm’s capability to react quickly to a
major change in different aspects: customers' change in preferences, competitors' new
product lineups and general changes in technology; therefore, it is called a strategic
flexibility in product development. This kind of flexibility has not yet been proven as
beneficial or detrimental to firm performance in adverse economic conditions. Past
research (Miles & Snow, 1978) supports the rationale that strategic flexibility with
adapted product offering positively influences firm performance. This type of capability
is conceptualized as resource flexibility (Sanchez, 1995), which indicates flexibility in
product-creating resources. Even though the extent and timing of any kind of crisis is
(Evans, 1991), which is supposed to be a powerful tool for surviving a crisis. Therefore,
I expect strategic flexibility to enhance firm performance not only during an
expansionary period of time, but also after a crisis:
Hypothesis 2a. (H2a)
Generally, the greater a firm’s strategic flexibility in product development, the higher its level of business performance.
Hypothesis 2b. (H2b)
The greater a firm’s strategic flexibility in product development, the higher its level of
business performance after the crisis, which means this dynamic capability will help a firm survive the economic downturn.
The second dynamic capability is the innovation ability to constantly transform
knowledge and ideas into new products, processes and systems inside a firm (Lawson &
Samson, 2001). A higher level of technological capability impacts dynamic capability
evolution, which helps a firm reallocate its resources and adapt to a market shift in a
more prominent way (Eisenhardt & Martin, 2000; Teece et al., 1997). Technological innovations improve the flexibilities in product development, enabling an acceleration
of creation processes and increasing the range of products in which a given resource
might be applied (Sanchez, 1995). This contributes to a firm’s wider prospects and
possible performance enhancements. Similar to flexibility in product development, a
and versatile which, in case of an external shock, should guarantee better chances for
quick adaptations and, therefore, reactive ways to fight the crisis successfully. The
nature of dynamic capabilities concerns highly developed responsiveness to
environmental change (Teece et al., 1997). Therefore, I expect that the technological
innovation competence acquired by a company will be beneficial to firm performance in
general and also in economically unstable times:
Hypothesis 3a. (H3a)
Generally, the greater a firm’s technological innovation capability, the higher its level of
business performance.
Hypothesis 3b. (H2b)
4. Research Method
4.1. Research context
Brazil is one of the biggest emerging economies in the world, belonging to the BRICS4
group, G205, United Nations and the regional trade union Mercosur.6 It is the largest
market in South America by GDPand population (World Bank, 2014) and one of the
global leaders in the number of vehicles (estimated at 23 million in 2005 and almost 40
million in 2013), which is 5.1 inhabitants per vehicle for 2013 (ANFAVEA, 2015).7 The
automotive industry is one of the largest and fastest-growing industries in the country,
worth 5% of the total GDP and generating US$110.9 billion of revenue in 2013.
Moreover, Brazilian production of vehicles is responsible for more than half of the total
production in Latin and Central America, estimated at more than 3.7 million units in
2013 (ANFAVEA, 2015).
Global auto components suppliers and assemblers are very well represented in Brazil,
since the country is one of the world’s leaders in terms of the number of brands being
produced in a single country. Therefore, the industry faces sufficient internal
competition and a constant need for innovativeness and development. Moreover, the
demand pressure for cars in Brazil has been high due to expansion of the middle class,
growing dissatisfaction with public transportation and government tax incentives to
stimulate the economy by promoting national production and lowering unemployment
rates (1.5 million people are employed in the Brazilian automobile industry – ANFAVEA,
2015).
4 Acronym for five major global emerging economies: Brazil, Russia, India, China and South Africa, first
introduced as BRIC in 2001 and developed in 2010 by adding South Africa to the list.
5 The Group of Twenty gathers major global economies since 1999.
6 Mercado Comun do Sul/Southern Common Market introduced in 1999 uniting Latin American countries. 7 Source: ANFAVEA – Associação Nacional dos Fabricantes de Veículos Automotores/Brazilian
Additionally, a high level of investment and international export (mainly to Argentina,
Mexico, the United States and the European Union) shows the importance of expanding
the local market and gives further reasons for in-depth investigation of the industry. All
of these sector characteristics provide a proper setting to representatively analyze the
impact of the global financial crisis on firm business performance in the Brazilian
context.
4.2. Data collection and sample
The dataset was gathered based on questionnaires developed after in-depth
semi-constructed interviews with plant, supply chain, purchasing and manufacturing
managers working in the four main automotive companies in Brazil (General Motors,
Volkswagen, Ford and DaimlerChrysler) and their suppliers (i.e., Dana Corporation,
Eaton Corporation, Visteon Automotive Systems). The refined survey was developed by
FGV professor Ronaldo Couto Parente as part of a project on modularization associated
with the Motor Vehicle Program (IMVP) at the Massachusetts Institute of Technology.8
The survey and a personalized introductory cover letter were distributed among
Brazilian automotive manufacturers and suppliers by mail, first in 2002. Follow-up
surveys were mailed in 2005, 2008 and 2012. The first questionnaire was received by
456 business units out of 493. After three follow-ups and filtering the responses for the
missing values, the sample contained 136 matched companies. The effective response
rate was 29 percent. The final sample for both automakers and suppliers had a good
variety of firms in terms of product type, size, age and geographical scope.
8 For more details regarding the data collection and the project refer to Kotabe et al. (2007) and
The questionnaire used five-point Likert scale measurements for the constructs, and it
was translated from Portuguese into English and then reversed (back translated) in
order to maintain the original meaning of the questions. The initial and follow-up
surveys included sections on: background information, business unit and product
characteristics, modular production, factors driving adoption of modularization,
benefits of modularization and performance, relationship with suppliers, knowledge
sharing and technology transfer and macro uncertainty.
The main focus of my study related to the sections on business unit and product
characteristics and benefits of modularization and performance. In the model construct
validation using confirmatory factor analysis (CFA) and in the OLS regression analysis, I
focused on the years of 2002, 2005 and 2008 for performance before the crisis (since
the crisis in Brazil occurred mostly in 2009 and the measures are taking into account
performance over the past 12 months), and I used 2012 for the post-crisis performance
measure.
4.3. Data measures
Dependent Variable
Due to my interest in assessing the operational and financial effectiveness of the
company in the best possible way, a business unit’s performance was tested as the
dependent variable (Venkatraman & Ramanujam, 1986). Six survey factors are
combined to measure firm performance versus its major competitors in the last 12
months. This assessment takes into account the financial performance, measured by
operational performance, which is evaluated by a firm’s market share and sales growth.
A firm's ultimate performance score is an average of all the five-point Likert scale
indicators [Table 1].
Table 1. Descriptive Statistics for all the Years and Individual Years
Variable Mean SD 1% Median 99%
PANEL A – ALL YEARS
Business Performance (N=492) 3.65 .63 1.83 3.83 4.83 Product Characteristics 3.59 .80 1.65 3.83 5.0
Strategic Flexibility 4.02 .70 2.0 4.0 5.0
Tech. Innovation Capability 3.78 .76 1.23 4.0 5.0 Past Performance (N=369) 3.57 .63 1.83 3.66 4.83 Sales Size (log) – Fixed 7.57 1.11 5.33 7.47 9.71
PANEL B – 2002
Business Performance 3.47 .65 1.83 3.50 4.83 Product Characteristics 3.79 .55 2.25 3.83 5.0
Strategic Flexibility 4.04 .74 2.0 4.0 5.0
Tech. Innovation Capability 3.88 .84 1.0 4.0 5.0
PANEL C – 2005
Business Performance 3.77 .51 2.50 3.83 4.83 Product Characteristics 3.30 .92 1.20 3.50 4.79 Strategic Flexibility 4.13 .65 2.08 4.33 5.0 Tech. Innovation Capability 3.78 .69 1.31 4.0 5.0
PANEL D – 2008
Business Performance 3.46 .67 1.83 3.50 4.62 Product Characteristics 3.27 .84 1.66 3.50 4.66 Strategic Flexibility 3.74 .65 1.74 3.66 5.0 Tech. Innovation Capability 3.34 .53 2.0 3.25 4.82
PANEL E – 2012
Main Independent Variables
The main objective of this study is to verify which types of competitive advantage are
most likely to help a company in surviving the economic crisis. The first independent
variable analyzed is the RBV product characteristics of quality, durability and prestige.
The participants were asked to evaluate their firm’s product features by overall
performance, durability, shortage of defects, quality, prestige and reputation in
comparison to its three main competitors in the last 12 months.
The next two main independent variables are dynamic capabilities, which measure the
organizational capability of change. Both of the variables, strategic flexibility and
technological innovation capability, are measured by self-reported responses to
five-point Likert scale (strongly disagree to strongly agree) questions. The strategic
flexibility variable measures a firm’s ability and preparation to react quickly to major
change on three different aspects: customers' change in preferences, competitors' new
product lineups and general major change in technology. The technological innovation
capability is highly associated with strategic flexibility, as it indicates the flexibility and
readiness to change the firm’s business plan – in terms of innovation and new
technology adaptation in a product development process and overall strategy of a
company. All of the variables are estimated by an average of the score respondents gave
to the selected questions.
Moreover, I created a dummy variable “post” in order to analyze the competitive
advantage outcomes after the crisis. The new variable indicated whether it was a
post-crisis year (2012) or not (2002-2008). All of the separated interactions of the three
main independent variables with the dummy variable “post” were added to the OLS
Control Variables
For control purposes, four additional independent variables were included in the model.
The first one is the firm's past business performance, which may influence current
performance. Considering “path dependence” (Ermoliev, 1987), the higher the
performance before the crisis, the higher should be the performance after it, therefore it
was important to control for this effect. Secondly, I added the logged unit’s annual size
of sales as an indicator of a company's size and sales volume. It is a fixed indicator of
sales, referring to the levels taken from the first year measured – 2002. The mean of log
sales was 7.5 (min. value 5.0 and max. 9.9) with a standard deviation of 1.11. A higher
sales volume number results in more financial resources to sustain a firm’s stability,
which may lead to a higher probability of surviving an economic downturn. Hence, the
log of annual sales volume has been added to the model in order to control for these
differences in firm characteristics.
Another control variable is the product type produced by the automaker (assembler or
supplier). This variable is a dummy, since there were three categories of products:
vehicle, module and component part. The majority of our sample (47%) were
component part producers, 33% were module producers and the rest were vehicle
producers (car or truck). Finally, the headquarters nationality was added to the model,
which was also a dummy variable indicating if it is a Brazilian headquarter (35%) or not
(U.S., Argentina, Asia and European countries – 65%). Having a Brazilian-based
headquarter could be both beneficial and detrimental for business performance before
Table 2. Correlation Matrix for all the Variables
Construct 1 2 3 4 5 6 7 8 9 10
1. Product Characteristics 1
2. Strategic Flexibility .17 1 3. Tech. Innovation Capability .23 .29 1 4. Business Performance .57 .24 .27 1 5. Past Business Performance .17 .17 .05 .25 1 6. Sales Size (log) .56 .22 .14 .42 .34 1 7. Product Type – Vehicle .36 .15 .12 .27 .24 .65 1 8. Product Type – Module .46 .13 .07 .37 .25 .23 -.33 1 9. Product Type – Component -.72 -.24 -.16 -.57 -.43 -.73 -.46 -.67 1 10. Headquarters Nationality -.23 -.04 -.09 -.26 -.19 -.34 -.21 -.18 .33 1
4.4. Data analysis
Structural Equation Modeling and Confirmatory Factor Analysis
In order to validate the constructs of the dependent and main independent variables, I
used Structural Equation Modeling (SEM) to conduct the CFA for all the latent variables
separately and later to verify the full model [Table 3].
The first CFA analysis was performed on business performance, measured by six
indicators. All of them exceeded the recommended .40 cutoff point (Nunnally &
Bernstein, 1994) and ranged from .46 to .66 [Table 3]. The overall fit of the model was
very good, with the comparative fit index (CFI) = 1.0, Tucker-Lewis index (TLI) = 1.0,
root mean square error of approximation (RMSEA) = .00 and standardized root mean
squared residual (SRMR) = .01. The χ² (9) is 29.7 and all of the factor loadings were
was .73, which is above the suggested .70 standard cutoff value (Straub, 1989). Second,
the product quality, durability and prestige variable (H1) was tested with six selected
indicators ranked from .62 to .78 in the factor loading analysis. The measures of
goodness of fit were very appropriate, CFI = .98, TLI = .97, RMSEA = .06, SRMR = .02,
with χ² (9) = 27.6 and p < .000 for all the loadings. The Cronbach’s α (.84) indicated very
good construct reliability.
The next variables tested were strategic flexibility and technological innovation
capability (H2 and H3). All of their indicators had statistically significant loadings at p <
.000. The factor loadings ranked from .59 to .78 for strategic flexibility and from .52 to
.73 for innovation capability. For both, the received model fit was within the
recommended limits. The Cronbach’s α was estimated at .70 and .73, respectively.
Moreover, taking into account that all of the factor loadings for the variables were high
and the correlations between factors were relatively low, we could assume that the
condition for discriminant and convergent validity was met.
Finally, the full model was tested using the SEM approach. All of the measurement
factor loadings remained significant at the p < .000 level, ranging from .48 to .77 for the
standardized model (which means the latent variables have been rescaled to the
variance of 1.0). The results indicated that the covariance between strategic flexibility
and technological innovation capability is quite high, at .40 with p < .000, which shows a
moderately significant correlation between these latent constructs.
The product characteristics variable covariance with strategic flexibility was .20, and
with innovation capability was .23, with p < .000 for both, which proved quite a weak
the overall structural model fit for the data is very good, CFI = .96, TLI = .95, RMSEA =
.04, SRMR = .04, which means our model is well constructed and can be tested further.
Additionally, I ran the path analysis, which gave the first perspective over the
hypotheses validation. The path model tested the relationship between business
performance and the main explanatory variables. The path analysis supported a
positive significant relation between business performance and product quality,
durability and prestige (β = .58, p < .000), as well as with technological innovation
capability (β = .13, p < .02). However, it did not support the relationship between
performance and strategic flexibility (β = .10, p < .08).
Table 3. Measurement Models for Confirmatory Factor Analysis (SEM)
Main Variables Factor
Loadings
Composite Reliability
Business performance
In the last 12 months, in comparison to our 3 major competitors on scale 1-5: 1. Much Lower, 2. Lower, 3. About the Same, 4. Higher, 5. Much Higher
1. Business unit's performance measured by sales growth rate (was…) 2. Business unit's performance measured by market share.
3. Business unit's performance measured by profitability.
4. Business unit's performance measured by return on investment. 5. Business unit's performance measured by return on sales. 6. Business unit's financial performance (has been…)
.51 .46 .59 .66 .65 .50
Product quality, durability and prestige
In the last 12 months, in comparison to our 3 major competitors on scale 1-5: 1. Much Lower, 2. Lower, 3. About the Same, 4. Higher, 5. Much Higher
1. Overall product performance (was…) 2. Product durability/product life. 3. Product reputation.
4. Product prestige.
5. Freedom from product defects.
6. Quality of workmanship.
.65 .62 .72 .78 .65 .70 .84 Strategic flexibility
For both: Based on your personal opinion please indicate the degree to which you agree with the following statements: 1. Strongly Disagree, 2. Disagree Somewhat,
3. Neither Agree or Disagree, 4. Agree Somewhat, 5. Strongly Agree
1. In the event of a major change in customers' tastes and preferences, our business is prepared to quickly make adjustments in production to satisfy new customer demand.
2. In the event of a major change in our competitors’ product lineup, our business is prepared to quickly develop new products to meet head-on with our competitors.
3. In the event of a major change in technology, our business is prepared to quickly make adjustments in production to adapt to new technological standards.
.62
.78
.59
.70
Technological innovation capability
1. Have a business plan to use existing technology to enter new market segments.
2. Have a business plan to develop new technologies for new kinds/variations of products.
3. Have a business plan to develop collaboration and strategic alliances for developing and exploring new technologies.
4. Have a business plan to redesign our product development process.
.52
.70
.73 .59
The Model
In order to analyze the post-crisis performance of a firm with a given competitive
advantage, the following model was estimated:
!" = %&+ %()"+ %*+"+ %,+"∙ )"+ %./" + 0"
where 12 indicates business performance, 32 is a dummy indicating the year after the
crisis (post), 42 is the main independent variable and 42 ∙ 32 is the interaction between
each of the three main exploratory variables and the dummy. 52 represents the control
variables.
5. Results
Prior to testing the hypotheses, I examined the normality of data distribution and a
potential threat of multicollinearity in the sample. Regarding multicollinearity, all of the
variables' interactions with the main independent variables were below the variance
inflation factor (VIF) 10 cutoff point (Hair et al., 1998), except for the dummy variable
“post.” The highest mean VIF was 2.5 for the logged sales, the lowest was 1.14 for
technological innovation capability and all of the rest did not exceed the 2.0 level;
therefore, the threat of multicollinearity was eliminated. Proceeding with the Skewness
and Kurtosis tests for distributional normality, all the items show a Skewness value
between “+/- 2” (.54) and a Kurtosis lower than twice the value of the standard
deviation (Howell, 2003). Therefore, it can be concluded that the normality assumption
The OLS regression was used to test all of the hypotheses, and the results are shown in
the Tables 4-6. In the regression analysis at each stage, the standard errors were
clustered on a firm level in order to control for the correlations between the years
(since the firms were the same) and to avoid receiving an underestimated number of
standard errors.
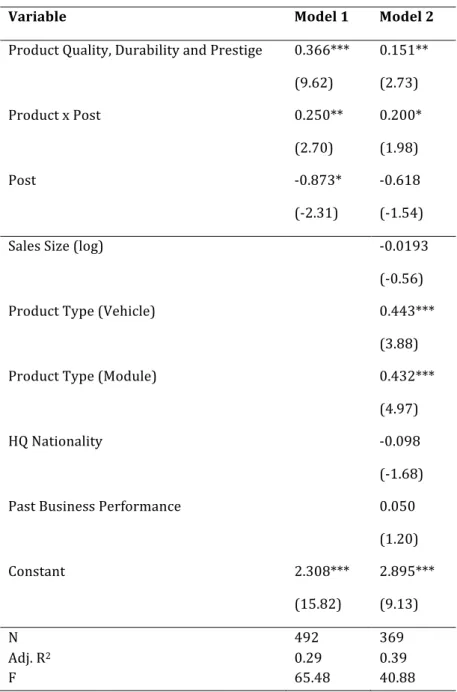
The results show that the resource-based view characteristics of firm’s product have an
impact on business performance [Model 1, 2 and 7]. The product quality, durability and
prestige variable is positively and significantly related to financial and operational
performance not only in general terms, taking into account the overall trend within
years, (β = .14, p = .014) [Model 7], but even more profoundly in influencing positive
performance after the crisis (β = .22, p = .039). This supports Hypotheses 1a and 1b.
This finding indicates that having highly competitive products in its business portfolio
helps a firm survive an economic downturn.
Strategic flexibility in product development, the first of the dynamic capabilities tested,
also has a significant and positive impact on business performance (β = .10, p = .016),
supporting Hypothesis 2a, but not after the crisis (H2b) [Model 3, 4 and 7]. The findings
suggest that being strategically flexible is beneficial in general terms, which is indicated
in the theory, but not in the case of economic turbulence. Having strategic flexibility in
product development can actually harm the firm (β = -.20, p = .019) since it has a
Table 4. Regression Analysis Results for Hypothesis 1
Variable Model 1 Model 2
Product Quality, Durability and Prestige 0.366*** (9.62)
0.151** (2.73)
Product x Post 0.250**
(2.70)
0.200* (1.98)
Post -0.873*
(-2.31)
-0.618 (-1.54)
Sales Size (log) -0.0193
(-0.56)
Product Type (Vehicle) 0.443***
(3.88)
Product Type (Module) 0.432***
(4.97)
HQ Nationality -0.098
(-1.68)
Past Business Performance 0.050
(1.20)
Constant 2.308***
(15.82)
2.895*** (9.13) N
Adj. R2
F 492 0.29 65.48 369 0.39 40.88
Table 5. Regression Analysis Results for Hypothesis 2 & 3
Variable Model 3 Model 4 Model 5 Model 6
Strategic Flexibility 0.150*** (3.39)
0.113** (2.69) Strategic Flexibility x Post 0.161*
(2.07)
-0.161* (-2.01)
Post -0.372
(-1.11) 0.934** (2.67) -0.357 (-1.11) 0.586 (1.76) Technological Innovation Capability 0.114*
(2.44)
0.119* (2.50)
Technological Innovation x Post 0.149*
(2.04)
-0.088 (-1.14)
Sales Size (log) -0.011
(-0.31)
-0.005 (-0.14)
Product Type (Vehicle) 0.682***
(6.68)
0.650*** (6.46)
Product Type (Module) 0.656***
(9.35)
0.638*** (9.24)
HQ Nationality -0.111
(-1.78)
-0.092 (-1.53)
Past Business Performance 0.043
(1.03)
0.042 (1.01)
Constant 2.980***
(16.44) 2.798*** (10.19) 3.160*** (18.37) 2.780*** (9.42) N
Adj. R2
F 492 0.09 41.52 369 0.37 39.52 492 0.08 39.20 369 0.37 41.52
The next hypothesis concerns technological innovation capability, and the analysis
supports its positive influence on overall firm performance, but only in the
economically stable period (β = .11, p = .019), which confirms H3a [Models 5-7].
However, this dynamic capability will not have any impact on business performance
after crisis, rejecting the second part of this hypothesis (3b).
These findings indicate that dynamic capabilities are not a remedy to survive an
economic downturn. In general, they might help a company perform better versus its
competitors in the market, but they are not strong enough to make a company survive a
crisis on a surplus. The only competitive advantage that will be positively related to
performance after a crisis is the superior product (in particular, its quality, durability
and prestige), so we can conclude that this is the strongest competitive advantage a firm
Table 6. Final Results for the Regression Analysis
Variable Model 7
Post 0.280
(0.58) Product Quality, Durability and Prestige (H1a) 0.140*
(2.50)
Post x Product (H1b) 0.227*
(2.09) Strategic Flexibility (H2a) 0.105*
(2.44) Post x Strategic Flexibility (H2b) -0.202*
(-2.39) Technological Innovation Capability (H3a) 0.114* (-2.37) Post x Technological Innovation (H3b) -0.060
(-0.84)
Sales Size (log) -0.026
(-0.79) Product Type (Vehicle) 0.463***
(4.03) Product Type (Module) 0.449***
(5.08)
HQ Nationality -0.110
(-1.84) Past Business Performance 0.060
(1.39)
Constant 2.125***
(5.66) N
Adj. R2
F
369 0.41 30.43
6. Discussion and Implications
The current study sheds additional light on the competitive advantage and
resource-based view theories. As predicted, all chosen RBV resources and dynamic capabilities
are very important and valuable for a firm’s competitive market position and its
superior performance in economically stable periods of time, which confirms the theory
(i.e., Teece, 1982; Barney, 1986; Fiol, 1991; Amit & Schoemaker, 1993; Collis &
Montgomery, 1995). Preceding and following the recession of 2008-2009, these
strategic assets were similarly examined in a non-friendly and turbulent period of
economic crisis. The analysis reveals interesting findings that could not have been
forseen easily.
Even though the literature gives importance to both firm’s competitive resources and
firm-specific capabilities and competences, there is a strong belief that the core is to
blend these resources into capabilities, which requires effective managerial decisions
and, therefore, superior “organizational, functional and technological” (Teece et al.,
1997: p. 510) skills and knowledge (Prahalad & Hamel, 1990; Conner, 1991; Ketchen,
Hult & Salter, 2007). Hence, it could be predicted that firms with dynamic capabilities
will have a better chance of surviving an economic crisis than those with the resources
alone. Moreover, taking into account superior organizational capabilities in terms of
innovation, technology and product development, which are highly correlated with a
positive business performance, the likelihood of overcoming the crisis should be even
stronger. Following this rationale, the research findings are intriguing. In contrast to
expectations, superior resources – in this case, valuable and prestigious products – are
the most effective in surviving an economic crisis and lead to better performance
It is even more interesting that technological innovation capability does not have any
impact on a firm’s ability to survive a crisis, and strategic flexibility in production
surprisingly has a negative influence on the operational and financial performance of a
company. It can be concluded that flexibility in quick production adaptations in the
event of major change will be more detrimental for business during a crisis. Some could
argue that this is caused by lack of objective analysis of the external threat at a given
moment, since each crisis is unique and there are diverse ways to approach each.
Therefore, being prepared for quick production adjustments might be very helpful in
stable conditions, but in a turbulent and unpredictable time, fast and impulsive changes
could be misleading and negatively impact firm performance. A business plan oriented
toward new technologies will not be helpful in surviving an economic downturn either,
possibly due to the duration and complexity of the implementation process of any type
of innovation. This might well indicate a lack of a clear answer on what kind of action to
undertake at the time of a crisis. Thus, being "traditional and conservative" in a certain
way and having a range of products that are characterized by high quality, durability
and, more profoundly, prestige and high reputation built within years, will be the most
effective weapon against an economic downturn.
Limitations
The current study is subject to certain limitations. First, the research was undertaken in
an emerging economy and may not represent other realities. The results could differ in
developed economies, since their environmental settings are more appealing. Second,
the survey’s questions have been designed to measure the dependent and main
objectivity, especially in case of the financial performance measure. Moreover, the data
represents only firms from one particular industry, which could circumscribe the
generalizability of the results. For instance, in the fashion industry, where the required
degree of innovation and creative flexibility is significantly higher, these findings might
not be confirmed.
7. Conclusion
It has been found that in emerging economies during a recession, firms should rely
more on their own resources and capabilities than on industry- and country-specific
effects in order to perform better (Bamiatzi et al., 2015). This study went further and
questioned the firm effects of strategic resources and capabilities in more detail. The
main goal was to identify whether all of them help manage crises effectively. This study
revealed that in the face of a globalized and severe economic crisis, the superior product
is more powerful in sustaining competitive advantage of a company and, therefore,
generating rent than any of the two capabilities that provide flexibility and innovation
in production. In order to cope with growing economic imbalances, strategy focus
should go to a solid development of competitive resources, instead of fast and flexible
8. References
Achrol, R., Kotler, P. (1991), “Marketing in the Network Economy”, Journal of Marketing, 63 (Special Issue), 146-63.
Amit, R., Schoemaker, P. (1993), 'Strategic assets and organizational rent', Strategic Management Journal 14(1), 33-46.
Argote, L. (1999), Organizational Learning –Creating, Retaining and Transferring Knowledge, 2nd Edition, Springer, New York.
Bamiatzi, V., Bozos, K., Cavusgil, S. T. & Hult, G. T. M. (2015), Revisiting the firm, industry, and country effects on profitability under recessionary and expansion periods: A multilevel analysis.
Strategic Management Journal, 10.
Barney, J. (1986), Organizational culture: Can it be a source of sustainable competitive advantage? Academy of Management Review, 11(3), 656-665.
Barney, J. (1991), Firm resources and sustained competitive advantage. Journal of Management,
17(1), 99-120.
Barney, J. (1997), Gaining and Sustaining Competitive Advantage. Addison-Wesley: Reading. MA.
Bowman, E. H., Hurry, D. (1993), Strategy through the Option Lens: An Integrated View of Resource Investments and the Incremental-Choice Process. The Academy of Management Review, 18(4), 760–782.
Brazilian Automotive Industry Association. (2015), Brazilian Automotive Industry Yearbook,
CEDOC, Sao Paulo, 1-156.
Calabro, G., D’Amico, A., Lanfranchi, M., Moschella G., Pulejo, L., Salomone R. (2011), Moving from the crisis to sustainability. Emerging issues in the international context, Franco Angeli, Italy.
Carrasco, E.R., Williams, S. (2012), Emerging Economies After the Global Financial Crisis: The Case of Brazil, Northwestern Journal of International Law & Business, 33(81).
Chung, C. C., Lee, S., Beamish, P., Isobe, T. (2010), Subsidiary expansion/contraction during times of economic crisis, Journal of International Business Studies, 41(3), 500-516.
Collis, D. J., Montgomery, C. A. (1995), Competing on resources: strategy in the 1990s, Harvard Business Review, 73(4).
Conner, K.R. (1991), A historical comparison of resource-based theory and five schools of thought within industrial organization economics: do we have a new theory of the firm? Journal of Management 17(1), 121–154.
Conner, K.R., Prahalad, C.K. (1996), A Resource-Based View Theory of the Firm: Knowledge versus Opportunism, Organization Science, 7(5), 477-501.
Day, G.S. (1994), The Capabilities of Market-Driven Organizations, Journal of Marketing, 58, 37-52.