Portable chlorophyll meter can estimate the nitrogen sufficiency
index and levels of topdressing nitrogen in common bean
1Pedro Marques da Silveira2, Augusto Cesar de Oliveira Gonzaga2
INTRODUCTION
Nitrogen fertilization is a practice commonly used for common bean crops. In the field, such practice is quantified by an empirical visual analysis of the crop or according to the traditional recommendation for each type of soil, based on its chemical analysis. This happens because virtually there has been no technical advance on the recommendation of this nutrient. When N fertilization is not suitable, there is a decrease in grain yield and/or an increase in production costs.
The portable chlorophyll meter, which provides instantaneous readings of leaves in a non-destructive way, is a practical alternative to evaluate the level of N in plants (Yadava 1986). The soil plant analysis development (SPAD) reading performed by the chlorophyll meter corresponds to the chlorophyll
ABSTRACT
RESUMO
content present in plant leaves (Takebe & Yoneyama 1989), and the chlorophyll content is correlated with the concentration of N in the plant and with crop yield (Schepers et al. 1992, Blackmer & Schepers 1995). According to Peng et al. (1993) and Chapman & Barreto (1997), the chlorophyll meter is a fast and inexpensive way to estimate the concentration of N in plant leaves. For Furlani Junior et al. (1996), positive correlations between SPAD readings and known N levels, and between readings and contents in leaves, indicate that there are favorable prospects for the use of a chlorophyll meter to detect deficiencies of N in common bean plants.
In addition to the availability of N, several factors, such as plant age, water content and population, farming, availability of other nutrients, environmental stress and biotic factors may affect the measurements of the green color intensity in
1. Manuscript received in Jul./2016 and accepted for publication in Nov./2016 (http://dx.doi.org/10.1590/1983-40632016v4742128). 2. Empresa Brasileira de Pesquisa Agropecuária (Embrapa Arroz e Feijão), Santo Antônio de Goiás, GO, Brazil. The nitrogen sufficiency index (NSI) obtained by
using a portable chlorophyll meter is a practical alternative to evaluate the N levels in plants. This study aimed at determining the appropriate NSI value for leaves of common bean plants, in order to define the need and amount of N to be applied as topdressing, using the Minolta SPAD-502 portable chlorophyll meter. Three field experiments were conducted using a randomized blocks design, with four replications. Nitrogen doses were applied as topdressing and compared with a treatment in which a high dose of N was used as a reference to calculate the NSI, whose value was 95 %. According to the results observed using the chlorophyll meter and the NSI, for each 0.1 percentage point increase in the NSI to reach the adequate level (95 %), it is necessary to apply 1.1-1.5 kg ha-1 of topdressing N.
KEYWORDS: Phaseolus vulgaris; nitrogen fertilization; SPAD-502.
Clorofilômetro portátil pode estimar o índice de suficiência de nitrogênio e os níveis de nitrogênio em cobertura em feijoeiro
O índice de suficiência de nitrogênio (ISN) obtido com o uso de clorofilômetro portátil é uma alternativa prática para avaliar o nível
de N em plantas. Objetivou-se determinar o valor adequado do ISN em
folhas de feijoeiro comum, para definição da necessidade e quantidade de N a ser aplicado em cobertura, utilizando-se o clorofilômetro portátil Minolta SPAD-502. Foram conduzidos três experimentos de campo, em delineamento de blocos ao acaso, com quatro repetições.
Doses de N foram aplicadas em cobertura e comparadas com um tratamento no qual foi aplicada alta dose de N, para ser utilizado
como referência no cálculo do ISN, cujo valor foi de 95 %. Com base nos resultados obtidos com o clorofilômetro e o ISN, para cada 0,1 ponto percentual de aumento no ISN para se atingir o nível adequado
(95 %), deve-se aplicar 1,1-1,5 kg ha-1 de N em cobertura.
leaves using the chlorophyll meter. Thus, to minimize the influence of those factors, a normalization method for the chlorophyll meter readings has been recommended for each cultivation area, farming, development stage, edaphoclimatic conditions and management practices.
The nitrogen sufficiency index (NSI) is a way of normalizing readings. It is calculated by dividing the average value obtained from chlorophyll readings in samples from an area to be fertilized with N by the average of readings in a reference area which was fertilized with N. This reference area should receive the maximum N dose recommended for the crop to allow a maximum chlorophyll concentration in leaves (Maia et al. 2012).
For corn, the NSI value used is 95 %. Thus, when the relative percentage of the chlorophyll sample is below 95 %, according to the reading in a given reference area, N fertilization is recommended (Blackmer & Schepers 1995, Waskom et al. 1996, Varvel et al. 1997). For common bean, according to Barbosa Filho et al. (2009), the application of topdressing N must be performed every time the NSI is lower than 90 % of the reference area. On the other hand, according to Maia et al. (2012), a NSI of 95 % evidences that bean plants are well supplied with N. Thus, the application of the nutrient is not necessary. Other studies on common bean, in Brazil, have related SPAD chlorophyll meter readings to N rates applied to a crop (Silveira et al. 2003, Didonet et al. 2005, Santana et al. 2010). However, Maia at al. (2012) did not advance to quantify the N dose to be applied. In the present scenario, it is understood that this information will contribute significantly to improve the recommendation of N fertilization for common bean.
This study aimed at determining the appropriate NSI value for common bean leaves to define the need and amount of N to be applied as topdressing, using the portable chlorophyll meter Minolta SPAD-502.
MATERIAL AND METHODS
Three field experiments were conducted at the Embrapa Arroz e Feijão, in Santo Antônio de Goiás, Goiás State, Brazil, in 2014 and 2015/2016, in order to obtain more consolidated information. Two experiments were conducted in the autumn-winter (dry season), using the Pérola cultivar, with a center pivot system irrigation, while the other experiment,
using the CNFC 15874 lineage, took place in the spring-summer (rainy season).
The experimental area was previously cultivated with corn. The planting spacing was 0.45 m between rows and 12 seeds were sown per meter.The planting fertilization in all experiments was 400 kg ha-1 of the formula 5-30-15. Each plot consisted of 5 rows (5 m in length).
The first experiment was performed on May 8 and the germination occurred on May 13, both in 2014. These dates are important, because the chlorophyll meter (used to quantify the N fertilization) requires a sequence of actions, such as the prior establishment of a reference area. The treatments consisted of six NSI values associated with two N fertilization criteria plus one reference area. A randomized blocks design in a factorial arrangement, with four replications, was used.
On May 21 (2014), eight days after the emergence of beans, a reference area was created with the application of 160 kg ha-1 of topdressing N. The application was held manually next to plants, in grooves dug with a mattock. Irrigation consisted of 8 mm of water afterwards fertilization.
At the beginning of the third trifoliate opening (V4 stage, on May 30, 2014), readings were taken with the chlorophyll meter in the first trifoliate stage (the oldest and consequently fully formed leaf). The NSI was calculated from readings made at the reference area and other plots. Shortly after, six treatments were established, corresponding to an idealized NSI of 95 %, 94 %, 93 %, 92 %, 91 % and 90 %. The NSI treatments were associated with two N fertilization criteria: application of 1.0 kg ha-1 and 1.5 kg ha-1 of N for each 0.1 percentage point lower than the NSI of the treatment. For example, if the initial NSI from readings (SPAD reading on May 30, 2014) was 90 % and the treatment was 95 % (5 % difference), 50 kg ha-1 and 75 kg ha-1 of N were applied in accordance with the two criteria. The same procedure was performed for the other NSI treatments.
considering the two fertilization criteria (Table 1). Then, the topdressing fertilization was performed.
On June 17 (2014), 15 days after the topdressing fertilization, a new SPAD reading was performed. On August 12 (2014), a collection of plants was performed to determine grain yield. Three central rows from each plot were collected, being 1 m discarded on each side of the rows.
The second experiment (randomized blocks), also using the Pérola cultivar, was conducted following a sequence of operations similar to the previous experiment. The sequence was planting (June 09, 2015), emergence (June 15, 2015), implementation of the reference area by applying 150 kg ha-1 of N (June 30, 2015), determination of the NSI and implementation of treatments (July 14, 2015) and harvest (September 12, 2015).
Similarly, for the third experiment (CNPF 15874), the sequence was planting (November 12, 2015), emergence (November 17, 2015), implementation of the reference area (November 27, 2015), determination of the NSI and implementation of treatments (December 9, 2015) and harvest (January 26, 2016).
In the second and third experiments, a different methodology from that used for the first experiment was adopted, aiming at defining the N treatments. The objective was to quantify the amount of nutrient to be applied to the crop. Then, the NSI was determined and compared to the NSI of 95 %, an index reported by Maia et al. (2012) as suitable for plants well fertilized with N. Adjustment fertilization factors of 0.4 kg ha-1, 0.8 kg ha-1, 1.2 kg ha-1 and 1.6 kg ha-1 of N were applied for each 0.1 percentage point lower than the NSI of 95 %. The NSI obtained was 90 % in the second experiment and 85.4 % in the third experiment. Thus, according to the fertilization adjustment factors, the N doses were, respectively,
20 kg ha-1, 40 kg ha-1, 60 kg ha-1 and 80 kg ha-1 in the second experiment, and 38 kg ha-1, 77 kg ha-1, 115 kg ha-1 and 154 kg ha-1 in the third experiment. There is also a treatment without N fertilization.
In the first and second experiments, an irrigation meter was used to control irrigation (Silveira et al. 2009). Grain yields of all plots were determined and, in the first experiment, the NSI values after the implementation of treatments were determined. Data were subjected to analysis of variance and regression analysis.
RESULTS AND DISCUSSION
The NSI and grain yield of common bean (Pérola cultivar) plants, during the winter harvest of 2014, in relation to N treatments, are shown in Table 2. There were positive effects of N doses on grain yield. Figure 1 shows grain yields, in relation to N doses applied to bean plants as topdressing. Data fitted a quadratic model (Y = 2579.7 + 10.084x - 0.0526x2, R2 = 0.6733, significant at 1 %). The maximum grain yield (3,063 kg ha-1) was estimated at a N dose of 95.8 kg ha-1.
Several studies show a positive linear or quadratic response for common bean yield, due to the application of N. The response depends on the cultivar (Silveira et al. 2003), source of N (Cunha et al. 2011, Bernardes et al. 2015), preceding crop (Silveira et al. 2005) and tillage system (Silva & Silveira 2000). Bean is considered a plant with great demand for N (Cunha et al. 2011), which is an
NSI treatment C1 C2
% _______________ kg ha-1 _______________
90 9 13.5
91 19 28.5
92 29 43.5
93 39 58.5
94 49 73.5
95 59 88.5
Table 1. Amount of nitrogen applied as topdressing to common
bean plants, according to the nitrogen sufficiency index
(NSI) and the fertilization criteria (C1 and C2).
N doses NSI Grain yield
kg ha-1 % kg ha-1
9.0 84.30 2,600.00
13.5 87.60 2,812.00
19.0 88.80 2,769.00
28.5 89.70 2,885.00
39.0 89.60 2,766.00
43.5 90.10 3,005.00
49.0 91.10 2,919.00
58.5 91.60 2,900.00
59.0 92.70 2,870.00
73.5 93.40 3,083.00
88.5 95.10 3,201.00
160.0 100.00 2,824.00
CV (%) 6.93 10.32
Table 2. Nitrogen sufficiency index (NSI) and grain yield of common bean plants (Pérola cultivar), during the winter
element of the chlorophyll (Blackmer & Schepers 1995).
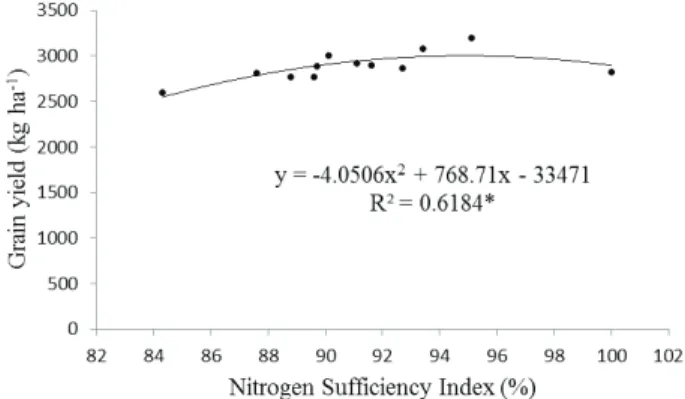
The yield for common bean grains varied according to the NSI (Figure 2). Data fitted a quadratic model (Y = -33.471 + 768.71x - 4.0506x2, R2 = 0.6184,significant at 5 %). The maximum yield was reached with a NSI of 94.9 %, which may be considered equal to 95 %. This index is also reported by Maia et al. (2012) as the value at which the plants are well supplied with N, requiring no additional application of the nutrient. Barbosa Filho et al. (2009) reported that the application of N should be made to common bean only when the NSI is less than 90 %. For Maia et al. (2012), a NSI of 90 % evidences the need for the application of the nutrient. A NSI of 95 % is recommended for corn (Blackmer & Schepers 1995, Waskom et al. 1996, Varvel et al. 1997).
Studies such as those by Silveira et al. (2005) and Santana et al. (2010) are limited to relating SPAD values from the chlorophyll meter to grain yield. However, the SPAD value is influenced by many factors, as previously reported. Therefore, the NSI was suggested. Scientific studies on the definition of a NSI for common bean are rare. Moreover, existing studies do not progress toward identifying the NSI value for a given situation, as they do not interpret and recommend the application of N to the crops studied. Thus, it is possible to verify the real importance of the NSI and, consequently, of the chlorophyll meter.
Figure 3 shows the NSI as a function of N doses applied as topdressing to common bean plants. The data fitted a linear model (Y = 0.0925x + 86.227, R2 = 0.931, significant at 1 %). According to the equation, in order to obtain an estimated 95 % for the NSI, the required N dose is 94.8 kg ha-1, while for
a NSI of 94 %, the N dose is 84 kg ha-1. Thus, for a 0.1 percentage point increase in the NSI, the required N dose is 1.1 kg ha-1 higher.
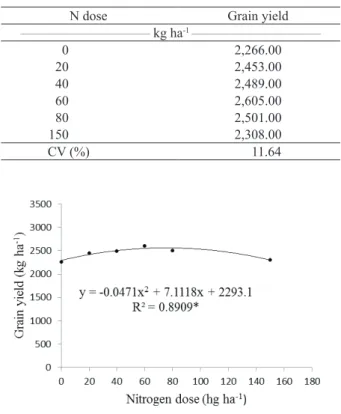
The common bean (Pérola cultivar) grain yield for the different N treatments, established during the winter harvest of 2015, are shown in Table 3. There were significant effects of N doses on the bean grain yield. The regression equation was fitted as shown in Figure 4.
According to the fitted equation (Figure 4), the N dose for the maximum grain yield was 75 kg ha-1. To obtain the fertilizer adjustment factor, which is proposed to define the fertilization required for a NSI of 95 % (corresponding to a dose of 75 kg ha-1), itis necessary to fit the regression equation considering the adjustment factor (0.4 kg ha-1, 0.8 kg ha-1, 1.2 kg ha-1 and 1.6 kg ha-1 of N) and the N dose applied (20 kg ha-1, 40 kg ha-1, 60 kg ha-1 and
Figure 1. Common bean (Pérola cultivar) grain yield, as a
function of topdressing nitrogen doses. Regression adjusted for data obtained for the winter harvest of 2014.
Figure 3. Nitrogen sufficiency index, as a function of topdressing
nitrogen doses. Regression adjusted for data obtained for the winter harvest of 2014.
Figure 2. Common bean (Pérola cultivar) grain yield, as a function of the nitrogen sufficiency index. Regression
80 kg ha-1). The fitted equation was Y = 0.02x (R2 = 1.00). Thus, according to the equation for the 75 kg ha-1 dose, the fertilization adjustment factor is 1.5.
The yield of the CNPF 15874 common bean grains, planted during the wet season of 2015, as a function of N rates, is shown in Table 4. There were significant effects of N doses on the bean grain yield. The regression equation was fitted as shown in Figure 5. According to the adjusted equation (Y = 2,177.3 + 15.897x - 0.0635x2, R2 = 0.8507**), the N dose for the maximum grain yield was 125 kg ha-1 and the yield was estimated at 3,166 kg ha-1. Similarly to the second experiment, a regression equation was elaborated considering the adjustment factors and the N dose applied, as it follows: Y = 0.0104x + 0.0052 (R2 = 1.00). For the 125 kg ha-1 dose, the fertilization adjustment factor is 1.3, i.e., 1.3 kg ha-1 of N for each each 0.1 percentage point of the NSI lower than 95 %.
The results of the three experiments showed that the maximum common bean yields were 2,559 kg ha-1, 3,063 kg ha-1 and 3,166 kg ha-1. Such yields are within the productive potential of the crop obtained by using these cropping systems, which is above 2,500 kg ha-1 (Silveira et al. 2003). To achieve such yields, the topdressing N doses were, respectively, 75 kg ha-1, 95.8 kg ha-1 and 125 kg ha-1. These doses are within those reported for the crop (Silveira & Damasceno 1993, Silva & Silveira 2000, Bernardes et al. 2014).
The correlations between doses and fertilization adjustment factors ranged 1.1-1.5 kg ha-1 of N for each 0.1 percentage point of NSI lower than 95 %. This indicates that this is the range of values that should be applied when using chlorophyll and NSI values for the quantification of N to be applied as topdressing to common bean plants. Under field conditions, besides detecting the need of small N doses, for example, doses smaller than 10-15 kg ha-1,
Figure 4. Common bean (Pérola cultivar) grain yield, as a
function of topdressing nitrogen doses. Regression adjusted for data obtained for the winter harvest of 2015.
N dose Grain yield
_________________________________ kg ha-1 _________________________________
0 2,266.00
20 2,453.00
40 2,489.00
60 2,605.00
80 2,501.00
150 2,308.00
CV (%) 11.64
Table 3. Common bean (Pérola cultivar) grain yield, as a function
of topdressing nitrogen doses. Data obtained for the winter harvest of 2015.
Figure 5. CNFP 15874 common bean grain yield, as a function of topdressing nitrogen doses. Regression adjusted for data obtained for the wet season of 2015/2016.
N dose Grain yield
_________________________________ kg ha-1 _________________________________
38 2,902.0
77 2,993.0
115 2,975.0
150 3,319.0
154 3,046.0
CV (%) 11.8
when the NSI is close to 95 %, an economic study of benefits/costs should be considered. The fertilization costs and returns obtained from small increases in yield should be analyzed for a decision-making evaluation, regarding the application of the nutrient.
CONCLUSIONS
1. The nitrogen sufficiency index (NSI) for common bean is 95 %;
2. Using the SPAD-502 portable chlorophyll meter and the NSI, for each 0.1 percentage point increase in the NSI to reach the adequate level (95 %), it is necessary to apply 1.1-1.5 kg ha-1 of topdressing N.
REFERENCES
BARBOSA FILHO, M. P. et al. Época de aplicação
de nitrogênio no feijoeiro irrigado monitorada com auxílio de sensor portátil. Ciência e Agrotecnologia, v. 33, n. 2, p. 425-431, 2009.
BERNARDES, T. G. et al. Produtividade do feijoeiro irrigado em razão de fontes de adubo nitrogenado
estabilizado e de liberação controlada. Revista Ceres, v. 62, n. 6, p. 507-513, 2015.
BERNARDES, T. G. et al. Resposta do feijoeiro de
outono-inverno a fontes e doses de nitrogênio em cobertura.
Bioscience Journal, v. 30, n. 2, p. 458-468, 2014.
BLACKMER, T. M.; SCHEPERS, J. S. Use of chlorophyll meter to monitor nitrogen status and schedule fertigation for corn. Journal of Production Agriculture, v. 8, n. 1, p. 56-60, 1995.
CHAPMAN, S. C.; BARRETO, H. J. Using a chlorophyll
meter to estimate specific leaf nitrogen of tropical maize
during vegetative growth. Agronomy Journal, v. 89, n. 4, p. 557-562, 1997.
CUNHA, P. C. R. et al. Fontes, formas de aplicação e doses de nitrogênio em feijoeiro irrigado sob plantio direto.
Pesquisa Agropecuária Tropical, v. 41, n. 1, p. 80-86, 2011.
DIDONET, A. D.; BRAZ, A. J. B. P.; SILVEIRA, P. M. da.
Adubação nitrogenada de cobertura no feijoeiro irrigado: uso do clorofilômetro. Bioscience Journal, v. 21, n. 3, p. 103-111, 2005.
FURLANI JUNIOR, E. et al. Correlação entre leituras de clorofila e níveis de nitrogênio aplicados em feijoeiro.
Bragantia, v. 55, n. 1, p. 171-175, 1996.
MAIA, S. C. M. et al. Uso do índice de suficiência de nitrogênio na estimativa da necessidade de adubação
nitrogenada em feijoeiro. Revista Brasileira de Ciência do Solo, v. 36, n. 1, p. 183-191, 2012.
PENG, S. et al. Adjustment for specific leaf weight improves chlorophyll meter’s estimate of rice leaf nitrogen concentration. Agronomy Journal, v. 85, n. 5, p. 987-990, 1993.
SANTANA, E. V. P.; SANTOS, A. B. dos; SILVEIRA,
P. M. da. Adubação nitrogenada na produtividade, leitura SPAD e teor de nitrogênio em folhas do feijoeiro. Pesquisa Agropecuária Tropical, v. 40, n. 4, p. 491-496, 2010.
SCHEPERS, J. S. et al. Comparison of corn leaf nitrogen concentration and chlorophyll meter reading. Communications in Soil Science and Plant Analysis, v. 23, n. 17-20, p. 2173-2178, 1992.
SILVA, C. C. da; SILVEIRA, P. M. da. Influência de sistemas agrícolas em características do solo e na resposta
do feijoeiro (Phaseolus vulgaris L.) irrigado à adubação nitrogenada em cobertura. Pesquisa Agropecuária Tropical, v. 30, n. 1, p. 86-96, 2000.
SILVEIRA, P. M. da et al. Adubação nitrogenada no
feijoeiro sob plantio direto em sucessão a culturas. Pesquisa Agropecuária Brasileira, v. 40, n. 4, p. 377-381, 2005.
SILVEIRA, P. M. da et al. Manejo da irrigação do feijoeiro com o uso do irrigâmetro. Santo Antônio de Goiás:
Embrapa Arroz e Feijão, 2009. (Circular técnica, 84).
SILVEIRA, P. M. da; BRAZ, A. J. B. P.; DIDONET, A. D.
Uso do clorofilômetro como indicador da necessidade de adubação nitrogenada em cobertura no feijoeiro. Pesquisa Agropecuária Brasileira, v. 38, n. 9, p. 1083-1087, 2003.
SILVEIRA, P. M. da; DAMASCENO, M. A. Doses e parcelamento de K e de N na cultura do feijoeiro irrigado. Pesquisa Agropecuária Brasileira, v. 28, n. 11, p. 1269-1276, 1993.
TAKEBE, M.; YONEYAMA, T. Measurement of leaf color scores and its implication to nitrogen nutrition of rice plants. Japan Agricultural Research Quarterly, v. 23, n. 1, p. 86-93, 1989.
VARVEL, G. E.; SCHEPERS, J. S.; FRANCIS, D. D.
Ability for in-season correction of nitrogen deficiency
in corn using chlorophyll meters.Soil Science Society of America Journal, v. 61, n. 4, p. 1233-1239, 1997.
WASKOM, R. M. et al. Monitoring nitrogen status of corn with a portable chlorophyll meter. Communications in Soil Science and Plant Analysis, v. 27, n. 3, p. 545-560, 1996.