ORIGINAL INVESTIGATION
Impact of combined training with different
exercise intensities on inflammatory and lipid
markers in type 2 diabetes: a secondary analysis
from a 1-year randomized controlled trial
João P. Magalhães
1*, Diana A. Santos
1, Inês R. Correia
1, Megan Hetherington‑Rauth
1, Rogério Ribeiro
2,
João F. Raposo
2, Andreia Matos
3,4,5,6, Manuel D. Bicho
3,4and Luís B. Sardinha
1Abstract
Background: Exercise is a well‑accepted strategy to improve lipid and inflammatory profile in individuals with type
2 diabetes (T2DM). However, the exercise intensity having the most benefits on lipids and inflammatory markers in patients with T2DM remains unclear. We aimed to analyse the impact of a 1‑year combined high‑intensity interval training (HIIT) with resistance training (RT), and a moderate continuous training (MCT) with RT on inflammatory and lipid profile in individuals with T2DM.
Methods: Individuals with T2DM (n = 80, aged 59 years) performed a 1‑year randomized controlled trial and were
randomized into three groups (control, n = 27; HIIT with RT, n = 25; MCT with RT, n = 28). Exercise sessions were super‑ vised with a frequency of 3 days per week. Inflammatory and lipid profiles were measured at baseline and at 1‑year follow‑up. Changes in inflammatory and lipid markers were assessed using generalized estimating equations.
Results: After adjusting for sex, age and baseline moderate‑to‑vigorous physical activity (MVPA), we observed a
time‑by‑group interaction for Interleukin‑6 (IL‑6) in both the MCT with RT (β = − 0.70, p = 0.034) and HIIT with RT (β = − 0.62, p = 0.049) groups, whereas, only the HIIT with RT group improved total cholesterol (β = − 0.03, p = 0.045) and LDL‑C (β = − 0.03, p = 0.034), when compared to control. No effect was observed for C‑reactive protein (CRP), cortisol, tumour necrosis factor‑α (TNF‑α), soluble form of the haptoglobin‑hemoglobin receptor CD163 (sCD163), triglycerides and HDL‑C in both groups (p > 0.05).
Conclusions: Favorable adaptations on IL‑6 were observed in both the HIIT and MCT combined with RT groups fol‑
lowing a long‑term 1‑year exercise intervention in individuals with T2DM. However, only the HIIT with RT prevented further derangement of total cholesterol and LDL‑C, when compared to the control group. Therefore, in order to encourage exercise participation and improve inflammatory profile, either exercise protocols may be prescribed, however, HIIT with RT may have further benefits on the lipid profile.
Trial registration Clinicaltrials.gov ID: NCT03144505
Keywords: High‑intensity interval training, Moderate continuous training, Exercise, Resistance training
© The Author(s) 2020. This article is licensed under a Creative Commons Attribution 4.0 International License, which permits use, sharing, adaptation, distribution and reproduction in any medium or format, as long as you give appropriate credit to the original author(s) and the source, provide a link to the Creative Commons licence, and indicate if changes were made. The images or other third party material in this article are included in the article’s Creative Commons licence, unless indicated otherwise in a credit line to the material. If material is not included in the article’s Creative Commons licence and your intended use is not permitted by statutory regulation or exceeds the permitted use, you will need to obtain permission directly from the copyright holder. To view a copy of this licence, visit http://creat iveco mmons .org/licen ses/by/4.0/. The Creative Commons Public Domain Dedication waiver (http://creat iveco mmons .org/publi cdoma in/ zero/1.0/) applies to the data made available in this article, unless otherwise stated in a credit line to the data.
Background
Individuals with type 2 diabetes (T2DM) have a height-ened risk of all-cause mortality and cardiovascular dis-ease (CVD), especially those with traditional CVD risk
Open Access
*Correspondence: [email protected]
1 Exercise and Health Laboratory, CIPER, Faculdade de
Motricidade Humana, Universidade de Lisboa, Estrada da Costa, 1499‑002 Cruz‑Quebrada, Portugal
factors, such as hypertension, hyperglycaemia, abdomi-nal obesity, and dyslipidaemia [1]. Low-grade sys-temic inflammation has been suggested as the common denominator linking T2DM, insulin resistance, endothe-lial dysfunction, metabolic syndrome, and CVD [2]. When released by adipose tissue as adipokines, tumour necrosis factor-α (TNF-α) and interleukin-6 (IL-6) pro-mote low-grade systemic inflammation, which in turn is associated with chronic deleterious conditions such as insulin resistance, T2DM and obesity [2–5]. Another bio-marker, connecting low-grade inflammation and T2DM, is the soluble form of the haptoglobin-hemoglobin receptor CD163 (sCD163), with observational studies suggesting that individuals with obesity have increased concentrations of sCD163 [6] putting them at higher risk for T2DM [7].
Exercise, especially the combination of both aerobic and resistance training (RT) [8], has many health ben-efits for patients with T2DM, including improved body composition [9, 10], insulin sensitivity [10–12], lipid pro-file, and reduced low-grade systemic inflammation [13]. However, exercise permutations, such as in the duration and intensity of the exercise performed, may influence the inflammatory and lipid profile differently. Recently, high-intensity interval training (HIIT) has emerged as a viable alternative in several conditions including those with CVD [14], obesity [15], and diabetes [16], while having the same or even superior health benefits, to that of the more commonly performed exercise modal-ity of moderate continuous training (MCT) [15–17]. In fact, a previous review with T2DM individuals suggests that short to medium-term HIIT interventions improve glycaemic control, lipid profile, body composition, and cardiorespiratory fitness [18]. However, the same review suggested that there was no consensus on the long-term effects of HIIT, nor the effectiveness of HIIT vs. MCT on lipid profile in individuals with T2DM, mainly owing to the inexistence of longer interventions or the reduced number of randomized control trials (RCT) analys-ing both protocols. As far as the inflammatory profile goes, just two non-RCTs analysed the impact of HIIT in individuals with T2DM, with both having a short inter-vention duration (< 12-weeks) and with the results sug-gesting limited impact [19, 20]. Given that currently the information related with HIIT and its impact on both the lipid and inflammatory profile is derived from short to medium-term investigations (≤ 24-weeks), it is para-mount to understand if these previous findings can be replicated in longer-term controlled exercise interven-tions, as HIIT has been shown to be a highly demanding type of exercise [21].
To the best of our knowledge, no investigation has ana-lysed the long-term impact of combined aerobic exercise
of different intensities with RT on both the inflammatory and lipid profile in individuals with T2DM. Therefore, the present investigation aimed to analyse the effects of a 1-year RCT consisting of a control, a combined MCT with RT, and a combined HIIT with RT group, on the inflammatory and lipid profile in individuals with T2DM. Methods
Participants, randomization, and blinding
This investigation was part of a larger RCT performed between February 2014 to July 2016 at the Exercise and Health Laboratory, Faculty of Human Kinetics, Univer-sity of Lisbon, and was carried out following the recom-mendations of the Declaration of Helsinki for Human Studies. The protocol was approved by the Ethics Com-mittee of the Portuguese Diabetes Association (approval number: 07/17/2013). Written informed consents were obtained from all participants.
The complete study protocol has been previously published [22]. Briefly, individuals with T2DM were recruited to analyse the impact of a 1-year exercise inter-vention with different intensities on glycated haemoglo-bin (HbA1c) (clinicaltrials.gov ID:NCT03144505). Eighty patients were recruited within the Lisbon Metropoli-tan Area (Fig. 1) [22], and posteriorly randomized into three groups (control, HIIT with RT or MCT with RT). An external researcher, with an allocation ratio of 1:1:1, used a computer-generated list of random numbers, for the randomization process. The researchers performing the assessments were blinded to group randomization. Inclusion criteria for participants included adults diag-nosed with T2DM [23], age between 30 and 75 years old, no major micro or macro vascular complications from diabetes, body mass index < 48 kg/m2, and no limita-tions that would prevent them from practicing exercise. The main outcome power and sample size calculations (G-Power, Version 3.1.3) were based on a predicted HbA1c difference of 0.66% with a SD of 1.2%, α = 0.05, 1-β = 0.80 and an expected dropout rate of 10% [24]. For this analysis, the power and sample size calculations were based on changes in whole-body fat, which is related with overall inflammatory profile. Given a predicted whole-body fat difference of 2.7%, with a SD of 1.7%, α = 0.05, 1-β = 0.80, the sample used on this study was powered for this analysis [16].
The control group had an initial standard physical activity (PA) recommendation session and no struc-tured exercise. All of the exercise groups (i.e. the MCT and HIIT group) had three supervised exercise sessions per week, monitored with a heart rate polar band (Polar T-31, USA). The exercise programs of both groups were developed to have matched energy expenditure, with a weekly target of 10 kcal/kg, which was updated monthly
for their body weight and every 3 months for their peak oxygen consumption.
The MCT and HIIT groups had an exercise periodi-zation for the 1-year divided in two and three phases, respectively. Heart rate reserve (HRR), calculated through the Karvonen formula [25], was used to achieve
prescribed intensities. Phase 1 was identical for both groups (weeks 1–4), with patients performing continu-ous cycling of moderate-intensity (40–60% of the HRR) with durations increasing from 15 min to 25 by the end of week 4. The MCT group had only one additional phase (training phase, weeks 5–52), where participants Fig. 1 Study flow chart
exercised at 40 to 60% of the HRR, with durations based on prescribed energy expenditure targets.
In the HIIT group, during phase 2 (5–8 weeks), patients performed bouts of 2 min of cycling at 70% of the HRR followed by 1 min at 40–60% of the HRR (weeks 5–6), and increased to bouts of 80% (1.5 min) of the HRR followed by 1 min at 40–60% of the HRR (weeks 7–8), while maintaining energy expenditure targets. In phase 3 (weeks 9–52), participants in the HIIT group performed 1 min of exercise at 90% of their HRR followed by 1 min resting at 40-60% of the HRR. Both the MCT and HIIT group were further complemented with a whole-body RT, after the aerobic component, which included 1 set of 10–12 RM of eight exercises (seated row, pulldown, chest press, shoulder press, leg press, one leg lung, dead bug and regular plank).
Anthropometry and body composition
Patients were weighed on an electronic scale, to the near-est 0.01 kg while wearing minimal clothes (Seca, Ham-burg, Germany). Height was measured to the nearest 0.1 cm with a stadiometer (Seca, Hamburg, Germany). Waist circumference was taken according to the stand-ardized procedures of the National Institute of Health [26].
Dual energy X-ray absorptiometry (Hologic Explorer-W, Waltham, USA) was used to assess regional and total body fat, following standardized protocols and proce-dures set out by the manufacturer. Whole-body fat index (WBFI) and abdominal fat index (AFI) were calculated by dividing the total and abdominal fat mass by the square of the height (kg/m2).
Objective measures of moderate‑to‑vigorous physical activity
Moderate-to-vigorous PA (MVPA) was assessed by accel-erometry (ActiGraph, GT3X + , FL, USA) at baseline prior to the start of the intervention. All participants used the accelerometer for 7 days, on the right hip. The devices were activated on raw mode with a 100 Hz fre-quency and later transformed into 15-s epochs. The Troi-ano et al. [27] cut points and wear time validation criteria were used.
Laboratory measurements
Blood collection was performed in a seated position from the antecubital vein at rest after an overnight fast into dry tubes and into tubes containing ethylenediamine-tetraacetic acid as an anticoagulant. Biological samples were centrifuged at 500g at 4 °C for 15-min and plasma samples were frozen at − 80 °C for posterior analysis.
Serum samples were used to analyse the lipid profile of the participants, including the quantification of total
cholesterol, LDL-C and HDL-C cholesterol, and triglyc-erides using colored enzymatic tests in an automated analyser (auto analyser Olympus AU640, Beckman Coul-ter). Plasma samples were then used for TNF- α, IL-6, sCD163, C-reactive protein (CRP), and cortisol quantifi-cation using commercial ELISA kits (DiaSource Immuno Assays S.A for TNF-α, IL6, and Cortisol; IBL Interna-tional GMBH for CRP; and DC1630, R&D Systems for sCD163).
Changes in the lipid and inflammatory profile were analyzed at baseline and at the 1-year follow-up.
Statistical analysis
Data analyses were performed using SPSS Statistics ver-sion 22.0 (SPSS Inc., an IBM Company, Chicago, Illi-nois, USA). Results are presented as mean ± SD for all normally distributed outcomes and as median and inter-quartile range for skewed outcomes. Comparisons between groups were performed using the Chi-squared test for sex proportions between groups, and the para-metric independent sample ANOVA test with a Bonfer-roni post hoc analysis for normally distributed variables or the non-parametric Kruskal–Wallis test in absence of normality.
Between-group and within-group effects for the lipid inflammatory profile were performed using generalized estimating equations followed by a least significant dif-ference post hoc test. Models were adjusted for potential confounders (i.e. age, sex and baseline MVPA). All the outcomes went through an intention-to-treat analysis (ITTA). An additional per-protocol analysis (PPA) was performed in only those who completed both assess-ments (i.e. baseline and 1-year), had at least 70% attend-ance to all the exercise sessions, and in those without substantial changes in pharmacological therapy [22]. No changes were made to dyslipidemia and hypertension medication, however, individuals with major changes in anti-hyperglycemic medication, such as transitioning to insulin, were removed from the (PPA).
Results
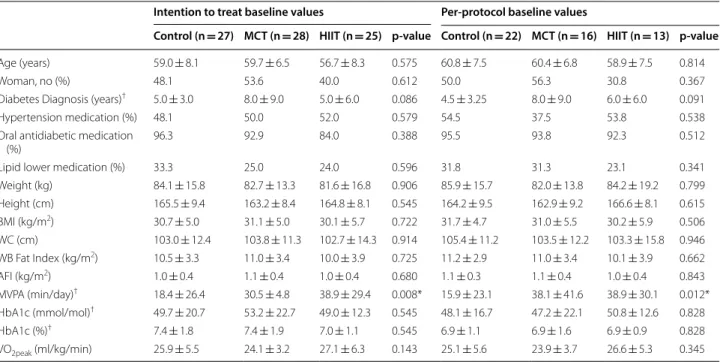
Table 1 shows the baseline characteristics of the individu-als by intervention group and in the ITTA and PPA. No significant differences between groups were observed at baseline in both analyses, except for baseline time spent in MVPA (Table 1). For the control, MCT and HIIT groups, the dropout rates were 11%, 18%, and 24%, respectively (Fig. 1). In the PPA, individuals in the MCT and HIIT group trained for 45.0 ± 7.1 min/session and 33.1 ± 6.4 min/session, and had mean percent training adherences of 86.2% and 86.8%, respectively. Three indi-viduals reported injuries during the intervention, two in the HIIT group while performing the leg-press exercise
and one from the MCT group while performing the back-row exercise. The cardiovascular event reported in the flow chart took place during the participant’s day-to-day routine and was not related to the intervention.
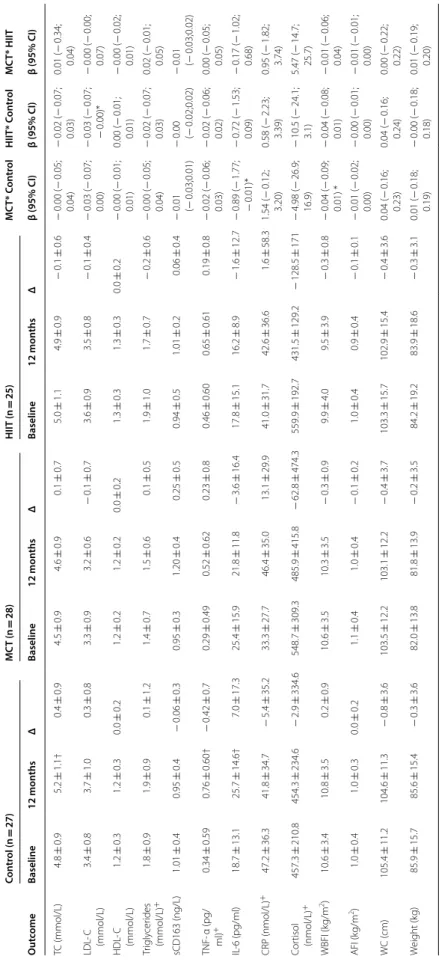
Table 2 presents the body composition, the inflamma-tory (IL-6, TNF-α, CRP, sCD163 and cortisol) and lipid (LDL-C, HDL-C, and triglycerides) profile outcomes assessed at baseline and at follow-up by group, as well as the respective time-by-group interactions between each intervention group (MCT vs. HIIT vs. control) using the ITTA. All models were adjusted for sex, age, and baseline MVPA. Following adjustments, the ITTA analysis suggested that the HIIT prevented further derangement on total cholesterol (β = − 0.03, p = 0.045) and LDL-C (β = − 0.03, p = 0.034) when compared to the control, whereas the MCT had no effect on the lipid profile variables (p > 0.05). Only the MCT group had changes in WBFI (β = − 0.06, p = 0.025) and AFI (β = − 0.01, p = 0.011). Regarding the inflammatory profile, both the MCT (β = − 0.70, p = 0.034) and HIIT (β = − 0.62, p = 0.049) prevented further derangement (p < 0.05) in the levels of IL-6 following the 1-year inter-vention, when compared to controls. For the remain-ing inflammatory variables, no changes (> 0.05) were observed for both intervention groups compared to
controls including the sCD163 biomarker. Moreover, there was no time-by-group interaction (p > 0.05) in any of the biomarkers measured when comparing both exercise groups (i.e. HIIT vs MCT).
Table 3 summarizes the results of the PPA for the lipid, inflammatory and body composition profile. As a result of the 1-year HIIT and MCT intervention, the HIIT group prevented further deterioration of the LDL-C pro-file (β = − 0.03, p = 0.049), when compared to control. On the other hand, no changes were observed between both groups and control for the remaining lipid pro-file variables, including total cholesterol, HDL-C, and triglycerides (p > 0.05). Within the inflammatory pro-file, IL-6 followed the same trend as in the ITTA for the MCT group (β = − 0.89, p = 0.047), while there were no changes for the HIIT group (β = − 0.72, p = 0.081). For both intervention groups, there was no time-by-group interaction (p > 0.05) for cortisol, TNF-α, sCD163, and CRP, when compared to control. Lastly, in line with the results from the ITTA, no time-by-group interaction (p > 0.05) was found between MCT and HIIT for any of the biomarkers assessed.
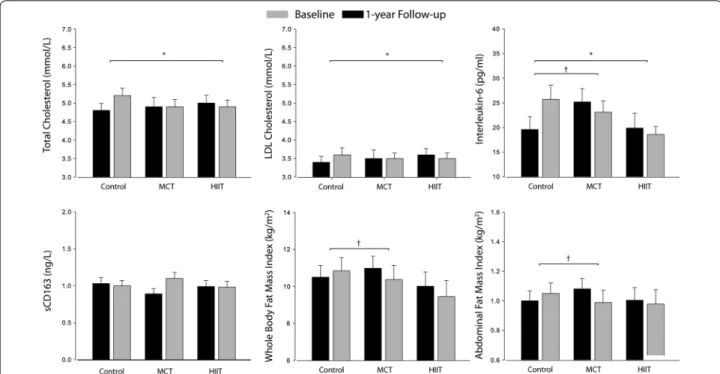
Figure 2 depicts data from the absolute values on baseline and 1-year follow-up for the C-LDL, total cho-lesterol, IL-6, sCD163, WBFI and AFI using the ITTA.
Table 1 Baseline characteristics of the participants by group and all sample
AFI android fat index, BMI body mass index, HbA1c glycated hemoglobin, HIIT high-intensity interval training, MCT moderate continuous training, MVPA
moderate-to-vigorous physical activity, WC waist circumference, WBFI whole-body fat index * Differences between group baseline values (p < 0.05)
†Skewed values are presented as median ± inter quartile range
Intention to treat baseline values Per‑protocol baseline values
Control (n = 27) MCT (n = 28) HIIT (n = 25) p‑value Control (n = 22) MCT (n = 16) HIIT (n = 13) p‑value
Age (years) 59.0 ± 8.1 59.7 ± 6.5 56.7 ± 8.3 0.575 60.8 ± 7.5 60.4 ± 6.8 58.9 ± 7.5 0.814
Woman, no (%) 48.1 53.6 40.0 0.612 50.0 56.3 30.8 0.367
Diabetes Diagnosis (years)† 5.0 ± 3.0 8.0 ± 9.0 5.0 ± 6.0 0.086 4.5 ± 3.25 8.0 ± 9.0 6.0 ± 6.0 0.091
Hypertension medication (%) 48.1 50.0 52.0 0.579 54.5 37.5 53.8 0.538
Oral antidiabetic medication
(%) 96.3 92.9 84.0 0.388 95.5 93.8 92.3 0.512
Lipid lower medication (%) 33.3 25.0 24.0 0.596 31.8 31.3 23.1 0.341
Weight (kg) 84.1 ± 15.8 82.7 ± 13.3 81.6 ± 16.8 0.906 85.9 ± 15.7 82.0 ± 13.8 84.2 ± 19.2 0.799 Height (cm) 165.5 ± 9.4 163.2 ± 8.4 164.8 ± 8.1 0.545 164.2 ± 9.5 162.9 ± 9.2 166.6 ± 8.1 0.615 BMI (kg/m2) 30.7 ± 5.0 31.1 ± 5.0 30.1 ± 5.7 0.722 31.7 ± 4.7 31.0 ± 5.5 30.2 ± 5.9 0.506 WC (cm) 103.0 ± 12.4 103.8 ± 11.3 102.7 ± 14.3 0.914 105.4 ± 11.2 103.5 ± 12.2 103.3 ± 15.8 0.946 WB Fat Index (kg/m2) 10.5 ± 3.3 11.0 ± 3.4 10.0 ± 3.9 0.725 11.2 ± 2.9 11.0 ± 3.4 10.1 ± 3.9 0.662 AFI (kg/m2) 1.0 ± 0.4 1.1 ± 0.4 1.0 ± 0.4 0.680 1.1 ± 0.3 1.1 ± 0.4 1.0 ± 0.4 0.843 MVPA (min/day)† 18.4 ± 26.4 30.5 ± 4.8 38.9 ± 29.4 0.008* 15.9 ± 23.1 38.1 ± 41.6 38.9 ± 30.1 0.012* HbA1c (mmol/mol)† 49.7 ± 20.7 53.2 ± 22.7 49.0 ± 12.3 0.545 48.1 ± 16.7 47.2 ± 22.1 50.8 ± 12.6 0.828 HbA1c (%)† 7.4 ± 1.8 7.4 ± 1.9 7.0 ± 1.1 0.545 6.9 ± 1.1 6.9 ± 1.6 6.9 ± 0.9 0.828 VO2peak (ml/kg/min) 25.9 ± 5.5 24.1 ± 3.2 27.1 ± 6.3 0.143 25.1 ± 5.6 23.9 ± 3.7 26.6 ± 5.3 0.345
Table 2 I nt en tion-t o-tr ea t analy sis f or the lipid and inflamma tor y pr ofile a t baseline and f ollo wing 1-y ear Betas c oefficien ts ar e pr esen ted as unstandar diz ed c oefficien ts adjust ed f or age , se x and baseline MVP A with the r espec tiv e 95% c onfidenc e in ter vals AFI andr oid fa t inde x, CRP , C-r eac tiv e pr ot ein, HIIT high-in tensit y in ter val tr aining , HDL -C high-densit y lipopr ot ein cholest er ol , IL -6 in ter leuk in 6; LDL -C lo w -densit y lipopr ot ein cholest er ol , MC T moder at e c on tinuous tr aining , TC total cholest er ol , TNF -α tumor necr osis fac tor alfa, WBFI whole -body fa t inde x * B et w een-gr
oup changes sig
nifican t a t p < 0.05 † W ithin-gr
oup changes sig
nifican t a t p < 0.05 + Skew ed v alues ar e pr esen ted as median ± in ter quar tile r ange Con tr ol (n = 27) MC T (n = 28) HIIT (n = 25) MC T* c on tr ol HIIT* c on tr ol MC T* HIIT O ut come Baseline 12 mon ths Δ Baseline 12 mon ths Δ Baseline 12 mon ths Δ β (95% CI) β (95% CI) β (95% CI) TC (mmol/L) 4.8 ± 1.0 5.2 ± 1.1 † 0.4 ± 0.8 4.9 ± 1.4 4.9 ± 1.3 0.0 ± 0.7 5.0 ± 1.0 4.9 ± 0.8 − 0.1 ± 0.6 − 0.02 (− 0.06; 0.01) − 0.03 (− 0.06; − 0.00)* 0.04 (− 0.02; 0.03) LDL ‑C (mmol/L) 3.4 ± 0.8 3.6 ± 1.0 0.2 ± 0.7 3.5 ± 1.2 3.5 ± 1.1 − 0.0 ± 0.6 3.6 ± 0.8 3.5 ± 0.7 − 0.1 ± 0.4 − 0.03 (− 0.05; 0.00) − 0.03 (− 0.05; − 0.00)* 0.00 (− 0.02; 0.02) HDL ‑C (mmol/L) 1.2 ± 0.2 1.2 ± 0.3 0.0 ± 0.1 1.2 ± 0.3 1.3 ± 0.3 0.1 ± 0.2 1.2 ± 0.3 1.3 ± 0.2 † + 0.1 ± 0.1 0.00 ( − 0.00; 0.01) 0.00 ( − 0.01; 0.01) − 0.00 (− 0.01; 0.00) Tr igly cer ides (mmol/L) + 1.5 ± 1.0 1.6 ± 1.2 0.1 ± 1.1 1.4 ± 1.2 1.3 ± 1.2 − 0.1 ± 0.7 1.3 ± 1.2 1.5 ± 0.9 0.2 ± 0.7 − 0.02 (− 0.05; 0.02) − 0.02 (− 0.05; 0.02) − 0.00 (− 0.03; 0.03) sCD163 (ng/L) 1.03 ± 0.4 1.00 ± 0.37 − 0.03 ± 0.3 0.89 ± 0.4 1.10 ± 0.4 0.21 ± 0.4 0.99 ± 0.4 0.98 ± 0.4 − 0.01 ± 0.3 − 0.01 (− 0.02;0.01) 0.00 (− 0.01;0.02) − 0.01 (− 0.02; 0.01) TNF ‑α (pg/ ml) + 0.10 ± 0.17 0.99 ± 1.16 † − 0.01 ± 0.7 0.09 ± 0.10 0.06 ± 1.12 − 0.3 ± 0.8 0.10 ± 0.29 0.05 ± 1.07 − 0.05 ± 0.7 − 0.02 (− 0.05; 0.01) − 0.03 (− 0.06; 0.00) 0.01 (− 0.02; 0.03) IL ‑6 (pg/ml) 19.6 ± 13.4 25.7 ± 14.4 † 6.0 ± 17.0 25.2 ± 14.3 23.1 ± 11.8 − 2.4 ± 13.6 19.9 ± 14.8 18.6 ± 10.8 − 1.3 ± 12.5 − 0.70 (− 1.35; − 0.05)* − 0.62 (− 1.24; − 0.00)* − 0.08 (− 0.62; 0.46) CRP (nmol/L) + 32.3 ± 61.0 29.7 ± 35.3 − 2.6 ± 32.4 21.0 ± 34.7 23.9 ± 55.1 2.9 ± 35.0 29.7 ± 36.9 21.9 ± 59.3 − 7.8 ± 54.7 0.86 ( − 0.57; 2.28) 0.92 ( − 0.90; 2.73) − 0.06 (− 1.91; 1.78) Cor tisol (nmol/L) + 398.0 ± 174.4 391.4 ± 264.3 − 6.6 ± 307.7 466.5 ± 358.2 368.9 ± 200.3 − 97.6 ± 414.5 408.4 ± 357.0 402.2 ± 251.4 − 6.6 ± 307.7 − 1.31 (− 16.7; 14.1) − 1.90 (− 14.9; 11.1) 0.59 (− 14.7; 15.9) WBFI (k g/m 2) 10.5 ± 3.3 10.7 ± 3.5 0.2 ± 0.9 11.0 ± 3.4 10.5 ± 3.5† − 0.5 ± 1.3 10.0 ± 3.9 9.7 ± 4.1 − 0.3 ± 0.8 − 0.06 (− 0.12; − 0.01)* − 0.04 (− 0.09; 0.01) − 0.02 (− 0.07; 0.03) AFI (k g/m 2) 1.0 ± 0.4 1.0 ± 0.4 0.0 ± 0.2 1.1 ± 0.4 1.0 ± 0.4† − 0.1 ± 0.2 1.0 ± 0.4 1.0 ± 0.4 − 0.0 ± 0.1 − 0.01 (− 0.02; − 0.01)* − 0.01 (− 0.01; 0.02) − 0.01 (− 0.01; 0.00) W C ( cm) 103.0 ± 12.4 102.7 ± 11.8 − 0.3 ± 4.4 103.8 ± 11.3 101.8 ± 12.1 − 2.0 ± 4.9 102.7 ± 14.3 101.6 ± 14.4 − 1.1 ± 5.0 − 0.17 (− 0.44; 0.09) − 0.08 (− 0.31; 0.15) − 0.08 (− 0.32; 0.16) W eight (k g) 84.1 ± 15.8 84.7 ± 15.2 0.6 ± 4.1 82.7 ± 13.4 82.0 ± 14.5 − 0.7 ± 5.1 81.6 ± 16.8 81.0 ± 17.0 − 0.6 ± 3.6 − 0.12 (− 0.34; 0.10) − 0.08 (− 0.27; 0.12) − 0.04 (− 0.26; 0.18)
Table 3 Lipid and inflamma tor y pr ofile a t baseline and f ollo wing 1-y
ear using the p
er-pr ot oc ol analy sis Betas c oefficien ts ar e pr esen ted as unstandar diz ed c oefficien ts adjust ed f or age , se x and baseline MVP A with the r espec tiv e 95% c onfidenc e in ter vals AFI andr oid fa t inde x, CRP C-r eac tiv e pr ot ein, HIIT high-in tensit y in ter val tr aining , HDL -C high-densit y lipopr ot ein cholest er ol , IL -6 in ter leuk in 6; LDL -C lo w -densit y lipopr ot ein cholest er ol , MC T moder at e c on tinuous tr aining , TC total cholest er ol , TNF -α tumor necr osis fac tor alfa, WBFI whole -body fa t inde x * B et w een-gr
oup changes sig
nifican t a t p < 0.05 † W ithin-gr
oup changes sig
nifican t a t p < 0.05 + Skew ed v alues ar e pr esen ted as median ± in ter quar tile r ange Con tr ol (n = 27) MC T (n = 28) HIIT (n = 25) MC T* C on tr ol HIIT* C on tr ol MC T* HIIT O ut come Baseline 12 mon ths Δ Baseline 12 mon ths Δ Baseline 12 mon ths Δ β (95% CI) β (95% CI) β (95% CI) TC (mmol/L) 4.8 ± 0.9 5.2 ± 1.1† 0.4 ± 0.9 4.5 ± 0.9 4.6 ± 0.9 0.1 ± 0.7 5.0 ± 1.1 4.9 ± 0.9 − 0.1 ± 0.6 − 0.00 (− 0.05; 0.04) − 0.02 (− 0.07; 0.03) 0.01 ( − 0.34; 0.04) LDL ‑ C (mmol/L) 3.4 ± 0.8 3.7 ± 1.0 0.3 ± 0.8 3.3 ± 0.9 3.2 ± 0.6 − 0.1 ± 0.7 3.6 ± 0.9 3.5 ± 0.8 − 0.1 ± 0.4 − 0.03 (− 0.07; 0.00) − 0.03 (− 0.07; − 0.00)* − 0.00 (− 0.00; 0.07) HDL ‑ C (mmol/L) 1.2 ± 0.3 1.2 ± 0.3 0.0 ± 0.2 1.2 ± 0.2 1.2 ± 0.2 0.0 ± 0.2 1.3 ± 0.3 1.3 ± 0.3 0.0 ± 0.2 − 0.00 (− 0.01; 0.01) 0.00 ( − 0.01; 0.01) − 0.00 (− 0.02; 0.01) Tr igly cer ides (mmol/L) + 1.8 ± 0.9 1.9 ± 0.9 0.1 ± 1.2 1.4 ± 0.7 1.5 ± 0.6 0.1 ± 0.5 1.9 ± 1.0 1.7 ± 0.7 − 0.2 ± 0.6 − 0.00 (− 0.05; 0.04) − 0.02 (− 0.07; 0.03) 0.02 ( − 0.01; 0.05) sCD163 (ng/L) 1.01 ± 0.4 0.95 ± 0.4 − 0.06 ± 0.3 0.95 ± 0.3 1.20 ± 0.4 0.25 ± 0.5 0.94 ± 0.5 1.01 ± 0.2 0.06 ± 0.4 − 0.01 (− 0.03;0.01) − 0.00 (− 0.02;0.02) − 0.01 (− 0.03;0.02) TNF ‑ α (pg/ ml) + 0.34 ± 0.59 0.76 ± 0.60† − 0.42 ± 0.7 0.29 ± 0.49 0.52 ± 0.62 0.23 ± 0.8 0.46 ± 0.60 0.65 ± 0.61 0.19 ± 0.8 − 0.02 (− 0.06; 0.03) − 0.02 (− 0.06; 0.02) 0.00 ( − 0.05; 0.05) IL ‑6 (pg/ml) 18.7 ± 13.1 25.7 ± 14.6† 7.0 ± 17.3 25.4 ± 15.9 21.8 ± 11.8 − 3.6 ± 16.4 17.8 ± 15.1 16.2 ± 8.9 − 1.6 ± 12.7 − 0.89 (− 1.77; − 0.01)* − 0.72 (− 1.53; 0.09) − 0.17 (− 1.02; 0.68) CRP (nmol/L) + 47.2 ± 36.3 41.8 ± 34.7 − 5.4 ± 35.2 33.3 ± 27.7 46.4 ± 35.0 13.1 ± 29.9 41.0 ± 31.7 42.6 ± 36.6 1.6 ± 58.3 1.54 ( − 0.12; 3.20) 0.58 ( − 2.23; 3.39) 0.95 ( − 1.82; 3.74) Cor tisol (nmol/L) + 457.3 ± 210.8 454.3 ± 234.6 − 2.9 ± 334.6 548.7 ± 309.3 485.9 ± 415.8 − 62.8 ± 474.3 559.9 ± 192.7 431.5 ± 129.2 − 128.5 ± 171 − 4.98 (− 26.9; 16.9) − 10.5 (− 24.1; 3.1) 5.47 ( − 14.7; 25.7) WBFI (k g/m 2) 10.6 ± 3.4 10.8 ± 3.5 0.2 ± 0.9 10.6 ± 3.5 10.3 ± 3.5 − 0.3 ± 0.9 9.9 ± 4.0 9.5 ± 3.9 − 0.3 ± 0.8 − 0.04 (− 0.09; 0.01) * − 0.04 (− 0.08; 0.01) − 0.01 (− 0.06; 0.04) AFI (k g/m 2) 1.0 ± 0.4 1.0 ± 0.3 0.0 ± 0.2 1.1 ± 0.4 1.0 ± 0.4 − 0.1 ± 0.2 1.0 ± 0.4 0.9 ± 0.4 − 0.1 ± 0.1 − 0.01 (− 0.02; 0.00) − 0.00 (− 0.01; 0.00) − 0.01 (− 0.01; 0.00) W C ( cm) 105.4 ± 11.2 104.6 ± 11.3 − 0.8 ± 3.6 103.5 ± 12.2 103.1 ± 12.2 − 0.4 ± 3.7 103.3 ± 15.7 102.9 ± 15.4 − 0.4 ± 3.6 0.04 ( − 0.16; 0.23) 0.04 ( − 0.16; 0.24) 0.00 ( − 0.22; 0.22) W eight (k g) 85.9 ± 15.7 85.6 ± 15.4 − 0.3 ± 3.6 82.0 ± 13.8 81.8 ± 13.9 − 0.2 ± 3.5 84.2 ± 19.2 83.9 ± 18.6 − 0.3 ± 3.1 0.01 ( − 0.18; 0.19) − 0.00 (− 0.18; 0.18) 0.01 ( − 0.19; 0.20)
Discussion
To the best of our knowledge, this is the first RCT ana-lysing the long-term impact of combined training with different intensities, on lipid and inflammatory profile in individuals with T2DM. The main finding was that long-term HIIT aerobic exercise, while combined with RT, can be used to prevent further derangement of total choles-terol, LDL-C and IL-6 in individuals with T2DM. Regard-ing the MCT group, we observed favourable changes only on IL-6, with no impact on the lipid profile after 1-year of intervention. Finally, there was no statistically signifi-cant difference in any of the biomarkers measured when comparing HIIT with RT group with the MCT with RT group.
Low-grade systemic inflammation has been indepen-dently implicated in metabolic disorders, such as insu-lin resistance and T2DM, and is typically presented with elevated levels of pro-inflammatory cytokines (i.e. IL-6, TNF-α, and CRP) [28, 29]. On the other hand, exercise can be used to prevent or counter the detrimental met-abolic effects of elevated pro-inflammatory cytokines on different organs and tissues of the body [13]. In our investigation, both the MCT and HIIT combined with RT regimens showed favourable changes in the circulat-ing levels of IL-6 followcirculat-ing 1-year of exercise when com-pared with the control group, although no results were
observed for the remaining inflammatory markers. The number of investigations that have analysed the impact of HIIT on the inflammatory profile in T2DM are scarce, with only two short-term interventions (< 12-week dura-tion) reporting no substantial effects on IL-6, TNF-α, and CRP [19, 20].
Similar results to the ones in our investigation were found with reduced levels of IL-6, as well as CRP, while using a different protocol of high-intensity continuous training, either alone or combined with RT, in individu-als with T2DM [30]. However, only the combination of aerobic and RT had a significant impact on the circulat-ing levels of TNF-α.
Most of the benefits of exercise on the inflamma-tory profile seem to be mediated by body composi-tion changes. For instance, without weight loss, a twice-weekly progressive aerobic program in patients with T2DM did not observe any changes in TNF-α and CRP levels following a 6-month intervention [31], which follows our findings. On the other hand, a 1-year aerobic exercise intervention plus weight loss [32] showed a sig-nificant reduction in both TNFα and CRP. Moreover, in overweight/obese individuals without T2DM, short and medium-term interventions have also observed a reduc-tion in IL-6 following 2 weeks [33], and 16 weeks of HIIT [34], where modest weight loss was observed.
Fig. 2 Intention‑to‑treat analysis derived from the GEE mixed model of the 1‑year exercise intervention on total cholesterol, LDL colestherol, IL‑6,
sCD163, whole body fat and abdominal fat index. Absolute mean values and standard errors of means are presented, with models adjusted for sex and baseline MVPA. Abbreviations: HIIT, high‑intensity interval training; LDL‑C, low‑density lipoprotein cholesterol; MCT, moderate continuous training. * HIIT vs. control group changes significant at p < 0.05; † MCT vs. control group changes significant at p < 0.05
Beyond weight loss and the reduction in visceral fat mass, there are other proposed mechanisms for the improvements in the inflammatory profile following an exercise intervention [13, 29]. In fact, it is possible that the larger effect size for improvements in IL-6 observed in the MCT group combined with RT compared to the HIIT group combined with RT could be due to decreases in AFI and WBFI, which was not observed in the HIIT group. Nevertheless, the HIIT group still had a time-by-group interaction in IL-6 compared to the controls, regardless of body fat loss. Thus, it is possible that other mechanisms are responsible for the favourable changes in IL-6, such as the increased production of muscular anti-inflammatory myokines and the reduction of human monocyte Toll-like receptors 2 with exercise [35–37].
Another important finding from this investigation con-cerns the long-term impact of different exercise permuta-tions on the sCD163 biomarker. Our results suggest that regardless of the exercise group there were no changes on the sCD163. The sCD163 molecule is increased after macrophage activation, with individuals with higher levels of adipose tissue having higher expression of this biomarker [38]. In fact, sCD163 has been positively asso-ciated with, obesity [6] and T2DM [7]. However, little is known about the effects of exercise on sCD163, with no study addressing the impact of different exercise intensi-ties on this marker in individuals with T2DM. In individ-uals with non-alcoholic liver disease, a 3-month lifestyle intervention program, with both PA and dietary coun-selling, reduced the levels of sCD163 [39]. In contrast, decreased values have only been observed with dietary-induced weight loss [6], suggesting that sCD163 changes are dependent on body weight loss, particularly that of adipose tissue, which leads to a reduction of infiltrated active macrophages. Nevertheless, even with total and abdominal body fat reduction, as previously reported in the main findings of this study [22], the MCT group did not display corresponding decreases in sCD163 following the 1-year intervention. Future studies are warranted to further understand relationships among exercise train-ing, sCD163, and adiposity in individuals with T2DM.
Regular exercise has also been shown to improve the lipid profile in individuals with T2DM [40, 41]. In our investigation, only the HIIT group observed significant changes in the circulating levels of LDL-C and total cho-lesterol compared to controls, whereas no changes were observed for the MCT group after 1-year of interven-tion. A recent meta-analysis in individuals with T2DM, examined the effects of HIIT and MCT on several bio-markers, including the lipid profile [42]. The analysis suggested that there were no differences between higher and moderate exercise intensities. However, the results were inconsistent between studies, with two reporting
no effects of HIIT and MCT on LDL-C, HDL-C, total cholesterol and triglycerides [43, 44], and only one study observing changes in HDL-C and LDL-C with both HIIT and MCT, and decreased total cholesterol with [16]. The differences between these results and those reported in the present investigation may be explained by the base-line values of the participants, with most of our partici-pants having relatively normal ranges of total cholesterol, HDL-C, and LDL-C levels, which did not change greatly after exercise. However, the biggest impact of the HIIT group on the lipid profile lies in differences against the control group, who incurred in adverse changes in their lipid profile over the course of 1-year without any exer-cise intervention. Moreover, the exerexer-cise protocols dif-fered substantially between studies [16, 43, 44], with none of the interventions using the 1:1 (active-to-rest period ratio) protocol on a cycle ergometer and none of the interventions having a duration longer than 16-weeks. Another possible confounding factor is the baseline MVPA values (which were higher in the HIIT group), since it has been shown that higher physical activity intensities may be related with a more favour-able lipid profile [45]. However, both HIIT and MCT had similar frequencies of patients fulfilling the PA guidelines and similar levels of cardiorespiratory fitness at baseline. Moreover, the results of the intervention remained the same after adjusting the models for baseline MVPA.
Given the results of our previous findings on vascular function [46], where the HIIT combined with RT had superior improvements when compared to MCT, we can speculate that the favourable changes in the lipid and inflammatory profile observed in the HIIT com-bined with RT group may have been mediated by some of these changes, alongside with other mechanism already addressed in the previous manuscript [46]. Nonetheless, even though we have shown that HIIT can be a feasible option for long-term clinical interventions (1-year), it maybe not be a viable solution in a more ecological set-ting given the physiological and psychological burden associated with long-term HIIT [21]. Thus, on the long run HIIT may be better suited in combination with intermittent periods of lower intensity trainings such as MCT to increase participant’s exercise adherence and enjoyment.
Despite the encouraging results observed, there are limitations in the present investigation that should be addressed. First, given that the sample size calculation for the D2FIT study was based off of the primary study out-come (i.e. HbA1c difference) and that for many inflam-matory markers, such as that of CRP, as well as many of the lipid indices are known to exhibit high within-indi-vidual variability [47], it is likely that the lack of exer-cise intervention effect observed on many of the lipid
and inflammatory parameters was due to small sample size. Another limitation involves t he lack of mid-term assessments during the 1-year intervention period, which did not allow for the assessment of the evolution of the inflammatory and lipid profile, especially in the first months of the intervention, where the adherence to the exercise programs may be higher. In addition, energy intake was not controlled during the interven-tion, which might have affected the lipid profile. As far as the strengths of our investigation are concerned, we used a 1-year intervention with supervised exercise ses-sions, which provides, for the first time, information on the long-term implications of combined HIIT and MCT protocols combined with RT in patients with T2DM. Conclusions
In conclusion, 1-year of combined training with MCT and HIIT induced favourable changes in circulating lev-els of IL-6, which may reflect the prevention of further derangement in the low-grade systemic inflammation typical in individuals with T2DM. Nonetheless, only HIIT was effective in attenuating the increases observed in the control group for both total cholesterol and LDL-C. Therefore, HIIT may be considered an effective strat-egy and an alternative to the traditional MCT guidelines, with similar or even greater long-term benefits, for improving inflammatory and lipid profiles in individuals with T2DM.
Abbreviations
AFI: Abdominal fat index; CVD: Cardiovascular disease; CRP: C‑reactive protein; Hba1c: Glycated haemoglobin; scd163: Haptoglobin‑hemoglobin receptor CD163; HRR: Heart rate reserve; HIIT: High‑intensity interval training; ITTA : Intention‑to‑treat analysis; IL‑6: Interleukin‑6; MCT: Moderate continuous train‑ ing; MVPA: Moderate‑to‑vigorous PA; PPA: Per‑protocol analysis; PA: Physical activity; RCT : Randomized control trials; RT: Resistance training; TNF‑α: Tumour necrosis factor‑α; T2DM: Type 2 diabetes; WBFI: Whole‑body fat index. Acknowledgements
The authors are grateful to all participants for their time and effort. Authors’ contributions
LBS, JR and MB contributed to the conception and design of the study. JPM, DAS, RTR, IRC, AM, and MHR were responsible for data acquisition, analysis, and interpretation. MHR and RTR contributed to the discussion and reviewed/ edited the manuscript. IRC and MHR reviewed/edited the manuscript. LBS, JR and MB researched data and revised it critically for important intellectual content. JPM, drafted the manuscript. All authors gave approval of the final version and agreement to be accountable for all aspects of the work in ensur‑ ing that questions related to the accuracy or integrity of any part of the work were appropriately investigated and resolved. All authors read and approved the final manuscript.
Funding
This work was supported by fellowships from the Portuguese Foundation for Science and Technology (JM grant: SFRH/BD/85742/2012; IRC grant: IRC: SFRH/BD/149394/2019). This work is also financed by a national grant through the FCT–Fundação para a Ciência e Tecnologia within the unit I&D 447 (UIDB/00447/2020).
Availability of data and materials
The datasets used during the current study are available from the correspond‑ ing author on reasonable request.
Ethics approval and consent to participate
The protocol was approved by the Ethics Committee of the Portuguese Diabetes Association (approval number: 07/17/2013). This study was carried out in accordance with the recommendations of the Declaration of Helsinki for Human Studies. Written informed consents were obtained from all participants.
Consent for publication
All authors gave their consent to publish. Competing of interests
The authors declare that there is no conflict of interest associated with this manuscript.
Author details
1 Exercise and Health Laboratory, CIPER, Faculdade de Motricidade Humana,
Universidade de Lisboa, Estrada da Costa, 1499‑002 Cruz‑Quebrada, Portugal.
2 Education and Research Centre, APDP–Diabetes Portugal (APDP‑ERC),
Rua Rodrigo da Fonseca 1, 1250‑189 Lisbon, Portugal. 3 Genetics Labora‑
tory Environmental Health Institute (ISAMB), Faculty of Medicine, University of Lisbon, Avenida Professor Egas Moniz MB, 1649‑028 Lisbon, Portugal.
4 Instituto de Investigação Científica Bento da Rocha Cabral, Calçada Bento
da Rocha Cabral 14, 1250‑012 Lisbon, Portugal. 5 Tumor & Microenvironment
Interactions Group i3S ‑Instituto de Investigação e Inovação em Saúde/ INEB‑Institute of Biomedical Engineering, University of Porto, Rua Alfredo Allen, 208, 4200‑135 Porto, Portugal. 6 Abel Salazar Institute for the Biomedical
Sciences (ICBAS), University of Porto, Rua de Jorge Viterbo Ferreira No. 228, 4050‑313 Porto, Portugal.
Received: 22 June 2020 Accepted: 23 September 2020
References
1. Rawshani A, Rawshani A, Franzen S, Sattar N, Eliasson B, Svensson AM, et al. Risk factors, mortality, and cardiovascular outcomes in patients with type 2 diabetes. N Engl J Med. 2018;379(7):633–44.
2. Hotamisligil GS. Inflammation and metabolic disorders. Nature. 2006;444(7121):860–7.
3. Bosanska L, Michalsky D, Lacinova Z, Dostalova I, Bartlova M, Haluzikova D, et al. The influence of obesity and different fat depots on adipose tissue gene expression and protein levels of cell adhesion molecules. Physiol Res. 2010;59(1):79–88.
4. Kern PA, Ranganathan S, Li C, Wood L, Ranganathan G. Adipose tissue tumor necrosis factor and interleukin‑6 expression in human obesity and insulin resistance. Am J Physiol Endocrinol Metab. 2001;280(5):E745–51. 5. Hotamisligil GS. Endoplasmic reticulum stress and inflammation in obe‑
sity and type 2 diabetes. Novartis Found Symp. 2007;286:86–94. 6. Fjeldborg K, Christiansen T, Bennetzen M, Møller H, Pedersen SB,
Richelsen B. The macrophage‑specific serum marker, soluble CD163, is increased in obesity and reduced after dietary‑induced weight loss. Obesity. 2013;21(12):2437–43.
7. Moller HJ, Frikke‑Schmidt R, Moestrup SK, Nordestgaard BG, Tybjaerg‑ Hansen A. Serum soluble CD163 predicts risk of type 2 diabetes in the general population. Clin Chem. 2011;57(2):291–7.
8. American Diabetes A. 1, Diabetes American. Improving care and promot‑ ing health in populations: standards of medical care in diabetes‑2020. Diabetes Care. 2020;43(Suppl 1):S7–13.
9. Sabag A, Way KL, Keating SE, Sultana RN, O’Connor HT, Baker MK, et al. Exercise and ectopic fat in type 2 diabetes: a systematic review and meta‑ analysis. Diabetes Metab. 2017;43(3):195–210.
10. Jiang Y, Tan SJ, Wang ZY, Guo Z, Li QW, Wang JX. Aerobic exercise training at maximal fat oxidation intensity improves body composition, glycemic control, and physical capacity in older people with type 2 diabetes. J Exerc Sci Fit. 2020;18(1):7–13.
11. Knowler WC, Barrett‑Connor E, Fowler SE, Hamman RF, Lachin JM, Walker EA, et al. Reduction in the incidence of type 2 diabetes with lifestyle intervention or metformin. N Engl J Med. 2002;346(6):393–403. 12. Pan XR, Li GW, Hu YH, Wang JX, Yang WY, An ZX, et al. Effects of diet and
exercise in preventing NIDDM in people with impaired glucose tolerance. The Da Qing IGT and Diabetes Study. Diabetes Care. 1997;20(4):537–44. 13. Gleeson M, Bishop NC, Stensel DJ, Lindley MR, Mastana SS, Nimmo MA.
The anti‑inflammatory effects of exercise: mechanisms and implica‑ tions for the prevention and treatment of disease. Nat Rev Immunol. 2011;11(9):607–15.
14. Dun Y, Thomas RJ, Smith JR, Medina‑Inojosa JR, Squires RW, Bonikowske AR, et al. High‑intensity interval training improves metabolic syndrome and body composition in outpatient cardiac rehabilitation patients with myocardial infarction. Cardiovasc Diabetol. 2019;18(1):104.
15. Marquis‑Gravel G, Hayami D, Juneau M, Nigam A, Guilbeault V, Latour E, et al. Intensive lifestyle intervention including high‑intensity interval training program improves insulin resistance and fasting plasma glucose in obese patients. Prev Med Rep. 2015;2:314–8.
16. Mitranun W, Deerochanawong C, Tanaka H, Suksom D. Continuous vs interval training on glycemic control and macroand microvascular reac‑ tivity in type 2 diabetic patients. Scand J Med Sci Spor. 2014;24(2):E69–76. 17. Gibala MJ, Little JP. Just HIT it! A time‑efficient exercise strat‑
egy to improve muscle insulin sensitivity. J Physiol‑London. 2010;588(18):3341–2.
18. Wormgoor SG, Dalleck LC, Zinn C, Harris NK. Effects of high‑intensity interval training on people living with type 2 diabetes: a narrative review. Can J Diabetes. 2017;41(5):536–47.
19. Madsen SM, Thorup AC, Bjerre M, Jeppesen PB. Does 8 weeks of strenu‑ ous bicycle exercise improve diabetes‑related inflammatory cytokines and free fatty acids in type 2 diabetes patients and individuals at high‑risk of metabolic syndrome? Arch Physiol Biochem. 2015;121(4):129–38. 20. Mallard AR, Hollekim‑Strand SM, Coombes JS, Ingul CB. Exercise intensity,
redox homeostasis and inflammation in type 2 diabetes mellitus. J Sci Med Sport. 2017;20(10):893–8.
21. Jabardo‑Camprubi G, Donat‑Roca R, Sitja‑Rabert M, Mila‑Villarroel R, Bort‑Roig J. Drop‑out ratio between moderate to high‑intensity physical exercise treatment by patients with, or at risk of, type 2 diabetes mellitus: a systematic review and meta‑analysis. Physiol Behav. 2020;215:112786. 22. Magalhaes JP, Judice PB, Ribeiro R, Andrade R, Raposo J, Dores H, et al.
Effectiveness of high‑intensity interval training combined with resistance training versus continuous moderate‑intensity training combined with resistance training in patients with type 2 diabetes: a one‑year rand‑ omized controlled trial. Diabetes Obes Metab. 2019;21(3):550–9. 23. Standards of Medical Care in Diabetes‑2017: Summary of Revisions.
Diabetes Care. 2017;40(Suppl 1):S4‑S5.
24. Boule NG, Haddad E, Kenny GP, Wells GA, Sigal RJ. Effects of exercise on glycemic control and body mass in type 2 diabetes mellitus: a meta‑ analysis of controlled clinical trials. JAMA. 2001;286(10):1218–27. 25. Karvonen MJ, Kentala E, Mustala O. The effects of training on heart rate; a
longitudinal study. Annales medicinae experimentalis et biologiae Fen‑ niae. 1957;35(3):307–15.
26. CDC. National health and nutrition examination survey (NHANES) ‑ Anthropometry procedures manual. https ://www.cdc.gov/nchs/nhane s/ nhane s2015 ‑2016/manua ls15_16.htm20 16.
27. Troiano RP, Berrigan D, Dodd KW, Masse LC, Tilert T, McDowell M. Physical activity in the United States measured by accelerometer. Med Sci Sports Exerc. 2008;40(1):181–8.
28. van Greevenbroek MM, Schalkwijk CG, Stehouwer CD. Obesity‑associated low‑grade inflammation in type 2 diabetes mellitus: causes and conse‑ quences. Neth J Med. 2013;71(4):174–87.
29. Yudkin JS. Inflammation, obesity, and the metabolic syndrome. Horm Metab Res. 2007;39(10):707–9.
30. Balducci S, Zanuso S, Nicolucci A, Fernando F, Cavallo S, Cardelli P, et al. Anti‑inflammatory effect of exercise training in subjects with type
2 diabetes and the metabolic syndrome is dependent on exercise modalities and independent of weight loss. Nutr Metab Cardiovasc Dis. 2010;20(8):608–17.
31. Zoppini G, Targher G, Zamboni C, Venturi C, Cacciatori V, Moghetti P, et al. Effects of moderate‑intensity exercise training on plasma biomarkers of inflammation and endothelial dysfunction in older patients with type 2 diabetes. Nutr Metab Cardiovas. 2006;16(8):543–9.
32. Pedersen LR, Olsen RH, Anholm C, Astrup A, Eugen‑Olsen J, Fenger M, et al. Effects of 1 year of exercise training versus combined exercise train‑ ing and weight loss on body composition, low‑grade inflammation and lipids in overweight patients with coronary artery disease: a randomized trial. Cardiovasc Diabetol. 2019;18(1):127.
33. Leggate M, Carter WG, Evans MJ, Vennard RA, Sribala‑Sundaram S, Nimmo MA. Determination of inflammatory and prominent proteomic changes in plasma and adipose tissue after high‑intensity intermittent training in overweight and obese males. J Appl Physiol. 2012;112(8):1353–60. 34. Gerosa‑Neto J, Antunes BM, Campos EZ, Rodrigues J, Ferrari GD, Rosa
Neto JC, et al. Impact of long‑term high‑intensity interval and moderate‑ intensity continuous training on subclinical inflammation in overweight/ obese adults. J Exerc Rehab. 2016;12(6):575–80.
35. Durrer C, Francois M, Neudorf H, Little JP. Acute high‑intensity interval exercise reduces human monocyte Toll‑like receptor 2 expression in type 2 diabetes. Am J Physiol Regul Integr Comp Physiol. 2017;312(4):R529–38. 36. Febbraio MA, Pedersen BK. Muscle‑derived interleukin‑6: mechanisms for
activation and possible biological roles. FASEB J. 2002;16(11):1335–47. 37. Petersen AM, Pedersen BK. The anti‑inflammatory effect of exercise. J
Appl Physiol. 2005;98(4):1154–62.
38. Etzerodt A, Moestrup SK. CD163 and inflammation: biological, diagnostic, and therapeutic aspects. Antioxid Redox Signal. 2013;18(17):2352–63. 39. Rodgaard‑Hansen S, St George A, Kazankov K, Bauman A, George J,
Gronbaek H, et al. Effects of lifestyle intervention on soluble CD163, a macrophage activation marker, in patients with non‑alcoholic fatty liver disease. Scand J Clin Lab Invest. 2017;77(7):498–504.
40. Fikenzer K, Fikenzer S, Laufs U, Werner C. Effects of endurance training on serum lipids. Vascul Pharmacol. 2018;101:9–20.
41. Mann S, Beedie C, Jimenez A. Differential effects of aerobic exercise, resistance training and combined exercise modalities on cholesterol and the lipid profile: review, synthesis and recommendations. Sports Med. 2014;44(2):211–21.
42. De Nardi AT, Tolves T, Lenzi TL, Signori LU, Silva A. High‑intensity interval training versus continuous training on physiological and metabolic vari‑ ables in prediabetes and type 2 diabetes: a meta‑analysis. Diabetes Res Clin Pract. 2018;137:149–59.
43. Terada T, Friesen A, Chahal BS, Bell GJ, McCargar LJ, Boule NG. Feasibility and preliminary efficacy of high intensity interval training in type 2 diabe‑ tes. Diabetes Res Clin Pr. 2013;99(2):120–9.
44. Maillard F, Rousset S, Pereira B, Traore A, Del Amaze PD, Boirie Y, et al. High‑intensity interval training reduces abdominal fat mass in postmeno‑ pausal women with type 2 diabetes. Diabetes Metab. 2016;42(6):433–41. 45. Henson J, Edwardson CL, Davies MJ, Gill JMR, Heaney LM, Khunti K, et al.
Physical activity and lipidomics in a population at high risk of type 2 diabetes mellitus. J Sport Sci. 2020;38(10):1150–60.
46. Magalhaes JP, Melo X, Correia IR, Ribeiro RT, Raposo J, Dores H, et al. Effects of combined training with different intensities on vascular health in patients with type 2 diabetes: a 1‑year randomized controlled trial. Cardiovasc Diabetol. 2019;18(1):34.
47. Browning LM, Krebs JD, Jebb SA. Discrimination ratio analysis of inflam‑ matory markers: implications for the study of inflammation in chronic disease. Metabolism. 2004;53(7):899–903.
Publisher’s Note
Springer Nature remains neutral with regard to jurisdictional claims in pub‑ lished maps and institutional affiliations.